This Before and After Goodale Expressway addition shows a bit of the Columbus highway system’s earliest construction projects.
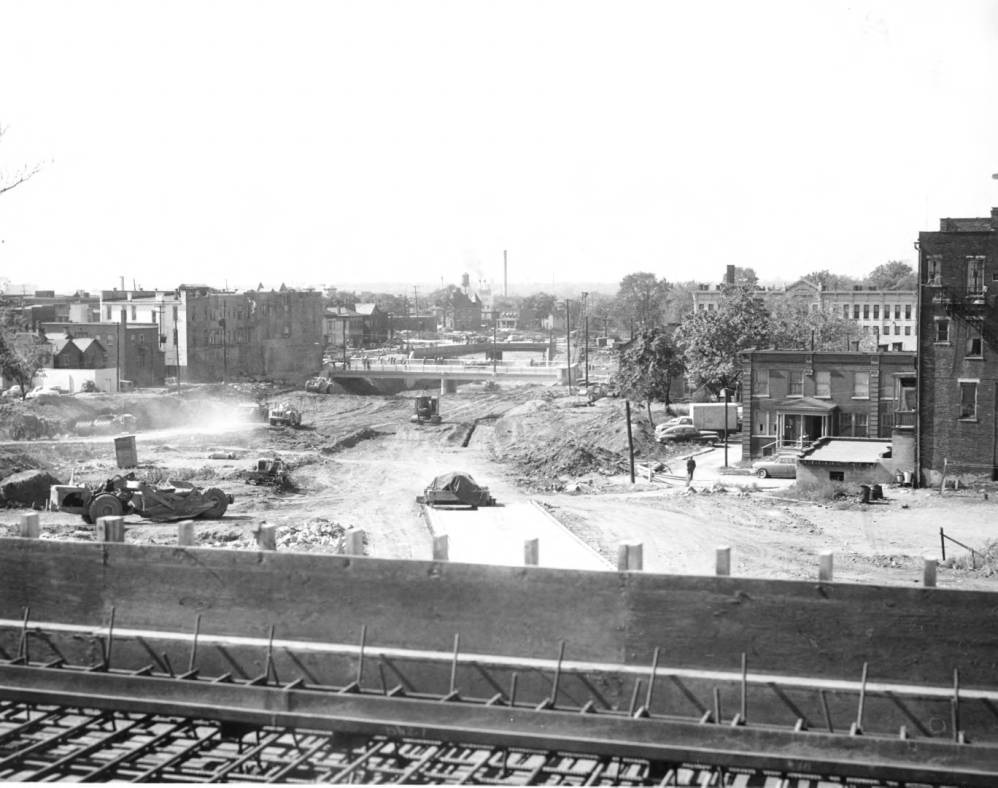
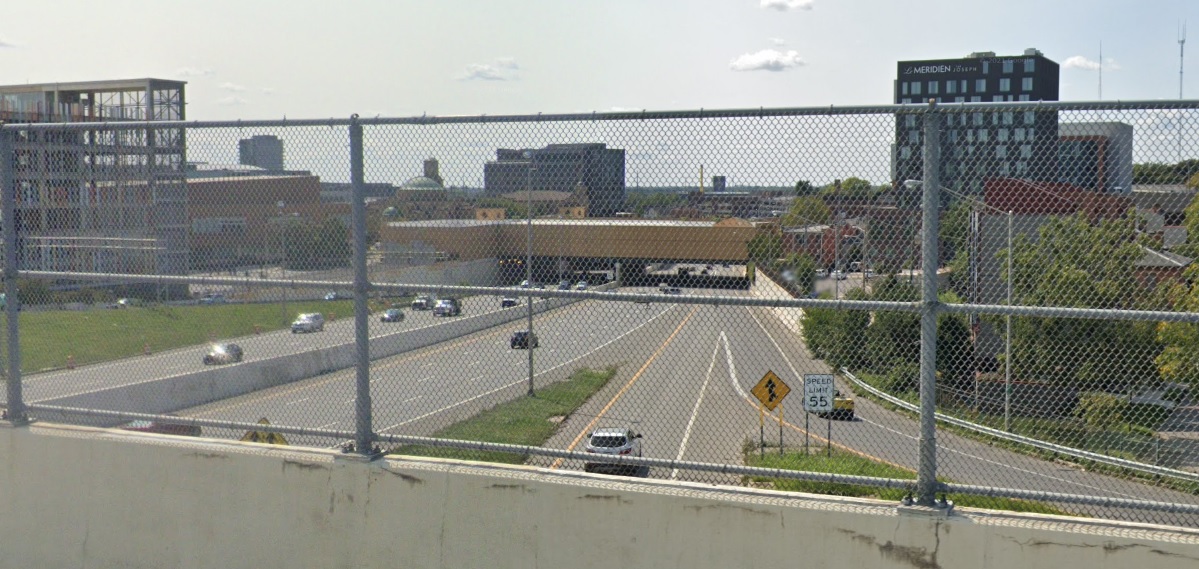
Before: Around 1960 The image above is taken from the then under construction 3rd Street Viaduct overlooking construction of the Goodale Expressway. It is facing west towards High Street, with Italian Village on the right. Although this section did not require significant demolitions due to preexisting railroad tracks, one of the big casualties a bit further west was Flytown, an area along and north of Goodale Avenue west and south of Victorian Village. The Goodale Expressway was one of the first sections of the Columbus highway system constructed, which is somewhat ironic given it would take more than 40 years to fully construct and be the last major highway completed. After decades of controversy, studies and false starts, the final stretch from 71 to the Rt. 62 interchange at 270 was completed in 2003. After: 2021 While an unfortunate fence blocks the view, you can still see how drastically the landscaped has changed after more than 60 years.
Next month, AllColumbusData.com will have its 10-year anniversary. Hard to believe! Here are some stats on just some of what the site now contains: -338 published posts. 10 additional are already complete and scheduled over the next few months. -105 specific content pages. -Well over 2,000 individual and before and after series historic photos. -143+ years of weather data for both Columbus and its suburbs. -200+ years of demographic and population data for Columbus and its suburbs. -Information and photos for hundreds of current and past development projects. -100+ videos.
What has been the most visited page, the most popular post over the years? Unfortunately, visitor data was lost prior to 2015 for various reasons. However, here have been the top 10 most popular posts and pages since 2015.
Top 10 Posts and the Year Published 1. Before and After How Columbus Changed in 10 Years 2021 This 2-part series was extremely popular last year, and easily became the most visited in the past 7 years. 2. Questions Answered- Columbus Zip Codes 2014 This post was very popular into 2018, but is now defunct. The information on this post ended up becoming bits and parts of other posts and pages. 3. Columbus Retail History- Shopping Centers 2013 One of the oldest posts on the site, it still gets consistent traffic almost a decade later. 4. Columbus Historic Church Demolition 2021 This one detailed plans to demolish an old church on the South Side. 5. Columbus Area Murders by Zip Code 2008-2015 2016 Pretty explanatory. This post provided crude maps of murders by zip code. 6. Columbus’ Greatest Snowstorm 2021 This post gave an account of the March 7-8, 2008 blizzard. 7. Columbus Area Zip Codes and Their Economies 2013 Still a consistent hit after a decade, this post gave details on economic information by local zip code. 8. Winter 2020-2021 Review 2021 Review the 2020-2021 winter with stats and rankings, something that has been done for all winters since 2014. 9. Franklin County Gentrification Trends 1990-2015 2017 This post looked at how income and race changes were driving neighborhood gentrification around Columbus. 10. How We Should Develop Around Intel 2022 The most recent on this list, this post deals with how the area around the Intel project should have a development plan, and detailed a hypothetical map of what that development could look like.
Top 10 Pages 1. Columbus Tornado History The most popular by far, this page covers historic tornadic events throughout the entire Columbus Metro Area. 2. Olde Towne East Historic Buildings This has been the most popular of all the Historic Building Database pages to date. 3. Proposed Development This regularly-updated development page highlights the region’s many proposed projects. 4. Other Residential Historic Buildings This page was one of the very first to be included in what would eventually become the Historic Building Database. It is defunct now, as its photos were eventually divided into a much greater expansion of featured neighborhoods. 5. Development Under Construction All the projects currently under construction at any given time. 6. Census Tract Maps Demographics, population and other data at the census tract level are provided in interactive maps going back to 1930. 7. Winter Storms This page chronicles significant winter weather events from the past. 8. Columbus Flood History As above, but dealing with flooding events. 9. Columbus Crime Statistics Violent and property crime data, maps and demographic data related to Columbus crime are provided going back about 40 years. 10. Completed Development Buildings and projects that were completed at some point in the past are highlighted on this page going back to the 19th Century.
Any surprises in what has been the most popular? Any posts or pages you’d like to see more of? Let me know here or on the Facebook page if you are enjoying the content or would like to see something different!
Halloween is my absolute most favorite holiday. The crisp, fall weather, the pumpkins, the candy, the costumes, the scare movie marathons… what’s not to like? Here are some great spooky links for Halloween to help you have the best holiday possible.
Columbus Halloween Climatology Curious to know what the historic weather was like on past Halloweens back to 1878? This is your link.
Ohio’s Haunted Attractions Looking for some spooky fun? This is yours. This is a great list to find all the haunted houses, hayrides and corn mazes near you.
2022 Trick or Treat Schedule NBC4 provides a list of Trick or Treat times across Central Ohio, so you have no excuse to miss out!
And don’t forget about Columbus’ largest costume party! HighBall Halloween
For the Housing Market Update August 2022, data from Columbus Realtors shows that the overall market saw a decrease in home sales and units on the market versus a year ago, a situation that contributed to the continuation of rising prices. So far, it doesn’t appear there has been any sustained impact yet from increasing interest rates. More data was added to this update than usual, including some county-level information.
Note: LSD= Local School District, CSD= City School District. In both cases, school district boundaries differ from city boundaries.
Median Sales Price By Columbus Metro County in August 2022 and Total Change vs. August 2021 1. Delaware: $448,000 +$34,000 2. Union: $420,000 +$83,500 3. Fairfield: $308,950 +$13,950 4. Hocking: $306,000 +$135,550 5. Pickaway: $295,000 +$42,000 6. Franklin: $285,700 +$15,700 7. Licking: $285,500 +$10,600 8. Madison: $272,000 +$9,500 9. Morrow: $230,000 +$50,000 10. Perry: $216,000 -$4,000
Median Sales Price % Change August 2022 vs. August 2021 1. Hocking: +79.5% 2. Morrow: +27.8% 3. Union: +24.8% 4. Pickaway: +16.6% 5. Delaware: +8.2% 6. Franklin: +5.8% 7. Fairfield: +4.7% 8. Licking: +3.9% 9. Madison: +3.6% 10. Perry: -1.8% Licking County saw relatively low growth in its home prices the past year, but that is almost certainly to change in the near future. Franklin County median home prices are still in the bottom half for total and growth.
Overall Market Median Sales Price in August: $306,715 Based on the 10 Columbus Metro Area counties. This price was a bit lower than in July, but almost $40,000 higher than August, 2021.
Top 15 Most Expensive Locations By Median Sales Price in August 2022 1. New Albany: $750,000 2. Grandview Heights: $685,000 3. New Albany Plain LSD: $575,500 4. Bexley: $575,000 5. Powell: $563,000 6. German Village: $554,500 7. Dublin: $552,500 8. Upper Arlington CSD: $540,000 9. Olentangy LSD: $500,000 10. Dublin CSD: $485,000 11. Short North: $465,000 12. Jonathan Alder LSD: $443,900 13. Granville CSD: $426,500 14. Northridge LSD: 417,340 15. Big Walnut LSD: $414,000 Median prices were generally lower in August than July, but still up versus August 2021.
Top 15 Least Expensive Metro Locations by Median Sales Price in August 2022 1. Circleville CSD: $150,000 2. Whitehall: $171,600 3. Valleyview: $184,900 4. Hamilton LSD: $187,500 5. Miami Trace LSD: $203,000 6. Lancaster CSD: $210,000 7. Jefferson LSD: $219,750 8. Newark CSD: $220,000 9. Columbus CSD: $234,900 10. Groveport Madison LSD: $250,000 11. Columbus: $256,000 12. South Western CSD: $273,700 13. Reynoldsburg CSD: $276,450 14. London CSD: $276,750 15. Minerva Park: $284,950
Top 15 Metro Locations with the Highest Median Sales Price % Growth Between August 2021 and August 2022 1. Bexley: +70.4% 2. Newark CSD: +29.4% 3. Obetz: +28.8% 4. London CSD: +25.8% 5. Grove City: +20.7% 6. Valleyview: +19.3% 7. Teays Valley LSD: +19.2% 8. Grandview Heights: +19.1% 9. Marysville CSD: +18.4% 10. Hilliard: +17.9% 11. Beechwold/Clintonville: +17.0% 12. Gahanna: +17.0% 13. Powell: +16.7% 14. New Albany: +16.3% 15. New Albany Plain LSD: +15.8% 16. Blacklick: +15.7%
Top 15 Locations with the Lowest Median Sales Price % Growth Between August 2021 and August 2022 1. Circleville CSD: -20.6% 2. Minerva Park: -9.3% 3. Granville CSD: -6.3% 4. Hamilton LSD: -3.8% 5. Jefferson LSD: -3.2% 6. Lancaster CSD: -2.8% 7. Big Walnut LSD: -0.4% 8. Buckeye Valley LSD: +0.9% 9. Downtown: +1.0% 10. Sunbury: +1.1% 11. Westerville: +2.2% 12. Johnstown-Monroe LSD: +3.2% 13. Columbus: +3.6% 14. Canal Winchester CSD: +4.3% 15. Westerville CSD: +4.5%
Overall Market Median Sales Price % Change August 2022 vs. August 2021:+14.6%
New Listings by Metro County in August 2022 and Change From August 2021 1. Franklin: 1,837 -361 2. Delaware: 314 -46 3. Licking: 255 -56 4. Fairfield: 230 -61 5. Pickaway: 91 +2 6. Union: 90 -19 7. Madison: 44 -4 8. Morrow: 40 -23 9. Hocking: 35 -9 10. Perry: 35 +7
Total Metro New Listings in August 2022: 2,971 Total Metro New Listings Change from August 2021 to August 2022: -570
% Change of New Listings by Metro County August 2021-August 2022 1. Morrow: -36.5% 2. Fairfield: -21.0% 3. Hocking: -20.5% 4. Licking: -18.0% 5. Union: -17.4% 6. Franklin: -16.4% 7. Delaware: -12.8% 8. Madison: -8.3% 9. Pickaway: +2.2% 10. Perry: +25.0%
% Change of Metro New Listings August 2021 to August 2022: -16.1% New listings continued year-over-year declines. Until the supply really starts to grow- or demand falls- prices will continue to rise.
Top 10 Locations with the Most New Listings in August 2022 1. Columbus: 1,224 2. Columbus CSD: 856 3. South Western CSD: 192 4. Olentangy LSD: 155 5. Hilliard CSD: 135 6. Westerville CSD: 122 7. Dublin CSD: 111 8. Pickerington LSD: 87 9. Upper Arlington CSD: 81 10. Grove City: 71
Top 10 Locations with the Fewest New Listings in August 2022 1. Valleyview: 1 2. Minerva Park: 3 3. Lithopolis: 6 4. Obetz: 6 5. Jefferson LSD: 8 6. Granville CSD: 9 7. Sunbury: 11 8. New Albany: 12 9. Grandview Heights: 13 10. Northridge LSD: 14 11. Miami Trace LSD: 14 12. German Village: 16 13. Bexley: 16
Metro Counties by # of Days Homes Remain on the Market Before Sale in August 2022 1. Fairfield: 12 2. Franklin: 13 3. Licking: 13 4. Union: 14 5. Delaware: 16 6. Perry: 16 7. Madison: 18 8. Hocking: 22 9. Pickaway: 26 10. Morrow: 36
Average # of Days Homes Remain on the Market Before Sale for the Metro Overall in August 2022: 18.6 # of Days Homes Remain on the Market Before Sale for the Metro August 2021 vs. August 2022: +7.0 In one of the few signs of a potential slowdown, homes took a week more on average to sell than they did during the same period last year.
Top 10 Fastest-Selling Locations by # of Days Homes Remain on the Market Before Sale in August 2022 1. Valleyview: 4 2. Blacklick: 6 3. Lithopolis: 6 4. Gahanna: 7 5. Gahanna Jefferson CSD: 8 6. Pickerington: 8 7. Pickerington LSD: 8 8. Granville CSD: 9 9. Newark CSD: 9 10. Powell: 9 11. Reynoldsburg CSD: 9 12. Buckeye Valley LSD: 10 13. Dublin: 10 14. Hilliard: 10 15. Hilliard CSD: 10 16. Marysville CSD: 10 17. Westerville CSD: 10 18. Canal Winchester CSD: 11 19. German Village: 11 20. Johnstown-Monroe LSD: 11 21. Northridge LSD: 11 22. Sunbury: 11 23. Westerville: 11 24. Worthington CSD: 11 25. Circleville CSD: 12 26. Delaware CSD: 12 27. Grandview Heights: 12 28. Groveport Madison LSD: 12 29. Worthington: 12 30. Columbus: 13 31. Dublin CSD: 13 32. South Western CSD: 13 33. Hamilton LSD: 14 34. Lancaster CSD: 14 35. Whitehall: 14
Top 10 Slowest-Selling Locations by # of Days Homes Remain on the Market Before Sale in August 2022 1. Downtown: 47 2. Obetz: 33 3. Teays Valley LSD: 32 4. Miami Trace LSD: 28 5. Short North: 26 6. Minerva Park: 22 7. Pataskala: 22 8. Big Walnut LSD: 20 9. New Albany: 20 10. New Albany Plain LSD: 19 11. Upper Arlington CSD: 18 12. Olentangy LSD: 17
Top 10 Locations with the Greatest % Decline of # of Days on the Market Before Sale August 2022 vs. August 2021 1. Valleyview: -69.2% 2. Powell: -52.6% 3. Sunbury: -50.0% 4. Grandview Heights: -45.5% 5. German Village: -35.3% 6. Downtown: -29.9% 7. Gahanna Jefferson CSD: -27.3% 8. New Albany: -25.9% 9. Bexley: -20.0% 10. Short North: -7.1%
Top 10 Locations with the Lowest % Decline of # of Days on the Market Before Sale August 2022 vs. August 2021 1. Teays Valley LSD: +300.0% 2. Miami Trace LSD: +211.1% 3. Delaware CSD: +200.0% 4. Groveport Madison LSD: +200.0% 5. Whitehall: +180.0% 6. Minerva Park: +175.0% 7. Pataskala: +175.0% 8. Northridge LSD: +120.0% 9. Obetz: +120.0% 10. Lithopolis: +100.0% 11. Pickerington: +80.0% 12. London CSD: +77.8% 13. Circleville CSD: +71.4%
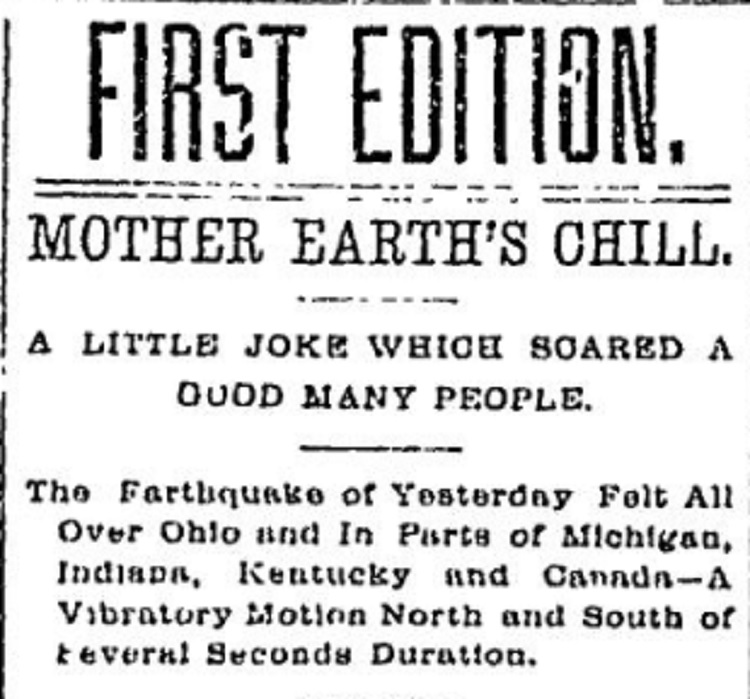
Columbus Dispatch headline from September 20, 1884.
This Strange Columbus 1884 Earthquake edition reviews a fairly rare event in the state-a damaging seismic event. While most earthquakes felt within the state have epicenters outside of Ohio- either west in the Missouri/Illinois area or north in Ontario or Quebec- the September, 1884 quake was one of the few damaging ones that had its origins within state borders. At around 2:45PM on the 19th, an estimated magnitude 4.8 tremor struck northwest Ohio. While 4.8 is not particularly strong as far as earthquakes go, Ohio’s geology allows even relatively weak quakes to shake the land with much greater force than in other parts of the country. The earthquake was felt across all of Ohio and several surrounding states. The Crestline Advocate, from small Crestline, Ohio to the west of Mansfield, provided accounts from all over the region a week after the event. Here are just a few.
From Crestline itself: A genuine earthquake visited this locality last Friday afternoon at 2:45, in which houses were made to tremble and furniture rattle. Several persons ran from dwellings and business houses, expecting everything to “fall in.” The swaying motion was very distinct, running east and west. The sensation was something new in this section. The experience here was the same as that telegraphed from numerous portions of the State. Our neighboring towns, also, reported a lively shaking up. James Booth says that, at the time of the occurrence, he was thrown from a lounge on which he was lying, then bounded up from the floor, whirled around, and went scooting out of his front door up into the air, and when he collected his scattered senses he found himself on the roof of his domicile, standing on his head. He didn’t say this in just so many words, but this was inferred from the experience he related.
COLUMBUS, O., September 20. – At 2:40p.m. yesterday, a shock of earthquake was felt in different parts of this city, the vibrations lasting over thirty seconds. At the Capitol (sic) University the chandeliers swayed to and fro and students left their rooms amid great excitement.
CLEVELAND, Ohio., September 20. – Yesterday afternoon an earthquake was felt in many parts of this city. Tables and furniture were moved in the houses, pictures on the walls were shaken, causing quite an excitement among the inmates. The motion was from west to east and was confined to three distinct rockings finally subsiding and dying away in a sort of a tremor.
CINCINNATI, O., September 20. – At 2:30 yesterday afternoon the shock of an earthquake was felt in this city and in Covington, Ky. There was a slight trembling of buildings and rocking motion felt, which was sufficiently marked to cause astonishment and comment. The motion was from north to south and was a gentle undulation, without any tremor or upheaval. The shocks lasted about ten seconds, there being a perceptible pause between the first and second. A gentleman, who was writing at home on Cutter Street, said he felt his table vibrate. It stopped and then moved again less violently than before. Reports from Mt. Vernon and Delaware, Ohio, say the shock was felt at their places.
A 1998 report on the event further described some of the damage and range of the earthquake. The earthquake caused damage at Lima, where the shock was “of considerable violence and caused much excitement.” Plaster was shaken from ceilings east and southeast of Columbus at Zanesville, Ohio, and Parkersburg, W. Va. Windows and dishes were broken at Defiance and Norwalk, Ohio; to the west at Fort Wayne and Muncie, Ind.; to the north at Lansing, Mich.; and to the east at Wheeling, W. Va. Furniture was displaced and 14 buildings were heavily shaken at Urbana, Ohio, in Champaign County, and at many other towns in the regions. Also felt in Iowa, Kentucky, Pennsylvania, and western Ontario, Canada, and at Washington, D.C. by workmen on top of the unfinished Washington Monument.
The exact epicenter was never determined, but research long after put the likely origin in Allen County.
The United Stated Geological Survey, or USGS, puts out an earthquake map with all current and past earthquakes from around the world. Users can select regions and search for earthquakes going back a century or more, or search based on magnitudes.