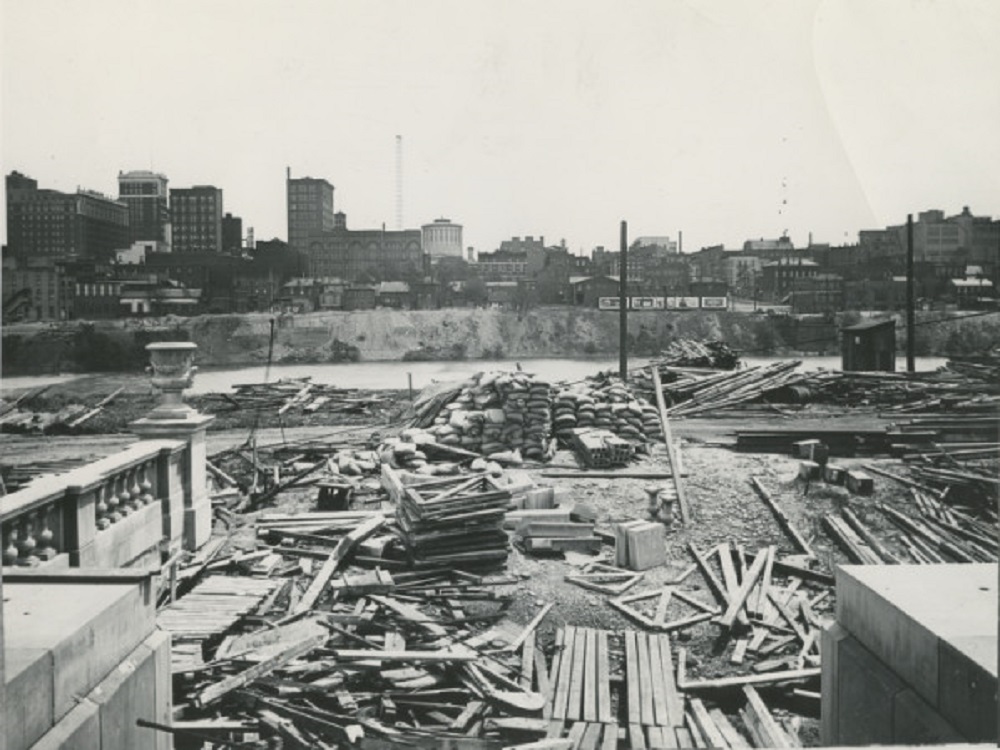
These before and after views from Franklinton show a snapshot in time of just how unattractive and people-unfriendly the riverfront once was.
Before: 1923 This view looks east from the Franklinton side of the Scioto River. At the time, Central High School was under construction, which is why the area looks like such a mess of materials. Central High School would be completed in 1924 and open on September 4th of that year. The school would remain open for 60 years before being shut down in the mid-1980s. The building sat empty for more than a decade before being renovated into the new COSI. Beyond the river, a much shorter Downtown skyline can be seen. The image predates LeVeque Tower and most of the government buildings that now line the Scioto’s shores.
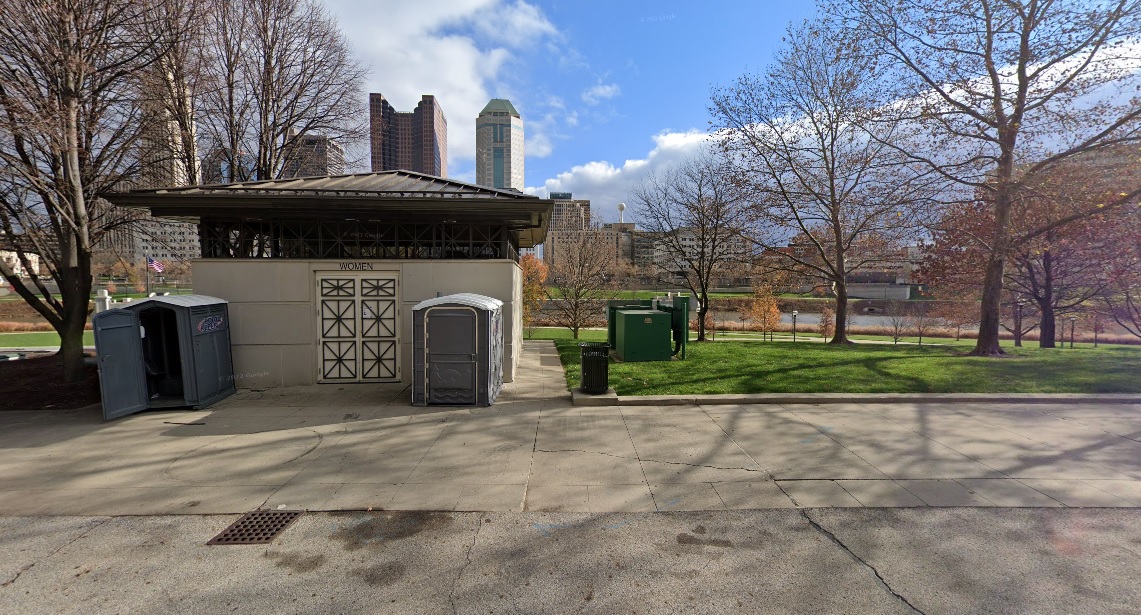
After: 2020 The riverfront looks much different today. With the Scioto Greenways and park space added in more recent years, the view is much more pleasant, the bathroom not included.
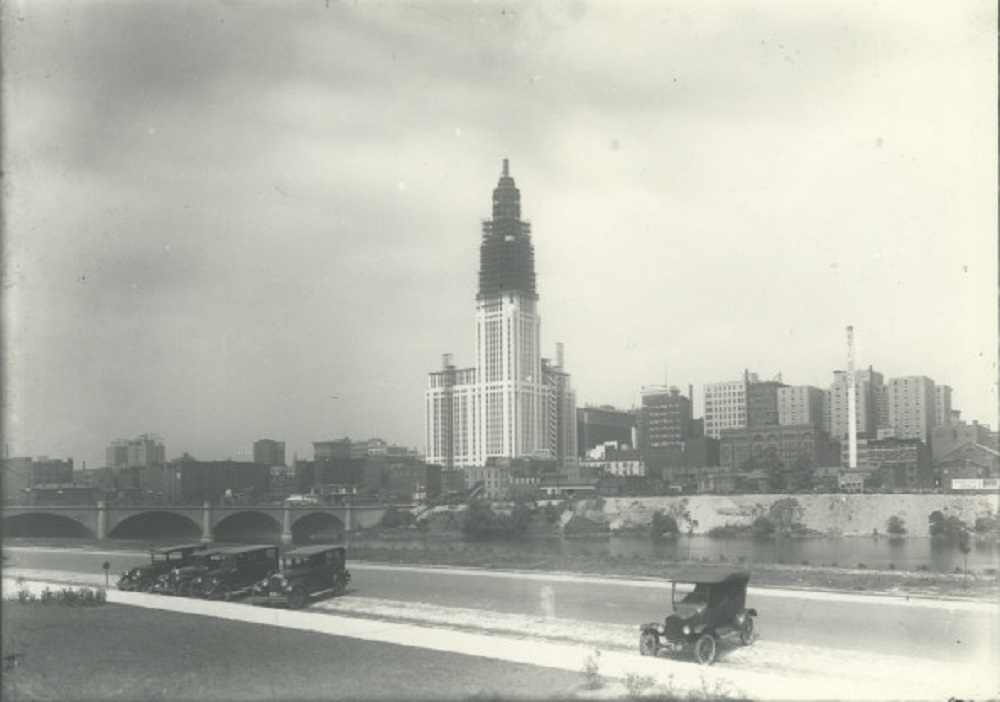
Before: 1926 In an image taken just 3 years after the one above, the Franklinton side of the riverfront looks much better. Additionally, LeVeque Tower is now well under construction. After: 2021 In the modern view, the parking and cars have been replaced with parklands and public space, while LeVeque has become the city’s most iconic skyline addition.
If you enjoy this series, the Historic Building Database page offers thousands of before and after photos of historic buildings and places in and around Columbus.
Next month, AllColumbusData.com will have its 10-year anniversary. Hard to believe! Here are some stats on just some of what the site now contains: -338 published posts. 10 additional are already complete and scheduled over the next few months. -105 specific content pages. -Well over 2,000 individual and before and after series historic photos. -143+ years of weather data for both Columbus and its suburbs. -200+ years of demographic and population data for Columbus and its suburbs. -Information and photos for hundreds of current and past development projects. -100+ videos.
What has been the most visited page, the most popular post over the years? Unfortunately, visitor data was lost prior to 2015 for various reasons. However, here have been the top 10 most popular posts and pages since 2015.
Top 10 Posts and the Year Published 1. Before and After How Columbus Changed in 10 Years 2021 This 2-part series was extremely popular last year, and easily became the most visited in the past 7 years. 2. Questions Answered- Columbus Zip Codes 2014 This post was very popular into 2018, but is now defunct. The information on this post ended up becoming bits and parts of other posts and pages. 3. Columbus Retail History- Shopping Centers 2013 One of the oldest posts on the site, it still gets consistent traffic almost a decade later. 4. Columbus Historic Church Demolition 2021 This one detailed plans to demolish an old church on the South Side. 5. Columbus Area Murders by Zip Code 2008-2015 2016 Pretty explanatory. This post provided crude maps of murders by zip code. 6. Columbus’ Greatest Snowstorm 2021 This post gave an account of the March 7-8, 2008 blizzard. 7. Columbus Area Zip Codes and Their Economies 2013 Still a consistent hit after a decade, this post gave details on economic information by local zip code. 8. Winter 2020-2021 Review 2021 Review the 2020-2021 winter with stats and rankings, something that has been done for all winters since 2014. 9. Franklin County Gentrification Trends 1990-2015 2017 This post looked at how income and race changes were driving neighborhood gentrification around Columbus. 10. How We Should Develop Around Intel 2022 The most recent on this list, this post deals with how the area around the Intel project should have a development plan, and detailed a hypothetical map of what that development could look like.
Top 10 Pages 1. Columbus Tornado History The most popular by far, this page covers historic tornadic events throughout the entire Columbus Metro Area. 2. Olde Towne East Historic Buildings This has been the most popular of all the Historic Building Database pages to date. 3. Proposed Development This regularly-updated development page highlights the region’s many proposed projects. 4. Other Residential Historic Buildings This page was one of the very first to be included in what would eventually become the Historic Building Database. It is defunct now, as its photos were eventually divided into a much greater expansion of featured neighborhoods. 5. Development Under Construction All the projects currently under construction at any given time. 6. Census Tract Maps Demographics, population and other data at the census tract level are provided in interactive maps going back to 1930. 7. Winter Storms This page chronicles significant winter weather events from the past. 8. Columbus Flood History As above, but dealing with flooding events. 9. Columbus Crime Statistics Violent and property crime data, maps and demographic data related to Columbus crime are provided going back about 40 years. 10. Completed Development Buildings and projects that were completed at some point in the past are highlighted on this page going back to the 19th Century.
Any surprises in what has been the most popular? Any posts or pages you’d like to see more of? Let me know here or on the Facebook page if you are enjoying the content or would like to see something different!
Ohio School Report Cards are a measure of school performance based on several different categories. This map breaks down Columbus City Schools Ohio Report Cards average scores, as well as several additional data points to help determine the best schools within the district. Red and yellow indicate the worst schools in terms of the scores, with green and blue being the best.
With the Omicron variant running rampant, Columbus schools are facing significant absences from both students and staff. Keep track of this data with this hand link, which ranks the best and worst schools for absences, shows how many cases are being reported, quarantine data and more.
The first part of this comparison of young professionals and the city, seen here, seemed to be well-received, so I wanted to expand the examination of the 25-34 age group. In the first post, I just compared growth of this population by Columbus’ peers, but let’s take a closer look at this group through educational attainment. I will use the same 33 cities I used in the first post.
Educational Attainment 2014 Rank by City of Bachelors Degree or Higher within 25-34 Population 1. Chicago: 268,470 2. Austin: 97,721 3. Columbus: 75,305 4. San Jose: 68,392 5. Charlotte: 63,132 6. San Antonio: 62,572 7. Portland: 60,259 8. Minneapolis: 51,043 9. Indianapolis: 48,188 10. Pittsburgh: 35,860 11. Kansas City: 32,101 12. Madison: 30,039 13. Milwaukee: 29,661 14. Omaha: 28,984 15. St. Louis: 28,946 16. Sacramento: 27,304 17. Cincinnati: 25,496 18. St. Paul: 22,929 19. Virginia Beach: 22,134 20. Orlando: 20,181 21. Wichita: 19,659 22. Las Vegas: 17,817 23. Lincoln: 16,429 24. Grand Rapids: 15,724 25. Detroit: 14,285 26. Fort Wayne: 12,228 27. Cleveland: 12,013 28. Des Moines: 10,089 29. Providence: 10,432 30. Toledo: 8,514 31. Akron: 6,600 32. Dayton: 4,029 33. Youngstown: 1,084
Columbus has the 3rd highest total of 25-34-year-olds with at least a bachelor’s degree, even compared to some cities with larger populations in the city or metro area. This is likely due to the high number of colleges and universities in the area, not least of which includes Ohio State.
2014 % of Total 25-34 Age Group with Bachelors or Higher 1. Madison: 67.0% 2. Pittsburgh: 57.4% 3. Minneapolis: 56.3% 4. Portland: 51.5% 5. Chicago: 51.1% 6. Austin: 48.9% 7. Cincinnati: 47.0% 8. St. Louis: 46.9% 9. Charlotte: 44.5% 10. San Jose: 44.5% 11. Columbus: 44.1% 12. St. Paul: 42.1% 13. Lincoln: 41.0% 14. Omaha: 40.8% 15. Grand Rapids: 40.5% 16. Kansas City: 40.5% 17. Orlando: 37.1% 18. Indianapolis: 34.3% 19. Wichita: 33.7% 20. Providence: 32.7% 21. Sacramento: 32.5% 22. Fort Wayne: 32.4% 23. Des Moines: 29.8% 24. Milwaukee: 29.6% 25. Virginia Beach: 29.3% 26. San Antonio: 27.6% 27. Akron: 23.4% 28. Cleveland: 21.4% 29. Las Vegas: 19.7% 30. Toledo: 19.5% 31. Dayton: 19.1% 32. Detroit: 15.9% 33. Youngstown: 12.8%
While just outside of the top 10 in the peer group, Columbus still performs in the top 1/3rd when it comes to the % of 25-34-year-olds that have at least a bachelor’s degree.
2000-2014 Total Change in Age 25-34 with a Bachelor’s Degree or Higher 1. Chicago: +78,514 2. Austin: +38,348 3. Portland: +26,042 4. San Antonio: +23,504 5. Columbus: +21,601 6. Charlotte: +19,149 7. Pittsburgh: +19,060 8. Minneapolis: +15,629 9. St. Louis: +14,538 10. San Jose: +13,372 11. Sacramento: +11,530 12. Kansas City: +10,499 13. Madison: +8,774 14. Orlando: +8,600 15. Omaha: +8,521 16. Indianapolis: +8,369 17. Milwaukee: +7,031 18. Grand Rapids: +6,275 19. Wichita: +6,049 20. Fort Wayne: +5,350 21. Cincinnati: +5,083 22. Las Vegas: +4,433 23. St. Paul: +4,316 24. Virginia Beach: +4,167 25. Lincoln: +3,450 26. Providence: +2,488 27. Des Moines: +806 28. Dayton: +59 29. Youngstown: -108 30. Cleveland: -522 31. Akron: -628 32. Detroit: -1,471 33. Toledo: -1,639
Another great showing is in the total growth of 25-34-year-olds with at least a bachelor’s degree. Again, Columbus is outperforming several larger cities/metros on the list.
2000-2014 Total % Change in Age 25-34 with a Bachelor’s Degree or Higher 1. Pittsburgh: +113.45% 2. St. Louis: +100.90% 3. Fort Wayne: +77.78% 4. Portland: +76.11% 5. Orlando: +74.26% 6. Sacramento: +73.09% 7. Grand Rapids: +66.41% 8. Austin: +64.59% 9. San Antonio: +60.16% 10. Kansas City: +48.60% 11. Wichita: +44.45% 12. Minneapolis: +44.13% 13. Charlotte: +43.54% 14. Omaha: +41.64% 15. Chicago: +41.33% 16. Madison: +41.26% 17. Columbus: +40.22% 18. Las Vegas: +33.12% 19. Providence: +31.32% 20. Milwaukee: +31.07% 21. Lincoln: +26.58% 22. Cincinnati: +24.90% 23. San Jose: +24.30% 24. St. Paul: +23.19% 25. Virginia Beach: +23.19% 26. Indianapolis: +21.02% 27. Des Moines: +8.68% 28. Dayton: +1.49% 29. Cleveland: -4.16% 30. Akron: -8.69% 31. Youngstown: -9.06% 32. Detroit: -9.34% 33. Toledo: -16.14%
So in Part 1, it was shown that Columbus had one of the fastest growing 25-34 populations. These numbers show that it also has one of the largest age 25-34 populations with a Bachelor’s degree or higher in terms of totals, and one of the fastest growing in terms of totals. By %, however, it performs a bit worse, but part of the reason for that is because so many of these cities started with relatively low educated populations to begin with. Overall, Columbus seems to be very attractive, not only to this age group, but also for those within the group that are highly educated.