Columbus Housing Market October 2013


Columbus Housing Market October 2013

The latest numbers for the Columbus housing market from Columbus Realtors.

LSD=Local school district
CSD=City school district

Top 15 Most Expensive Locations by Median Sales Price in October 2013
1. New Albany: $445,900
2. Upper Arlington CSD: $358,000
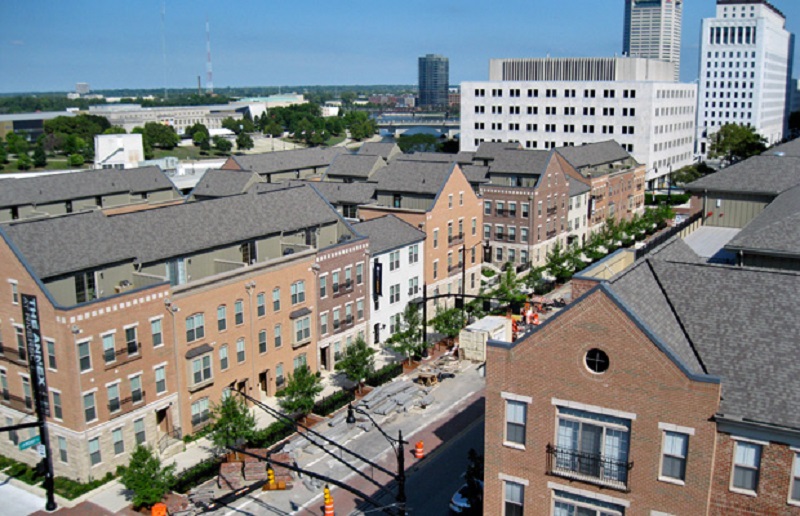
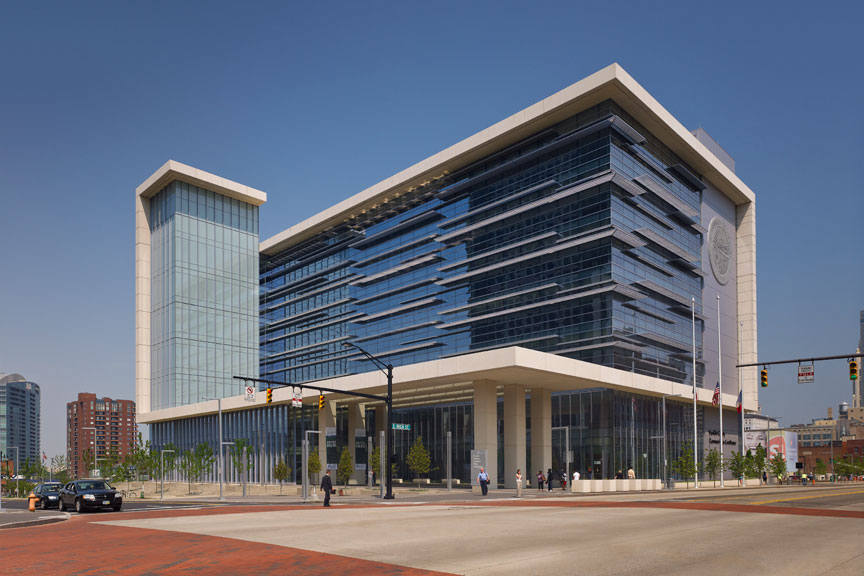
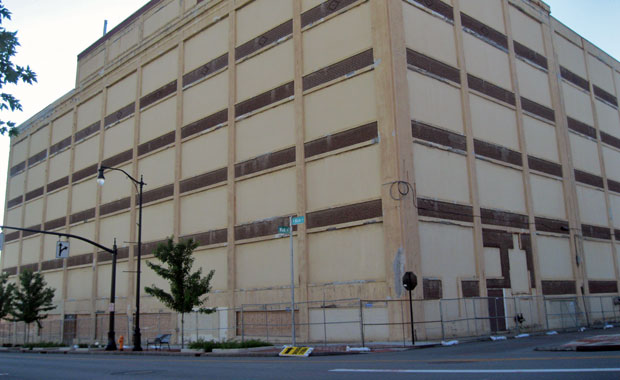
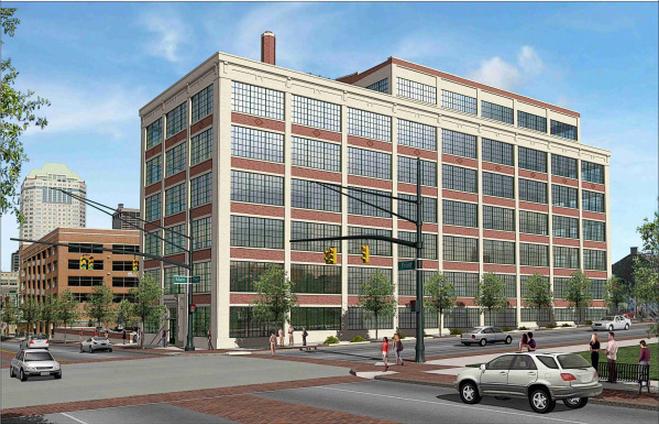
3. Downtown: $330,000
4. Powell: $305,000
5. Dublin: $302,125
6. Jefferson LSD: $292,500
7. Olentangy LSD: $288,500
8. Granville CSD: $272,000
9. New Albany Plain LSD: $262,500
10. Worthington: $249,900
11. Buckeye Valley LSD: $246,250
12. Big Walnut LSD: $238,500
13. Beechwold/Clintonville: $230,000
14. Bexley: $225,875
15. German Village: $217,500

Top 15 Least Expensive Locations by Median Sales Price in October 2013
1. Whitehall: $42,500
2. Lancaster CSD: $75,250
3. Hamilton LSD: $83,450
4. Columbus CSD: $84,200
5. Newark CSD: $87,450
6. Groveport Madison LSD: $90,150
7. London CSD: $94,500
8. South-Western CSD: $95,000
9. Columbus: $104,500
10. Circleville CSD: $110,250
11. Blacklick: $134,251
12. Obetz: $134,950
13. Canal Winchester CSD: $135,000
14. Grove City: $135,000
15. Reynoldsburg CSD: $136,200

Overall Metro Median Sales Price in October 2013: $149,302
Median Sales Price Change October 2012-October 2013: -$3,183

Top 15 Locations with the Highest Median Sales Price % Growth Between October 2012-October 2013
1. Hamilton LSD: +85.4%
2. Jefferson LSD: +69.8%
3. Downtown: +63.8%
4. Reynoldsburg CSD: +54.4%
5. Obetz: +51.8%
6. Jonathan Alder LSD: +50.4%
7. Sunbury: +36.5%
8. Beechwold/Clintonville: +28.6%
9. Westerville CSD: +20.2%
10. Minerva Park: +19.4%
11. Marysville CSD: +19.4%
12. Lithopolis: +19.0%
13. Northridge LSD: +17.4%
14. Circleville CSD: +16.7%
15. Granville CSD: +15.6%

Top 15 Locations with the Lowest Median Sales Price % Growth Between October 2012-October 2013
1. German Village: -16.3%
2. Lancaster CSD: -16.3%
4. Buckeye Valley LSD: -14.9%
5. New Albany Plain LSD: -14.6%
6. Canal Winchester CSD: -14.6%
7. Grandview Heights: -14.2%
8. Hilliard: -12.8%
9. South-Western CSD: -11.4%
10. London CSD: -11.3%
11. Dublin CSD: -10.8%
12. Dublin: -10.3%
13. Whitehall: -7.6%
14. Gahanna Jefferson CSD: -5.6%
15. Johnstown Monroe LSD: -3.7%

Overall Metro Median Price % Change October 2012-October 2013: -2.1%

Top 10 Locations with the Most New Listings in October 2013
1. Columbus: 1,107
2. Columbus CSD: 691
3. Westerville CSD: 177
4. South-Western CSD: 169
5. Hilliard CSD: 158
6. Olentangy LSD: 157
7. Dublin CSD: 123
8. Groveport Madison LSD: 91
9. Worthington CSD: 79
10. Dublin: 73

Top 10 Locations with the Fewest New Listings in October 2013
1. Valleyview: 0
2. Lithopolis: 0
3. Minerva Park: 2
4. Jefferson LSD: 5
5. Obetz: 5
6. Sunbury: 5
7. Northridge LSD: 9
8. Jonathan Alder LSD: 9
9. German Village: 9
10. Grandview Heights: 10

Overall Metro New Listings in October 2013: 2,693
New Listings % Change October 2012-October 2013: +5.9%

Top 10 Fastest-Selling Locations by # of Days Homes Remain on the Market Before Sale in October 2013
1. Johnstown Monroe LSD: 30
2. Powell: 31
3. Buckeye Valley LSD: 32
4. Grandview Heights: 39
5. Minerva Park: 42
6. Beechwold/Clintonville: 45
7. Northridge LSD: 45
8. Olentangy LSD: 46
9. Westerville: 46
10. Jonathan Alder LSD: 47

Top 10 Slowest-Selling Locations by # of Days Homes Remain on the Market Before Sale in March 2013
1. Circleville CSD: 118
2. London CSD: 107
3. Lancaster CSD: 106
4. Obetz: 105
5. Hamilton LSD: 96
6. New Albany CSD: 91
7. Granville CSD: 84
8. Jefferson LSD: 82
9. Big Walnut LSD: 81
10. Hilliard: 78
11. Reynoldsburg: CSD: 78

Overall Metro Average # of Days on Market Before Sale: 74.7

Top 10 Locations with the Best Change in # of Days on the Market Before Sale October 2012-October 2013
1. Lithopolis: +522.2%
2. Minerva Park: -77.25
3. Johnstown Monroe LSD: -74.6%
4. Buckeye Valley LSD: -71.7%
5. Jonathan Alder LSD: -69.1%
6. Grandview Heights: -64.2%
7. Powell: -62.7%
8. German Village: -61.2%
9. Northridge LSD: -54.5%
10. Pickerington LSD: -47.0%

Top 10 Locations with the Worst Change in the # of Days on the Market Before Sale October 2012-October 2013
1. Hamilton LSD: +190.9%
2. Obetz: +150.0%
3. Lancaster CSD: +86.0%
4. Sunbury: +50.0%
5. Circleville CSD: +45.7%
6. London CSD: +27.4%
7. New Albany: +14.6%
8. Worthington: +13.7%
9. Granville CSD: +9.1%
10. New Albany CSD: +8.3%

Overall Metro # of Days on Market Before Sale % Change October 2012-October 2013: -24.9%


Columbus Housing Market September 2013


Columbus housing market September 2013

According to Columbus Realtors, September continued one of the Columbus area’s longest positive streaks when it came to housing sales, although sales were down a bit from earlier this year. Overall, sales were up 13.1% and prices were up 4.2%.

For the housing report, I look at the 21 major areas of the Franklin County area (11 urban, 10 suburban). Here is what the September market looked like.

Top 10 September Sales Totals
1. Columbus: 820
2. Dublin: 72
3. Westerville: 59
4. Upper Arlington: 53
5. Grove City: 49
6. Hilliard: 49
7. Clintonville: 47
8. Gahanna: 45
9. Reynoldsburg: 34
10. Canal Winchester: 29

Top 10 September Sales Increases Over September 2012
1. Whitehall: +142.9%
2. Westerville: +96.7%
3. Obetz: +66.7%
4. Canal Winchester: +38.1%
5. Reynoldsburg: +36.0%
6. Pataskala: +35.7%
7. Grove City: +32.4%
8. Gahanna: +28.6%
9. New Albany: +28.6%
10. Minerva Park: +25.0%

Top 10 Total YTD Sales Through September
1. Columbus: 8,019
2. Dublin: 636
3. Upper Arlington: 588
4. Clintonville: 554
5. Westerville: 495
6. Grove City: 487
7. Hilliard: 460
8. Gahanna: 414
9. Reynoldsburg: 381
10. Pickerington: 254

Top 10 YTD Sales Increases Through over September 2012
1. Minerva Park: +47.6%
2. Whitehall: +45.9%
3. Hilliard: +36.1%
4. Pataskala: +33.1%
5. Westerville: +33.1%
6. Bexley: +32.4%
7. Gahanna: +31.8%
8. Reynoldsburg: +31.8%
9. Clintonville: +28.5%
10. German Village: +27.6%

Average Sales September 2013
Urban: 91.6
Suburban: 39.2
Urban without Columbus: 18.8

Average % Change September 2013 vs. September 2012
Urban: +10.6%
Suburban: +30.3%
Urban without Columbus: +10.5%

Average Sales YTD Through September
Urban: 923.2
Suburban: 370.1
Urban without Columbus: 213.6

Average % Change YTD vs. YTD 2012 (Through September)
Urban: +19.2
Suburban: +24.7%
Urban without Columbus: +18.5%

Top 10 Average Sales Price September 2013
1. New Albany: $512,564
2. Upper Arlington: $402,771
3. Dublin: $359,925
4. Bexley: $293,331
5. Downtown: $259,331
6. Grandview Heights: $244,433
7. German Village: $235,557
8. Worthington: $234,716
9. Hilliard: $220,823
10. Clintonville: $206,610

Top 10 Average Sales Price % Increases vs. September 2012
1. Whitehall: +99.3%
2. Obetz: +98.1%
3. Minerva Park: +51.3%
4. Upper Arlington: +20.6%
5. New Albany: +20.2%
6. Gahanna: +18.5%
7. Dublin: +13.5%
8. Hilliard: +10.5%
9. Pickerington: +10.2%
10. Reynoldsburg: +9.4%

Top 10 Average Sales Price YTD
1. New Albany: $543,445
2. Upper Arlington: $364,187
3. Bexley: $347,444
4. Dublin: $333,741
5. German Village: $302,753
6. Downtown: $281,729
7. Worthington: $246,663
8. Grandview Heights: $222,115
9. Hilliard: $219,302
10. Gahanna: $201,444

Top 10 Average YTD Sales Price % Change vs. YTD 2012
1. Whitehall: +23.2%
2. Minerva Park: +18.2%
3. Downtown: +13.5%
4. Upper Arlington: +13.3%
5. Gahanna: +12.9%
6. Reynoldsburg: +9.6%
7. New Albany: +9.4%
8. Canal Winchester: +6.6%
9. Bexley: +6.0%
10. Worthington: +5.7%

Average Price September 2013
Urban: $210,653
Suburban: $222,473
Urban without Columbus: $219,161

Average Price % Change vs. September 2012
Urban: +23.7%
Suburban: +7.7%
Urban without Columbus: +25.9%

Average Price YTD
Urban: $215,336
Suburban: $223,809
Urban without Columbus: $224,046

Average Price % Change YTD vs. YTD 2012
Urban: +6.2%
Suburban: +5.2%
Urban without Columbus: +6.4%

Top 10 Fastest Selling Markets September (based on # of Days listings sell)
1. Worthington: 26
2. Minerva Park: 29
3. Clintonville: 34
4. Obetz: 34
5. Upper Arlington: 34
6. Hilliard: 41
7. Westerville: 42
8. New Albany: 44
9. Pickerington: 45
10. Whitehall: 45

Top 10 Fastest Selling Markets YTD
1. Worthington: 37
2. Upper Arlington: 45
3. Grandview Heights: 48
4. Clintonville: 52
5. Hilliard: 53
6. Westerville: 53
7. Bexley: 58
8. Gahanna: 58
9. Dublin: 61
10. Grove City: 61

Average # of Days before Sale, September 2013
Urban: 48.0
Suburban: 51.8
Urban without Columbus: 47.1

Average # of Days before Sale, YTD
Urban: 60.7
Suburban: 61.1
Urban without Columbus: 60.3

Top 10 Lowest Housing Supplies (based on # of months to sell all listings), September 2013
1. Worthington: 1.9
2. Upper Arlington: 2.3
3. Bexley: 2.4
4. Hilliard: 2.6
5. Westerville: 2.6
6. Clintonville: 2.7
7. Grandview Heights: 2.9
8. Gahanna: 3.2
9. Dublin: 3.4
10. Whitehall: 3.7

Average # of Months to Sell All Listings
Urban: 3.5
Suburban: 4.1
Urban without Columbus: 3.4

Average % Change of Single-Family Home Sales, September 2013 vs. September 2012
Urban: +23.7%
Suburban: +31.0%
Urban without Columbus: +24.7%

Average % Change of Condo Sales, September 2013 vs. September 2012
Urban: -23.5%
Suburban: +48.4%
Urban without Columbus: -25.3%

Average % Change of Single-Family Home Sales YTD vs. YTD 2012
Urban: +13.0%
Suburban: +24.7%
Urban without Columbus: +11.7%

Average % Change of Condo Sales YTD vs. YTD 2012
Urban: +35.8%
Suburban: +26.2%
Urban without Columbus: +36.7%


Historic Midwest Population and Density Ranking


Historic Midwest population and density ranking

I’ve compared Columbus to peer cities nationally in terms of density and population, but I’ve never compared Columbus to the Midwest as a whole historically for those categories. For the following historic Midwest population and density ranking, I used the top 15 largest Midwest cities as of 2012 as determined by the US Census.

Red indicates a fallen ranking while blue indicates a rise. Black is no change.

Historic Population Rankings
1840

1. Cincinnati: 46,338
2. St. Louis: 16,469
3. Detroit: 9,102
4. Cleveland: 6,071
5. Columbus: 6,048
6. Chicago: 4,470
7. Indianapolis: 2,695
8. Milwaukee: 1,700
9. Toledo: 1,222
10. Kansas City: Not incorporated.
11. Lincoln: Not incorporated.
12. Minneapolis: Not incorporated.
13. Omaha: Not incorporated.
14. St. Paul: Not incorporated.
15. Wichita: Not incorporated.

1850
1. Cincinnati: 115,435
2. St. Louis: 77,860
3. Chicago: 29,963
4. Detroit: 21,019
5. Milwaukee: 20,061
6. Columbus: 17,882
7. Cleveland: 17,034
8. Indianapolis: 8,091
9. Toledo: 3,829
10. St. Paul: 1,112
11. Kansas City: Not incorporated.
12. Lincoln: Not incorporated.
13. Minneapolis: Not incorporated.
14. Omaha: Not incorporated.
15. Wichita: Not incorporated.

1860
1. Cincinnati: 161,044
2. St. Louis: 160,773
3. Chicago: 112,172
4. Detroit: 45,619
5. Milwaukee: 45,246
6. Cleveland: 43,417
7. Indianapolis: 18,611
8. Columbus: 18,554
9. Toledo: 13,768
10. St. Paul: 10,401
11. Minneapolis: 5,809
12. Kansas City: 4,418
13. Omaha: 1,883
14. Lincoln: Not incorporated.
15. Wichita: Not incorporated.

1870
1. St. Louis: 310,864
2. Chicago: 298,977
3. Cincinnati: 216,239
4. Cleveland: 92,829
5. Detroit: 79,577
6. Milwaukee: 71,440
7. Indianapolis: 48,244
8. Kansas City: 32,260
9. Toledo: 31,584
10. Columbus: 31,274
11. St. Paul: 20,030
12. Omaha: 16,083
13. Minneapolis: 13,066
14. Lincoln: 2,441
15. Wichita: 689

1880
1. Chicago: 503,185
2. St. Louis: 350,518
3. Cincinnati: 255,139
4. Cleveland: 160,146
5. Detroit: 116,340
6. Milwaukee: 115,587
7. Indianapolis: 75,056
8. Kansas City: 55,785
9. Columbus: 51,647
10. Toledo: 50,137
11. Minneapolis: 46,887
12. St. Paul: 41,473
13. Omaha: 30,518
14. Lincoln: 13,003
15. Wichita: 4,911

1890
1. Chicago: 1,099,850
2. St. Louis: 451,770
3. Cincinnati: 296,908
4. Cleveland: 261,353
5. Detroit: 205,877
6. Milwaukee: 204,468
7. Minneapolis: 164,738
8. Omaha: 140,452
9. St. Paul: 133,156
10. Kansas City: 132,716
11. Indianapolis: 105,436
12. Columbus: 88,150
13. Toledo: 81,434
14. Lincoln: 55,164
15. Wichita: 23,853

1900
1. Chicago: 1,698,575
2. St. Louis: 575,238
3. Cleveland: 381,768
4. Cincinnati: 325,902
5. Detroit: 285,704
6. Milwaukee: 285,315
7. Minneapolis: 202,718
8. Indianapolis: 169,164
9. Kansas City: 163,752
10. St. Paul: 163,065
11. Toledo: 131,822
12. Columbus: 125,560
13. Omaha: 102,555
14. Lincoln: 40,169
15. Wichita: 24,671

1910
1. Chicago: 2,185,283
2. St. Louis: 687,029
3. Cleveland: 560,663
4. Detroit: 465,766
5. Milwaukee: 373,857
6. Cincinnati: 363,591
7. Minneapolis: 301,408
8. Kansas City: 248,381
9. Indianapolis: 233,650
10. St. Paul: 214,744
11. Columbus: 181,511
12. Toledo: 168,497
13. Omaha: 124,096
14. Wichita: 52,450
15. Lincoln: 43,973

1920
1. Chicago: 2,701,705
2. Detroit: 993,678
3. Cleveland: 796,841
4. St. Louis: 772,897
5. Milwaukee: 457,147
6. Cincinnati: 401,247
7. Minneapolis: 380,582
8. Kansas City: 324,410
9. Indianapolis: 314,194
10. Toledo: 243,164
11. Columbus: 237,031
12. St. Paul: 234,698
13. Omaha: 191,061
14. Wichita: 72,217
15. Lincoln: 54,948

1930
1. Chicago: 3,376,438
2. Detroit: 1,568,662
3. Cleveland: 900,429
4. St. Louis: 821,960
5. Milwaukee: 578,249
6. Minneapolis: 464,356
7. Cincinnati: 451,160
8. Kansas City: 399,746
9. Indianapolis: 364,161
10. Toledo: 290,718
11. Columbus: 290,564
12. St. Paul: 271,606
13. Omaha: 214,006
14. Wichita: 111,110
15. Lincoln: 75,933

1940
1. Chicago: 3,396,808
2. Detroit: 1,623,452
3. Cleveland: 878,336
4. St. Louis: 816,048
5. Milwaukee: 587,472
6. Minneapolis: 492,370
7. Cincinnati: 455,610
8. Kansas City: 400,178
9. Indianapolis: 386,972
10. Columbus: 306,087
11. St. Paul: 287,736
12. Toledo: 282,349
13. Omaha: 223,844
14. Wichita: 114,966
15. Lincoln: 81,984

1950
1. Chicago: 3,620,962
2. Detroit: 1,849,568
3. Cleveland: 914,808
4. St. Louis: 856,796
5. Milwaukee: 637,392
6. Minneapolis: 521,718
7. Cincinnati: 503,998
8. Kansas City: 456,622
9. Indianapolis: 427,173
10. Columbus: 375,901
11. St. Paul: 311,349
12. Toledo: 303,616
13. Omaha: 251,117
14. Wichita: 168,279
15. Lincoln: 98,884

1960
1. Chicago: 3,550,404
2. Detroit: 1,670,144
3. Cleveland: 876,050
4. St. Louis: 750,026
5. Milwaukee: 741,324
6. Cincinnati: 502,550
7. Minneapolis: 482,872
8. Indianapolis: 476,258
9. Kansas City: 475,539
10. Columbus: 471,316
11. Toledo: 318,003
12. St. Paul: 313,411
13. Omaha: 301,598
14. Wichita: 254,698
15. Lincoln: 128,521

1970
1. Chicago: 3,366,957
2. Detroit: 1,514,063
3. Cleveland: 750,903
4. Indianapolis: 744,624
5. Milwaukee: 717,099
6. St. Louis: 622,236
7. Columbus: 539,677
8. Kansas City: 507,087
9. Cincinnati: 452,525
10. Minneapolis: 434,400
11. Toledo: 383,818
12. Omaha: 346,929
13. St. Paul: 309,980
14. Wichita: 276,554
15. Lincoln: 149,518

1980
1. Chicago: 3,005,072
2. Detroit: 1,203,368
3. Indianapolis: 700,807
4. Milwaukee: 636,212
5. Cleveland: 573,822
6. Columbus: 564,871
7. St. Louis: 452,801
8. Kansas City: 448,159
9. Cincinnati: 385,460
10. Minneapolis: 370,951
11. Toledo: 354,635
12. Omaha: 313,939
13. Wichita: 279,272
14. St. Paul: 270,230
15. Lincoln: 171,932

1990
1. Chicago: 2,783,726
2. Detroit: 1,027,974
3. Indianapolis: 731,327
4. Columbus: 632,910
5. Milwaukee: 628,088
6. Cleveland: 505,616
7. Kansas City: 435,146
8. St. Louis: 396,685
9. Minneapolis: 368,383
10. Cincinnati: 364,040
11. Omaha: 335,795
12. Toledo: 332,943
13. Wichita: 304,011
14. St. Paul: 272,235
15. Lincoln: 191,972

2000
1. Chicago: 2,896,016
2. Detroit: 951,270
3. Indianapolis: 781,926
4. Columbus: 711,470
5. Milwaukee: 596,974
6. Cleveland: 478,403
7. Kansas City: 441,545
8. Omaha: 390,007
9. Minneapolis: 382,618
10. St. Louis: 348,189
11. Wichita: 344,284
12. Cincinnati: 331,285
13. Toledo: 313,619
14. St. Paul: 287,151
15. Lincoln: 225,581

2010
1. Chicago: 2,695,598
2. Indianapolis: 829,445
3. Columbus: 787,033
4. Detroit: 713,777
5. Milwaukee: 594,833
6. Kansas City: 459,787
7. Omaha: 408,958
8. Cleveland: 396,815
9. Minneapolis: 382,578
10. Wichita: 382,368
11. St. Louis: 319,294
12. Cincinnati: 296,945
13. Toledo: 287,208
14. St. Paul: 285,068
15. Lincoln: 258,379

2012
1. Chicago: 2,714,856
2. Indianapolis: 834,852
3. Columbus: 809,798
4. Detroit: 701,475
5. Milwaukee: 598,916
6. Kansas City: 464,310
7. Omaha: 421,570
8. Minneapolis: 392,880
9. Cleveland: 390,928
10. Wichita: 385,577
11. St. Louis: 318,172
12. Cincinnati: 296,727
13. St. Paul: 290,770
14. Toledo: 284,012
15. Lincoln: 265,404

2020 Projection based on 2012 growth rates.
1. Chicago: 2,789,944
2. Indianapolis: 893,465
3. Columbus: 892,495
4. Detroit: 665,954
5. Milwaukee: 607,919
6. Kansas City: 482,776
7. Omaha: 460,487
8. Minneapolis: 428,487
9. Wichita: 401,104
10. Cleveland: 373,336
11. St. Louis: 315,462
12. St. Paul: 305,878
13. Cincinnati: 302,288
14. Lincoln: 289,901
15. Toledo: 271,124

Columbus seems poised to take the #2 spot from Indianapolis around or just after 2020. Also, 11 of 15 would’ve seen growth 2010-2020. Cleveland, Toledo, St. Louis and Detroit would be the only cities that still lost.

2012 Density
1. Chicago: 11,949.2
2. Minneapolis: 7,156.3
3. Milwaukee: 6,230.9
4. St. Paul: 5,593.9
5. St. Louis: 5,140.1
6. Detroit: 5,055.7
7. Cleveland: 5,031.2
8. Cincinnati: 3,807.1
9. Columbus: 3,728.4
10. Toledo: 3,519.8
11. Omaha: 3,317.1
12. Lincoln: 2,978.4
13. Wichita: 2,420.6
14. Indianapolis: 2,286.6
15. Kansas City: 1,474.2

2020 Projected density using 2012 growth rates
1. Chicago: 12,279.7
2. Minneapolis: 7,804.9
3. Milwaukee: 6,324.6
4. St. Paul: 5,884.5
5. St. Louis: 5,096.3
6. Cleveland: 4,804.8
7. Detroit: 4,799.7
8. Columbus: 4,109.7
9. Cincinnati: 3,878.5
10. Omaha: 3,623.3
11. Toledo: 3,360.1
12. Lincoln: 3,253.3
13. Wichita: 2,518.1
14. Indianapolis: 2,447.2
15. Kansas City: 1,532.9


Rise of RiverSouth


The RiverSouth area of Downtown was, not that long ago, the epitome of the disastrous Urban Renewal policy so popular during much of the mid-latter part of the 20th century. Bounded to the east by High Street, north by State Street, west by the Scioto River and south by I-70, this area, by the mid-1990s, had become a sea of surface parking lots, old storage warehouses, underutilized or empty storefronts and ugly infrastructure. The construction of City Center Mall in 1989, with its location directly across High Street, was supposed to help bring this neighborhood back with new development. Instead, as the mall did with the rest of Downtown, it helped suck the life out what retail and business existed there. Worse, the concrete, prison-like exterior of the mall lacked any type of street-level connection, so it functioned to keep people off the sidewalks and the streets were as abandoned as ever even as thousands of shoppers flooded the new mall every weekend.

Rise of RiverSouth Columbus, Ohio

The imposing structure of City Center.


As newer suburban competition gradually killed City Center itself, the city was left with the task of figuring out what to do with its hulking core. Proposals were put for from everything to government buildings to redesigning the building itself into an Easton-like outdoor shopping town center. However, the money and interest for such proposals just weren’t there, and so the city came up with another, much different plan. The 10-15 year development plan called for the complete demolition of the mall complex, replacing it with a new city park complete with an entertainment stage, carousel and eateries.

City Center being demolished in 2010.


The mall was closed in 2009 and demolished the following year. This event seems to have marked the true beginning of the rise of RiverSouth. Columbus Commons and its 9 acres opened to the public in 2011. Despite a hugely negative expectation by some that the park would see little use and become a new place for vagrants and criminals, CC was an almost instant success. Hundreds of events were held there during its first year, and those numbers have grown every year since. Picnic with the Pops moved to the new park during the 2012 season, and the Columbus Food Truck Festival has attracted tens of thousands each of the last 2 years. The carousel, outdoor library and other events have been popular with kids and families. The park, with all its success, helped to bring about another important change to the area. It attracted development.

Columbus Commons before any development.


Originally, the park’s long-term plan was to have the grassy areas along High Street developed, but no one expected that to happen within a decade. Instead, a developer came forward less than a year after the park opened. High Point was that project, a pair of 6-story mixed-used buildings that would line the entire west side of the park from the corner of Rich and High. 302 new apartments, a handful of restaurants and ground floor retail lining High were all part of the project. Still under construction, this project should be complete in early 2014. Unfortunately, as the below pictures show (and the most flattering ones I could find at that) that the architecture is pretty horrendous. Despite that, the buildings will help fill in the gaps on High Street and bring hundreds of new residents, so the positives outweigh the negatives here.

Since the announcement of City Center’s demise, other projects have come about over the last few years that have helped raise the profile of RiverSouth.
-The Annex at RiverSouth replaced several surface parking lots along S. Front Street. This 214-unit, 4-story residential complex was originally planned to be a mix of condos and apartments, but became mostly apartments when the condo market died off. The complex was completed in 2010.

-The new Franklin County Courthouse, a $106 million, 7-story complex was completed in 2011 at the southwest corner of W. Main and S. High Streets.

-The Scioto Mile, the $44 million riverfront park, was completed in 2011 complete with fountains, a restaurant, paths and an entertainment stage.

Scioto Mile

-Main Street Bridge was replaced with a signature, $60 million arched span in 2011.

-The Rich Street Bridge was also replaced in 2012 with a new $26 million open span.

-The old Lazarus building, once connected to City Center by a massive skywalk, received a $60 million renovation in 2010 that converted the former retail building into an LEED green office building for the Ohio EPA and other organizations.

-Many of the streets in the area have been rebuilt with brick crossing and new landscaping.

So a lot has been done over the past few years, but what’s coming next? Beyond the High Point project, 3 more projects have recently been announced.

-The first is the conversion of the Secur-It warehouse building at the northeast corner of S. Front and W. Main Street. The century-old building was once used as a shoe factory, but was bricked over and used as a storage facility for many years. The current plan by Casto is to turn the building into about 90 residential units. The old warehouse windows will be restored, as well as the façade and interiors. The project should get started in the spring of 2014.

The current Secure-It building.


Proposed rendering for the Secure-It building.

-Second, we have Lifestyle Communities LC at RiverSouth project. This 8-story, 102-unit residential building will occupy the northwest corner of S. High and W. Rich Streets, directly across from Columbus Commons. Construction should begin this fall and complete in early 2015.

-And finally, we have the recently announced 250 High project. This $50 million, 12-story mixed-use tower would have ground floor retail, 4 floors of offices and 7 floors of residential totaling 156 units. This project will be built on the surface lot adjacent to the old City Center parking garage at 250 S. High Street. Construction on this project should also begin in the fall and complete sometime in early 2015.

These projects will no doubt spur others in the near future. Several surface lots still exist in RiverSouth, and a few of them are still along S. High Street just north of the new courthouse. Given the momentum of the neighborhood, expect to see development announcements on at least a few of these lots sooner than you think.


Columbus Housing Market August 2013


Columbus housing market August 2013

The Columbus housing market August 2013 data from Columbus Realtors shows that the area continued hot, with record August sales and potentially a record year still in the making. For the region, sales were up 11% for August and are were up almost 23% for the first 8 months of the year.

I looked at the 21 major areas of Franklin County (11 urban, 10 suburban). Here is what the August market looked like.

Top 10 August Sales Totals
1. Columbus: 1,027
2. Upper Arlington: 82
3. Dublin: 78
4. Clintonville: 75
5. Grove City: 72
6. Hilliard: 66
7. Westerville: 61
8. Gahanna: 52
9. Worthington: 37
10. Reynoldsburg: 35

Top 10 August Sales Increases Over August 2012
1. Minerva Park: +400.0%
2. Downtown: +66.7%
3. Gahanna: +48.6%
4. Upper Arlington: +34.4%
5. German Village: +25.0%
6. Clintonville: +21.0%
7. Grove City: +20.0%
8. Westerville: +15.1%
9. Columbus: +12.6%
10. Whitehall: +12.5%

Top 10 Total YTD Sales Through August
1. Columbus: 7,149
2. Dublin: 561
3. Upper Arlington: 533
4. Clintonville: 505
5. Grove City: 437
6. Westerville: 436
7. Hilliard: 409
8. Gahanna: 369
9. Reynoldsburg: 346
10. Pickerington: 236

Top 10 YTD Sales Increases Through over August 2012
1. Minerva Park: +52.9%
2. Whitehall: +37.4%
3. Hilliard: +37.2%
4. German Village: +34.5%
5. Bexley: +33.3%
6. Gahanna: +32.3%
7. Downtown: +31.7%
8. Clintonville: +31.2%
9. Pataskala: +31.1%
10. Reynoldsburg: +31.1%

Average Sales August 2013
Urban: 121.3
Suburban: 44.9
Urban without Columbus: 30.7

Average % Change August 2013 vs. August 2012
Urban: +49.5%
Suburban: -0.3%
Urban without Columbus: +53.2%

Average Sales YTD Through July
Urban: 826.2
Suburban: 330.0
Urban without Columbus: 193.9

Average % Change YTD vs. YTD 2012 (Through August)
Urban: +21.2%
Suburban: +24.0%
Urban without Columbus: +20.6%

Top 10 Average Sales Price August 2013
1. New Albany: $563,743
2. Upper Arlington: $391,739
3. Bexley: $379,746
4. Dublin: $316,481
5. Downtown: $280,630
6. German Village: $280,037
7. Worthington: $263,934
8. Grandview Heights: $240,743
9. Hilliard: $225,476
10. Canal Winchester: $197,671

Top 10 Average Sales Price % Increases vs. August 2012
1. Canal Winchester: +32.8%
2. Bexley: +27.4%
3. Pataskala: +19.0%
4. Worthington: +18.0%
5. Upper Arlington: +14.4%
6. Reynoldsburg: +11.1%
7. Columbus: +10.4%
8. New Albany: +8.8%
9. Gahanna: +5.4%
10. Hilliard: +3.5%

Top 10 Average Sales Price YTD
1. New Albany: $546,941
2. Upper Arlington: $360,574
3. Bexley: $352,910
4. Dublin: $330,887
5. German Village: $306,121
6. Downtown: $283,942
7. Worthington: $247,084
8. Grandview Heights: $222,795
9. Hilliard: $219,123
10. Gahanna: $200,988

Top 10 Average YTD Sales Price % Change vs. YTD 2012
1. Whitehall: +16.7%
2. Downtown: +15.5%
3. Upper Arlington: +12.6%
4. Gahanna: +12.3%
5. Minerva Park: +12.2%
6. Reynoldsburg: +9.6%
7. New Albany: +8.7%
8. Canal Winchester: +7.3%
9. Bexley: +6.2%
10. Worthington: +5.1%

Average Price August 2013
Urban: $223,076
Suburban: $230,864
Urban without Columbus: $231,445

Average Price % Change vs. August 2012
Urban: +1.4%
Suburban: +6.9%
Urban without Columbus: +0.5%

Average Price YTD
Urban: $215,558
Suburban: $224,012
Urban without Columbus: $224,254

Average Price % Change YTD vs. YTD 2012
Urban: +4.9%
Suburban: +4.9%
Urban without Columbus: +4.9%

Top 10 Fastest Selling Markets August 2013 (based on # of Days listings sell)
1. Gahanna: 32
2. Obetz: 32
3. Whitehall: 36
4. Bexley: 37
5. Upper Arlington: 37
6. Clintonville: 41
7. Worthington: 41
8. Grandview Heights: 42
9. Hilliard: 43
10. Westerville: 48

Top 10 Fastest Selling Markets YTD
1. Worthington: 38
2. Upper Arlington: 45
3. Grandview Heights: 46
4. Clintonville: 54
5. Hilliard: 55
6. Westerville: 55
7. Gahanna: 58
8. Bexley: 59
9. Dublin: 60
10. Grove City: 63

Average # of Days before Sale, August 2013
Urban: 49.4
Suburban: 66.8
Urban without Columbus: 48.6

Average # of Days before Sale, YTD
Urban: 62.7
Suburban: 62.4
Urban without Columbus: 62.4

Top 10 Lowest Housing Supplies (based on # of months to sell all listings), August 2013
1. Worthington: 2.1
2. Bexley: 2.3
3. Clintonville: 2.5
4. Grandview Heights: 2.5
5. Hilliard: 2.5
6. Westerville: 2.7
7. Upper Arlington: 2.8
8. Gahanna: 3.1
9. Dublin: 3.3
10. Pickerington: 3.9

Average # of Months to Sell All Listings
Urban: 3.6
Suburban: 4.1
Urban without Columbus: 3.5

Average % Change of Single-Family Home Sales, August 2013 vs. August 2012
Urban: +32.0%
Suburban: -1.8%
Urban without Columbus: +34.0%

Average % Change of Condo Sales, August 2013 vs. August 2012
Urban: +65.5%
Suburban: +51.0%
Urban without Columbus: +70.3%

Average % Change of Single-Family Home Sales YTD vs. YTD 2012
Urban: +12.9%
Suburban: +23.8%
Urban without Columbus: +11.5%

Average % Change of Condo Sales YTD vs. YTD 2012
Urban: +44.3%
Suburban: +29.5%
Urban without Columbus: +45.8%