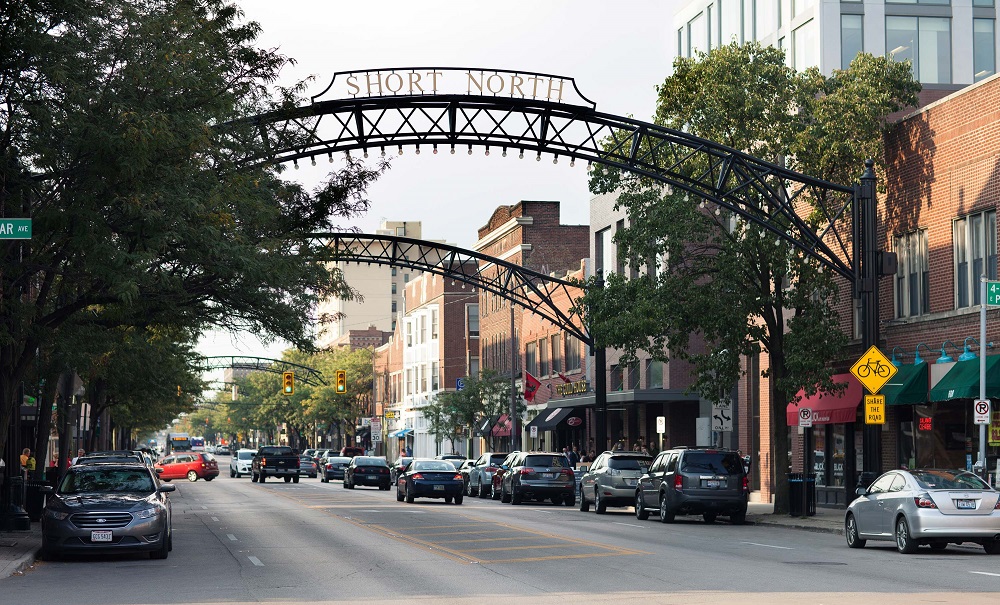
There’s been a lot of media attention to recent shootings in the Short North this year. It’s supposedly gotten so bad, that Mayor Ginther has asked local businesses in the neighborhood to close by Midnight. But has the violence really spiraled out of control, especially compared to other areas in the city. Is the Short North dangerous now? Or is the area just getting more attention due to its status as a hot neighborhood popular with locals and tourists alike?
First, let’s take a look at homicides and homicide rates across Franklin County by Census Tract. The numbers are through May 17th and the rates are total homicides divided by the 100K people per tract.
The first thing that sticks out is that the map has a whole lot of white areas, meaning most of the county and most of Columbus have seen zero homicides so far this year. The areas that have seen them do not appear to be much different than previous years- Hilltop, the Far West, the Near South, parts of Linden, and Northland. The Short North has had 1 homicide this year, which is certainly more than normal, but arguably not an epidemic even if gun violence overall is up. The other thing that sticks out is that most homicides are occurring in relatively small areas, and are often tied to certain streets or even certain businesses or residential complexes.
Using this map, we’ll next take a look at the overall homicide rates of specific neighborhoods and areas in and around Columbus to see where the whole of the Short North really ranks.
The ranking gives the neighborhood, how many tracts make it up, the 2020 population, total homicides and the homicide rate per 100,000 people. 1. Franklinton- 3 Tracts- 6,482- 3 Homicides- 46.28 Franklinton is still the most dangerous part of Columbus, and it’s really not even close. This is despite significant redevelopment in the neighborhood. 2. Near South- 13 Tracts- 35,026- 7 Homicides- 19.99 The Near South comes in a distant 2nd place. It includes a much larger area than Franklinton, but about half of the homicides occurred in the 3 tracts to the southeast of Nationwide Children’s Hospital. Places like German and Merion Village have had none. 3. Weinland Park- 2 Tracts- 6,393- 1 Homicide- 15.64 It seems a little unfair to rank Weinland Park 3rd when it’s only had a single homicide, but that’s just how the math works out. The single homicide has been lumped in with the Short North by some media, but it occurred well north across from Campus. 4. Near East- 9 Tracts- 21,841- 3 Homicides- 13.74 The Near East Side ranks 4th for the year so far. It’s been somewhat quieter than normal in this part of the city. 5. Linden- 14 Tracts- 41,627- 5 Homicides- 12.01 Similar to the Near East, Linden has been a bit more quiet than normal despite the relatively bad year Columbus is having. 5. Hilltop- 16 Tracts- 68,045- 8 Homicides- 11.76 Hilltop has had the 2nd most homicides of any of the neighborhoods looked at, but it’s also one of the largest and highest-populated as well, so the rate was lower than those above. 6. Northland- 18 Tracts- 89,165- 9 Homicides- 10.09 Northland has had the most homicides so far of any area of the city or county. Like Hilltop, however, its higher population means its rate is still relatively lower. 7. Short North- 4 Tracts- 12,472- 1 Homicide: 8.07 The Short North’s single homicide puts the neighborhood in 7th place overall. The rate itself is only slightly above that of the entirety of Columbus, so it doesn’t seem to be much of an outlier. 8. Far West- 11 Tracts- 51,308- 3 Homicides- 5.85 The Far West is the only neighborhood looked at that is entirely outside of I-270. It’s rate is only about 60% of the overall Columbus rate at this point in the year. 9. OSU Campus- 12 Tracts- 55,281- 2 Homicides- 3.62 Another large and heavily-populated area, the Campus neighborhood has been fairly safe so far this year. 10. Downtown- 5 Tracts- 12,297- 0 Homicides- 0.0 Downtown has had no homicides so far this year, a departure from last year in which it had already seen 1 at this point on its way to a total of 4 for 2022. 11. Whitehall- 8 Tracts- 23,054- 0 Homicides- 0.0 Another area I think that has had a somewhat negative reputation for crime is Whitehall, the only non-Columbus area looked at. It’s also had no homicides so far this year.
Overall, the neighborhoods above have accounted for 42 of the 65 total homicides so far this year, or about 65%. Most of the rest were very scattered.
So is the Short North dangerous? Not in terms of homicides, no, but that doesn’t mean that recent crime trends should be ignored. That said, it’s pretty clear other neighborhoods are much more deserving of attention in this regard, but may not have the economic or social clout to demand it. Of course, it also needs to be said that homicides are just a single type of crime. An examination of other types of crime may show a completely different story, but those other types rarely get the kind of breathless, hyperbolic reporting that homicides do.
Next month, AllColumbusData.com will have its 10-year anniversary. Hard to believe! Here are some stats on just some of what the site now contains: -338 published posts. 10 additional are already complete and scheduled over the next few months. -105 specific content pages. -Well over 2,000 individual and before and after series historic photos. -143+ years of weather data for both Columbus and its suburbs. -200+ years of demographic and population data for Columbus and its suburbs. -Information and photos for hundreds of current and past development projects. -100+ videos.
What has been the most visited page, the most popular post over the years? Unfortunately, visitor data was lost prior to 2015 for various reasons. However, here have been the top 10 most popular posts and pages since 2015.
Top 10 Posts and the Year Published 1. Before and After How Columbus Changed in 10 Years 2021 This 2-part series was extremely popular last year, and easily became the most visited in the past 7 years. 2. Questions Answered- Columbus Zip Codes 2014 This post was very popular into 2018, but is now defunct. The information on this post ended up becoming bits and parts of other posts and pages. 3. Columbus Retail History- Shopping Centers 2013 One of the oldest posts on the site, it still gets consistent traffic almost a decade later. 4. Columbus Historic Church Demolition 2021 This one detailed plans to demolish an old church on the South Side. 5. Columbus Area Murders by Zip Code 2008-2015 2016 Pretty explanatory. This post provided crude maps of murders by zip code. 6. Columbus’ Greatest Snowstorm 2021 This post gave an account of the March 7-8, 2008 blizzard. 7. Columbus Area Zip Codes and Their Economies 2013 Still a consistent hit after a decade, this post gave details on economic information by local zip code. 8. Winter 2020-2021 Review 2021 Review the 2020-2021 winter with stats and rankings, something that has been done for all winters since 2014. 9. Franklin County Gentrification Trends 1990-2015 2017 This post looked at how income and race changes were driving neighborhood gentrification around Columbus. 10. How We Should Develop Around Intel 2022 The most recent on this list, this post deals with how the area around the Intel project should have a development plan, and detailed a hypothetical map of what that development could look like.
Top 10 Pages 1. Columbus Tornado History The most popular by far, this page covers historic tornadic events throughout the entire Columbus Metro Area. 2. Olde Towne East Historic Buildings This has been the most popular of all the Historic Building Database pages to date. 3. Proposed Development This regularly-updated development page highlights the region’s many proposed projects. 4. Other Residential Historic Buildings This page was one of the very first to be included in what would eventually become the Historic Building Database. It is defunct now, as its photos were eventually divided into a much greater expansion of featured neighborhoods. 5. Development Under Construction All the projects currently under construction at any given time. 6. Census Tract Maps Demographics, population and other data at the census tract level are provided in interactive maps going back to 1930. 7. Winter Storms This page chronicles significant winter weather events from the past. 8. Columbus Flood History As above, but dealing with flooding events. 9. Columbus Crime Statistics Violent and property crime data, maps and demographic data related to Columbus crime are provided going back about 40 years. 10. Completed Development Buildings and projects that were completed at some point in the past are highlighted on this page going back to the 19th Century.
Any surprises in what has been the most popular? Any posts or pages you’d like to see more of? Let me know here or on the Facebook page if you are enjoying the content or would like to see something different!
One of the big factors in determining both relocations and local quality of life is crime rates by city. These rates give people an idea, or at least the perception, of which cities are safe and which are not. In this first part of a series, we take a look at violent and property crime rates for all US cities with populations at or above 250,000.
To make the comparison, I used the FBI’s Uniform Crime data, which generally goes back to the 1980s. I won’t be going back quite that far, but I will compare 3 different more recent years for each city and rank them.
Some caveats with the data: UCI collects voluntary data, so cities provide the data themselves to the FBI rather than the FBI collecting it directly. This means that cities can potentially fudge the data if they want to by reporting fewer crimes than actually occurred. Cities, especially those in high tourism states, have some incentive to do this given perceived safety is extremely important to economic outcomes. That said, it’s not exactly a free-for-all reporting system, either. There are certain standards that have to be met for data to be accepted, and reported numbers are occasionally rejected and not included in the UCI data.
In any case, this is going to be a big post, so bear with me!
In the above ranking, red cities were those that saw their violent crime rankings worsen vs. the previous decade, while blue cities have seen their rankings improve vs. the previous decade. Black cities are those that saw no ranking change. Keep in mind that although rankings may have changed for the better or worse, their actual violent crime rates may have moved in the opposite direction.
Top 25 Best Violent Crime Rate Changes By Period 2000-2010————————-2010-2020————————-2000-2020 1. Tampa: -1456.4—————–1. Atlanta: -1099.3—————–1. Atlanta: -2511.7 2. Atlanta: -1412.40—————2. Philadelphia: -851.2————2. Miami: -1575 3. Orlando: -1031.1—————3. Las Vegas: -774.9————–3. Tampa: -1552.4 4. Baltimore: -957.3—————4. Miami: -623.3——————–4. Orlando: -1290.7 5. Miami: -951.7——————–5. Newark: -562.1——————5. Philadelphia: -1139.8 6. Los Angeles: -793.3————6. Buffalo: -446.1——————-6. Baltimore: -997.5 7. Charlotte: -721——————7. Pittsburgh: -440.9—————7. St. Petersburg: -937.1 8. Dallas: -584.9——————–8. St. Petersburg: -440.8——–8. Jersey City: -790.7 9. Portland: -554.3—————–9. Jersey City: -340.1————-9. Chicago: -638.5 10. Chicago: -552.8————–10. N. Las Vegas: -337.9———10. Los Angeles: -619 11. Nashville: -514.4————-11. Cincinnati: -336.4————–11. Boston: -598.4 12. St. Petersburg: -496.3——12. Oakland: -321——————12. Portland: -545.9 13. Newark: -454.9—————13. Indianapolis: -302————-13. N. Las Vegas: -527.2 14. Jersey City: -450.6———-14. Boston: -297.8——————14. Washington DC: -517 15. Jacksonville: -450.3———15. Orlando: -259.6—————–15. Pittsburgh: -498.2 16. Kansas City: -399————16. Lexington: -259.5————–16. Nashville: -492.6 17. Lubbock: -385.1————–17. Washington DC: -250.9——17. Charlotte: -473.3 18. Albuquerque: -358.8——–18. Oklahoma City: -207.1——–18. Dallas: -467 19. New York: -352.1————19. Sacramento: -205.8————19. El Paso: -460.7 20. El Paso: -339.2————–20. San Francisco: -164.9———-20. Jacksonville: -439.3 21. St. Louis: -335.8————-21. Laredo: -157.9——————-21. Lexington: -401.4 22. Raleigh: -311.3—————22. Lincoln: -142.7——————22. New York: -400.5 23. Riverside: -309.7————23. Columbus: -136.1————–23. Raleigh: -337.8 24. New Orleans: -309.4——-24. Detroit: -129.5——————-24. Buffalo: -318.4 25. Boston: -300.6—————25. Stockton: -128.6—————-25. Riverside: -312.9
It’s somewhat surprising just how dangerous many Sun Belt cities were in the early 2000s- and still are in some cases- despite never earning nearly any negative reputation that cities like Chicago, New York, Philly and others had. Even today, cities like Chicago are constantly mentioned for being a violent city, but yet Las Vegas, Miami, Houston, Orlando, Indianapolis and many other cites all have higher violent crime rates. It’s a classic example of both how perception is often not supported by the evidence, and how media can push skewed narratives. Looking at Ohio cities, specifically, the picture overall is not great. Both Cleveland and Toledo are in the top 25 cities with the highest violent crime rates, and both rates increasing. Cincinnati was somewhat all over the place, with its rate skyrocketing 2000-2010, but then plummeting 2010-2020 to fall out of the top 25. Columbus, meanwhile, has been in a consistent- if not slower- decline that put it outside of the top 50 by 2020.
Overall, the majority of cities saw their violent crime rates fall between 2000-2020. This, again, goes contrary to the existing narrative that cities are becoming more dangerous. The pandemic and its economic effects have caused some spikes in some places, but long-term, it remains to be seen if these trends continue or abate.
In upcoming posts, we will examine cities by both homicide rates and property crime rates. Stay tuned!
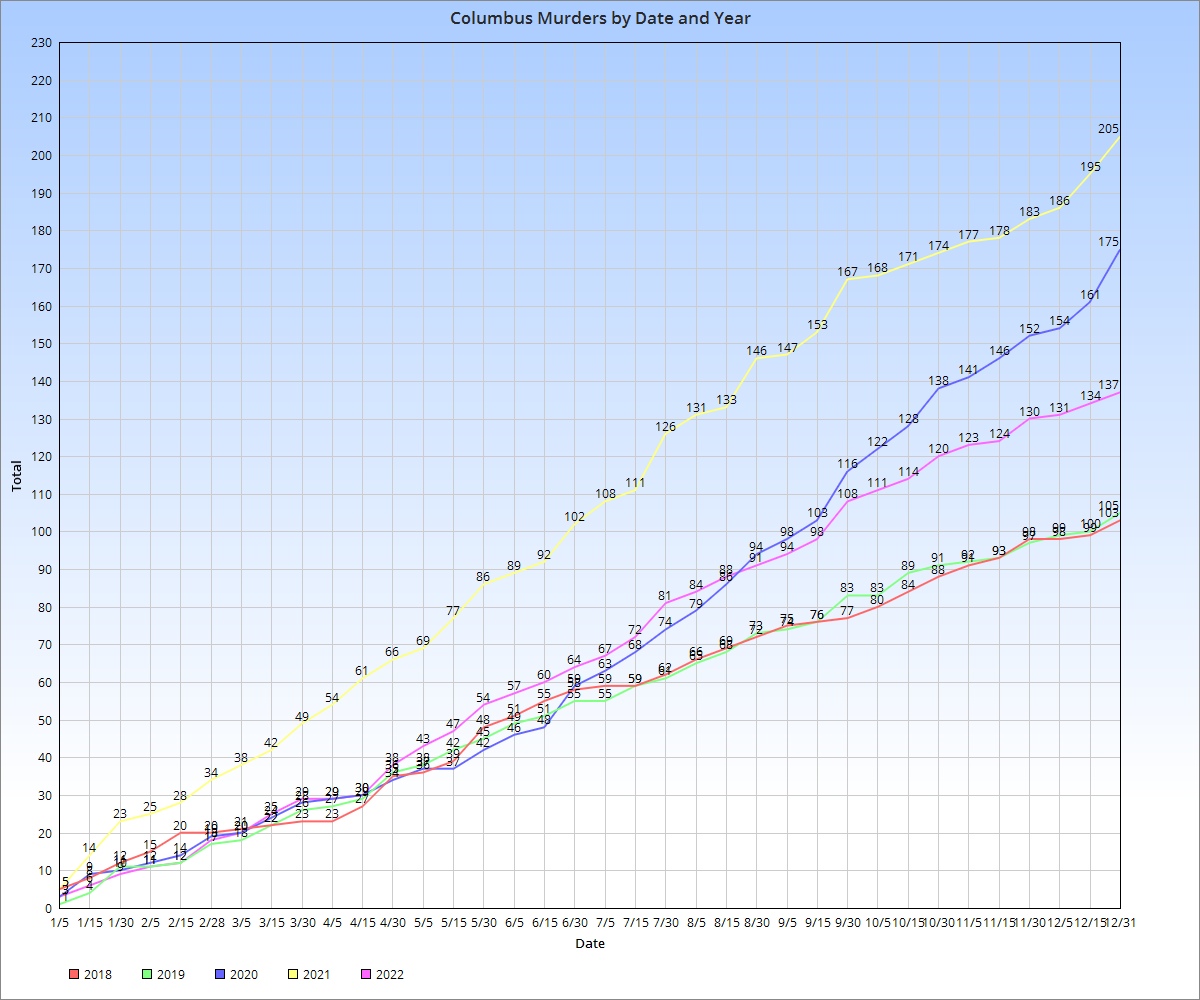
I decided to create this Columbus murder tracker for a few reasons. First, 2020 and 2021 produced consecutive records for total murders in the city, with 2021 coming in far above all other years on record. Additionally, 2021 managed to have the highest murder rate overall, narrowly beating out the early 1990s crack epidemic years. This is significant given that in 2021, the city had a much larger population than it did 30 years ago. I wanted to see if this trend would continue in 2022 or if 2021 was just a very bad fluke. Second, I wanted to monitor just where murders were taking place in the city. Columbus is going through rapid changes, so I wanted to see if neighborhoods that have been seeing revitalization are still having violent crime issues. To find out the answers to these questions, this murder tracker monitored homicides through the year and compared the results with previous years. A graph below counts total murders by specific dates of every year since 2018 vs. 2022. Additionally, an interactive map is provided to give further details on specific locations and report information. Homicide data is mostly provided by the Columbus Division of Police
The 2022 final numbers are in! 137 murders took place across the year. While not exactly good, this represents a significant decline from both 2020 and 2021. There were 68 fewer than 2021 and 38 fewer than 2020. With luck, this trend of decline will continue into 2023. It is possible that additional murders will be added to the 2022 over the next few days/weeks/months, so this total will probably change a bit in time. Regardless, 2022 will still end up a vast improvement from last year’s record. Starting in 2023, the Murder Tracker will be located on the main Columbus Crime Statistics page.
I updated the Columbus Crime Statistics page with 2019 data, which is the latest year available. The data comes from what the city reported to the FBI’s Uniform Crime Reporting system.
2019 Violent Crime -There were 5,350 incidents of violent crime in Columbus in 2019, down slightly from 2018’s 5,365. The rate per 100K people was 595.4, down from 2018’s 601.0. -There is some discrepancy between the murders the city reported to the FBI- 81- and the total number of homicides it reported in its 2019 year-end report- 104. At 81 murders, it would be a rate of 9 per 100K, while 104 would be a rate of 11.6 per 100K. Even at 104, it would represent a drop from 2018’s 109. -There were 882 reported rapes, down from 2018’s 894. There were 98.2 rapes per 100K, down from 2018’s 99.9. -Robberies continued their years-long decline, with 1,810 total and a rate of 201.4 per 100K. Robberies have declined 53% since 2007. -There were 1,788 aggravated assaults at a rate of 199.0 per 100K. Assaults were higher than 2018’s 1,615, but they are still down nearly 35% since they peaked in 1990.
Violent Crime Changes By Age Group 2010-2019 0 to 19: -41.2% 20 to 39: -33.9% Unknown Age: -30.8% 40 to 59: +12.8% 60 and Over: +220.9%
Perhaps strangely, Asians, women and older people have seen their crime rates increase. In all 3 cases, the total crimes were relatively low in comparison to other groups, but the changes were significant enough to be noticeable.
2019 Property Crime -There were 29,974 property crimes reported in 2019 for a rate of 3335.6 per 100K, down from 2018’s 3596.3. Property crimes peaked in 2001 with 62,151, but have fallen nearly every year since. The 2019 total was 51.8% lower than in 2001. -Larceny thefts reached 20,606 for a rate of 2293.1 per 100K. This is both down from 2018’s 2427.8 and 46.9% lower than their 2001 peak. -Burglaries continued their dramatic fall in 2019. 5,809 were reported for a rate of 646.5 per 100K. This is down from 6,477 and 724.9 in 2018, and down nearly 62% just since 2010. -There were 3,559 motor vehicle thefts for a rate of 396.1 per 100K in 2019, down from 3,962 and 443.7 in 2018. As with burglaries, motor vehicle thefts are down significantly in recent years, having fallen more than 58% just since 2004.