*Some photos have been updated since the time of the original post.
Before: South Central Avenue, looking north, during the flood of January 21-24, 1959. After: 2015 The 1959 flood was the 2nd worst in the history of Franklinton after the 1913 disaster. The Frank Road crest on the Scioto River came on January 22, 1959 and was 27.22 ft, 3.22 ft above flood stage and a few feet below the 1913 crest. This crest would not cause serious flooding in Franklinton today, as the Franklinton Floodwall, completed in 2004, will protect the area to crests of up to 30.9 ft. Few people know that, prior to the wall’s completion, federal guidelines prohibited almost all types of construction in Franklinton, a contributing factor in the gradual decline it faced after the 1950s.
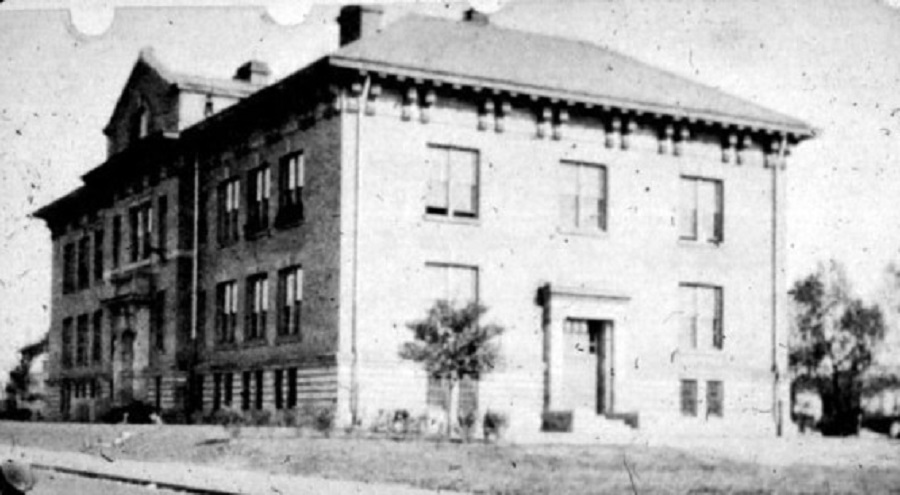
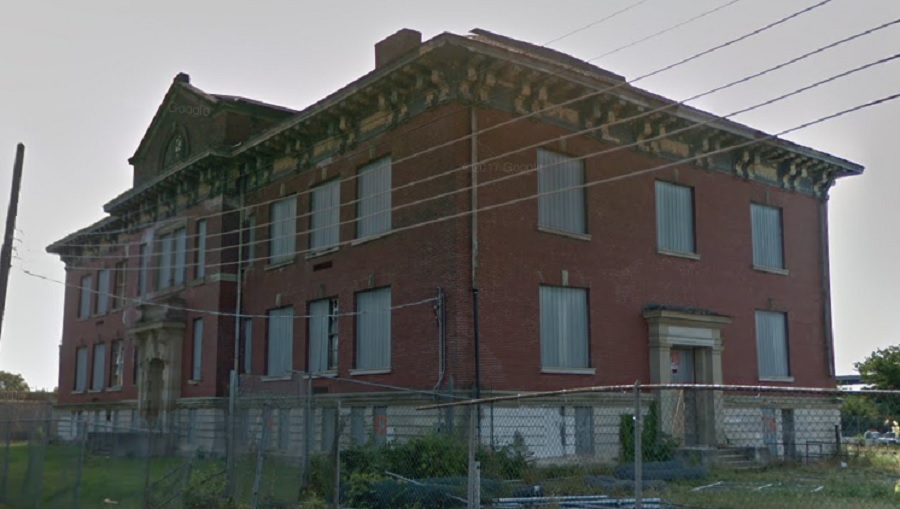
Before: Bellows Avenue Elementary on Bellows Avenue in 1922. After: 2017 Bellows Elementary was opened in 1905 and barely escaped destruction during the I-70/315 highway construction. The building remained a school through the 1970s before closing and being sold by the city in 1984. It has remained vacant since then. Recent proposals to turn it into apartments, particularly as Franklinton has begun a massive revitalization, and the building has received a new roof, so further deterioration has been stopped for now. The building, however, is threatened by possible demolition once the 70/71 split is reconstructed in sometime in the mid-2020s.
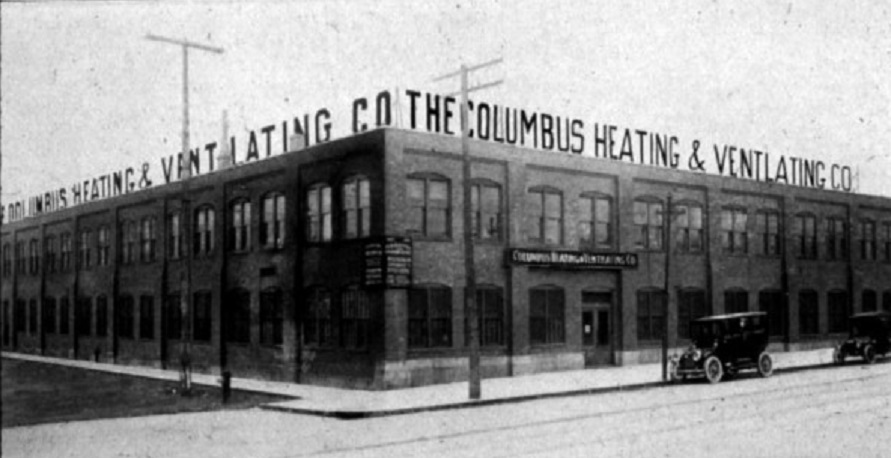
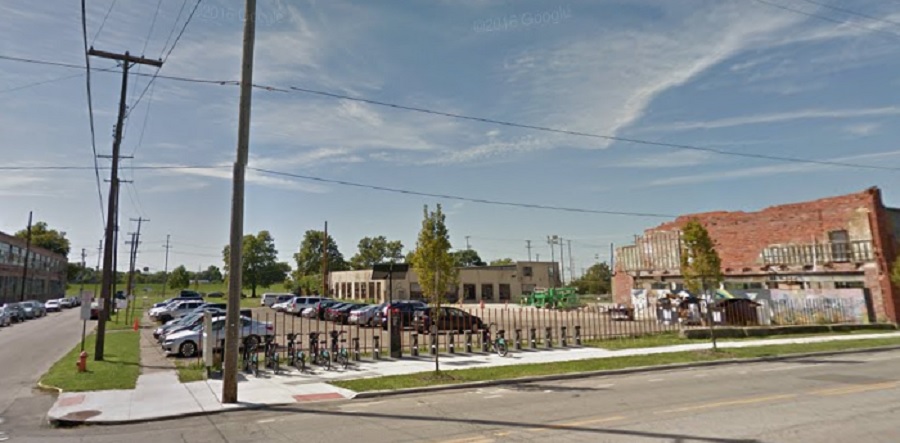
Before: The Columbus Heating and Ventilation Company building at 433 W. Town Street in 1916. After: 2016 The Columbus Heating and Ventilating Company began in 1903 and still exists in the city, although obviously not at its original location. It later served as factories and parts of the complex were even used to enrich uranium for the Manhattan Project. The old building eventually went into severe disrepair and most of the roof had collapsed by the time it was demolished in 2011 as one of the first steps in the area’s rebirth. Multiple redevelopment plans have come and gone for the site, but so far, nothing has come of them.
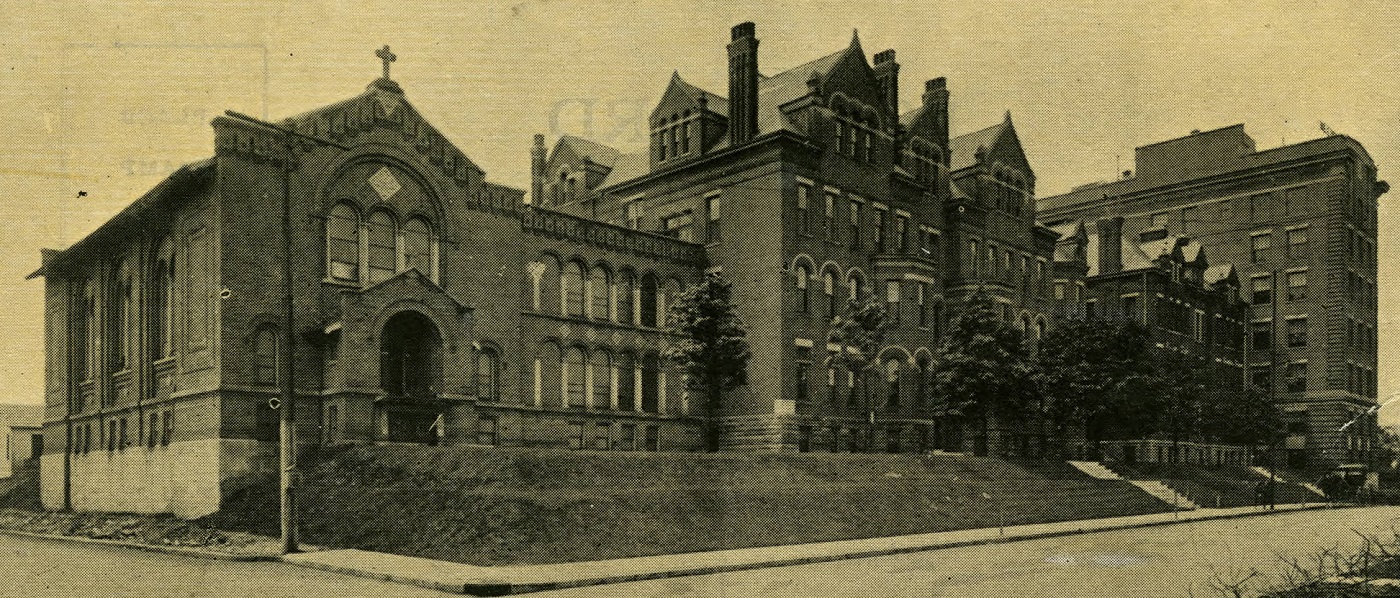
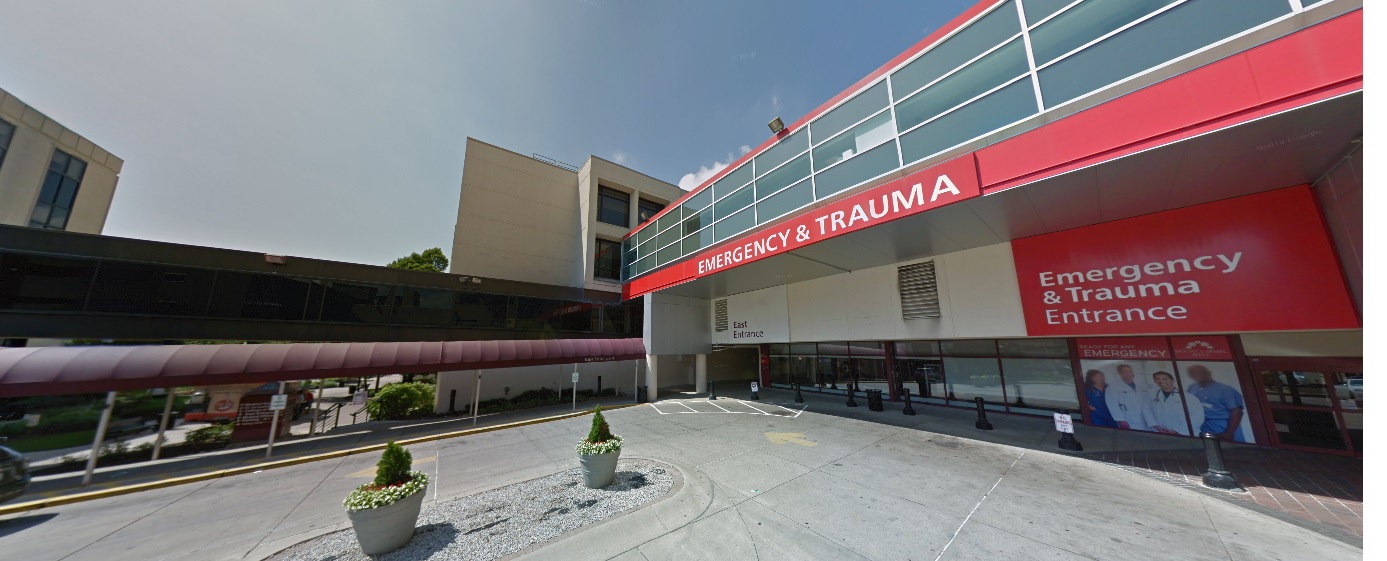
Before: Mt. Carmel Hospital, looking southwest on Davis, in 1909. After: 2018 Mt. Carmel was originally known as Hawkes Hospital. The first section was completed in 1886, with later expansions in 1891 and 1908. Eventually, the old structures were deemed outdated for modern hospital purposes, and the entire complex was demolished in the late 1940s. Today, the site is very different, with the current buildings built on top of the old Davis and State Street intersection. The hospital moved most services to a new location in Grove City in recent years, with plans to demolish part of the complex to create a new mixed-use development.
For thousands more before and after photos from all parts of the city, click here: Historic Building Database
In Part 1 of this comparison, I looked at overall metro area densities.
For tracts, I looked over the maps of all cities within metros that had populations between 1.5 and 2.5 million (based on 2010 census). I then found every tract that had a population density of 5,000 people per square mile or higher, but I tried to stay within the core city and its immediate surroundings. In most cases, this was just within the central metro county, but some cities are split between county borders and even state borders, so I tried to use an equal approximation.
First, the total number of tracts with 5,000+ densities by city and rank. 1. Las Vegas: 290 2. San Jose: 285 3. Cleveland: 211 4. Milwaukee: 198 5. Portland: 174 6. Sacramento: 168 7. Pittsburgh: 147 8. San Antonio: 118 9. Columbus: 98 10. Virginia Beach: 92 11. Cincinnati: 84 12. Providence: 84 13. Austin: 61 14. Orlando: 47 15. Indianapolis: 46 16. Kansas City: 44 17. Nashville: 21 18. Charlotte: 16
Average Density for all Tracts that have 5,000+ Densities by Rank 1. Milwaukee: 10,394.2 2. Providence: 10,163.5 3. San Jose: 10,114.8 4. Pittsburgh: 8,753.8 5. Las Vegas: 8,604.4 6. Austin: 7,981.4 7. Cleveland: 7,882.1 8. Columbus: 7,821.8 9. Portland: 7,679.8 10. Cincinnati: 7,586.7 11. Sacramento: 7,397.3 12. Virginia Beach: 7,304.1 13. San Antonio: 6,736.5 14. Kansas City: 6,703.7 15. Orlando: 6,689.5 16. Charlotte: 6,678.2 17. Nashville: 6,558.7 18. Indianapolis: 6,170.7
Average Density of Top 15 Most Dense Tracts by Rank Milwaukee: 23,786.4 San Jose: 22,225.5 Pittsburgh: 18,581.4 Las Vegas: 18,227.8 Providence: 16,701.2 Portland: 15,401.5 Columbus: 14,733.6 Austin: 13,660.0 Cleveland: 13,458.6 Cincinnati: 12,443.9 Virginia Beach: 12,396.5 Sacramento: 12,261.4 San Antonio: 9,497.6 Orlando: 8,955.3 Kansas City: 8,476.5 Indianapolis: 7,294.0 Nashville: 7,113.9 Charlotte: 6,787.5
Columbus doesn’t do too badly with these numbers and certainly better than I was really expecting. In general, it’s more dense in parts than it gets credit for being. Las Vegas stands out as the most surprising to me, but I guess the built environment there is pretty dense when you think about it, at least in the urban core that these numbers measured. Charlotte, Indianapolis and Nashville have incredibly low densities for being major, moderate-fast growing metros/cities. Columbus and Indianapolis are often called twin cities and compared regularly, but this is one area where there’s a pretty stark difference. I plan to do a formal comparison of the two metros at some point in the future.
In regards to the 5,000+ density tracts, here’s a further breakdown.
All Tracts with a Density of 25,000 or More and % of Total 5,000+ Tracts by Rank 1. Austin: 2 3.3% 2. Milwaukee: 4 2.0% 3. San Jose: 4 1.4% 4. Virginia Beach: 1 1.1% 5. Columbus: 1 1.0% 6. Pittsburgh: 1 0.7% 7. Portland: 1 0.6% 8. Charlotte: 0 0.0% 9. Cincinnati: 0 0.0% 10. Cleveland: 0 0.0% 11. Indianapolis: 0 0.0% 12. Kansas City: 0 0.0% 13. Las Vegas: 0 0.0% 14. Nashville: 0 0.0% 15. Orlando: 0 0.0% 16. Providence: 0 0.0% 17. Sacramento: 0 0.0% 18. San Antonio: 0 0.0%
All Tracts with a Density of 20,000 or More and % of Total 5,000+ Tracts by Rank 1. Milwaukee: 13 6.6% 2. Austin: 3 4.9% 3. Columbus: 3 3.1% 4. Pittsburgh: 4 2.7% 5. San Jose: 6 2.1% 6. Las Vegas: 4 1.4% 7. Providence: 1 1.2% 8. Portland: 2 1.1% 9. Virginia Beach: 1.1% 10. Cleveland: 1 0.5% 11. Charlotte: 0 0.0% 12. Cincinnati: 0 0.0% 13. Indianapolis: 0 0.0% 14. Kansas City: 0 0.0% 15. Nashville: 0 0.0% 16. Orlando: 0 0.0% 17. Sacramento: 0 0.0% 18. San Antonio: 0 0.0%
All Tracts with a Density of 15,000 or More and % of Total 5,000+ Tracts by Rank 1. Milwaukee: 32 16.2% 2. Providence: 12 14.3% 3. San Jose: 31 10.9% 4. Austin: 5 8.2% 5. Pittsburgh: 12 8.2% 6. Columbus: 6 6.1% 7. Las Vegas: 13 4.5% 8. Portland: 6 3.4% 9. Sacramento: 3 1.8% 10. Cincinnati: 1 1.2% 11. Virginia Beach: 1 1.1% 12. Cleveland: 2 0.9% 13. Charlotte: 0 0.0% 14. Indianapolis: 0 0.0% 15. Kansas City: 0 0.0% 16. Nashville: 0 0.0% 17. Orlando: 0 0.0% 18. San Antonio: 0 0.0%
All Tracts with a Density of 10,000 or More and % of Total 5,000+ Tracts by Rank 1. Providence: 37 44.0% 2. San Jose: 112 39.3% 3. Milwaukee: 52 26.3% 4. Pittsburgh: 36 24.5% 5. Las Vegas: 67 23.1% 6. Cleveland: 37 17.5% 7. Cincinnati: 14 16.7% 8. Austin: 9 14.8% 9. Nashville: 3 14.3% 10. Portland: 21 12.1% 11. Virginia Beach: 8 8.7% 12. Orlando: 4 8.5% 13. Columbus: 8 8.2% 14. Sacramento: 13 7.7% 15. Charlotte: 1 6.3% 16. San Antonio: 3 2.5% 17. Kansas City: 1 2.3% 18. Indianapolis: 0 0.0%
All Tracts with a Density of 9,000 or More and % of Total 5,000+ Tracts by Rank 1. Providence: 47 56.0% 2. San Jose: 132 46.3% 3. Las Vegas: 101 34.8% 4. Milwaukee: 65 32.8% 5. Pittsburgh: 47 32.0% 6. Cleveland: 52 24.6% 7. Cincinnati: 19 22.6% 8. Austin: 13 21.3% 9. Portland: 29 16.7% 10. Columbus: 16 16.3% 11. Nashville: 3 14.3% 12. Sacramento: 24 14.3% 13. Kansas City: 6 13.6% 14. Charlotte: 2 12.5% 15. Virginia Beach: 10 10.7% 16. Orlando: 5 10.6% 17. San Antonio: 9 7.6% 18. Indianapolis: 0 0.0%
All Tracts with a Density of 8,000 or More and % of Total 5,000+ Tracts by Rank 1. San Jose: 183 64.2% 2. Providence: 52 61.9% 3. Las Vegas: 136 46.9% 4. Pittsburgh: 63 42.9% 5. Milwaukee: 82 41.4% 6. Cleveland: 87 41.2% 7. Sacramento: 49 29.2% 8. Austin: 17 27.9% 9. Cincinnati: 23 27.4% 10. Columbus: 26 26.5% 11. Portland: 41 23.6% 12. Kansas City: 10 22.7% 13. Orlando: 10 21.3% 14. Virginia Beach: 19 20.7% 15. San Antonio: 17 14.4% 16. Nashville: 3 14.3% 17. Charlotte: 2 12.5% 18. Indianapolis: 2 4.3%
All Tracts with a Density of 7,000 or More and % of Total 5,000+ Tracts by Rank 1. San Jose: 222 77.9% 2. Providence: 58 69.0% 3. Las Vegas: 185 63.8% 4. Cleveland: 119 56.4% 5. Milwaukee: 111 56.1% 6. Pittsburgh: 80 54.4% 7. Sacramento: 83 49.4% 8. Cincinnati: 38 45.2% 9. Columbus: 42 42.9% 10. Virginia Beach: 39 42.4% 11. Portland: 71 40.8% 12. Austin: 23 37.7% 13. Charlotte: 5 31.3% 14. Kansas City: 13 29.5% 15. San Antonio: 32 27.1% 16. Orlando: 12 25.5% 17. Nashville: 4 19.0% 18. Indianapolis: 8 17.4%
All Tracts with a Density of 6,000 or More and % of Total 5,000+ Tracts by Rank 1. San Jose: 260 91.2% 2. Las Vegas: 235 81.0% 3. Providence: 68 81.0% 4. Pittsburgh: 113 76.9% 5. Sacramento: 122 72.6% 6. Cleveland: 153 72.5% 7. Milwaukee: 142 71.7% 8. Columbus: 66 67.3% 9. Portland: 113 64.9% 10. Cincinnati: 54 64.3% 11. Orlando: 29 61.7% 12. San Antonio: 71 60.2% 13. Virginia Beach: 55 59.8% 14. Austin: 35 57.4% 15. Kansas City: 25 56.8% 16. Nashville: 10 47.6% 17. Charlotte: 7 43.8% 18. Indianapolis: 20 43.5%
Top 20 Most Dense Tracts from all 18 Metros 1. 48,971.9: Virginia Beach #38 2. 48,602.1: San Jose #500902 3. 32,306.4: Pittsburgh #404 4. 31,919.9: Milwaukee #11 5. 31,627.6: Milwaukee #147 6. 29,072: Columbus #181 7. 28,922.9: San Jose #509107 8. 27,544.8: Milwaukee #164 9. 26,825.8: Portland #56 10. 25,543.1: Austin #603 11. 25,271.2: Milwaukee #146 12. 25,229.7: Austin #604 13. 25,195.3: San Jose #509403 14. 25,053.2: San Jose #503118 15. 24,925.7: Columbus #13 16. 24,882.3: Las Vegas #2996 17. 24,666.9: Pittsburgh #9822 18. 24,481.1: Pittsburgh #406 19. 24,043.4: Portland #48 20. 24,025.6: Las Vegas #2207
New 2012 metro and county population estimates have been released by the US Census, so we’ll break down the numbers and see if any trends pop out.
First the statewide county maps for numerical change for 2010-2011 and 2011-2012. Some good and bad with these. The bad is that fewer counties were estimated to be growing from 2011-2012 than were in 2010-2011. The good news it that central core counties improved their growth or slowed their losses, such as Franklin, Cuyahoga and Hamilton. This may mean that population is consolidating around urban cores rather than being spread out… or it may just mean that more counties are losing population.
If we take every county estimate, Ohio grew by 10,502, which is a slight improvement from 2011′s 8,447, which itself was faster than 2010′s 7,608. Still very slow, but seemingly getting a bit better each year.
As far as the metropolitan areas, their boundaries were changed last week as new definitions for what constitutes a metro area were introduced. This produced some rather drastic changes to metro areas and their populations.
Old and New Metro Boundaries and their Old and New Populations Akron: Did not change boundaries and still consists of Summit and Portage counties. 2011: 702,854 2012: 702,262
Canton: Did not change and is still Stark and Carroll counties. 2011: 403,164 2012: 403,455
Cincinnati: Added Union County, Indiana, but dropped Franklin County, Indiana. 2011: 2,122,330 2012: 2,128,603
Cleveland: Did not change and is still Cuyahoga, Lake, Lorain, Geauga and Medina counties. 2011: 2,068,397 2012: 2,063,535
Columbus: Added Perry and Hocking Counties. 2011: 1,925,137 2012: 1,944,002
Youngstown: Did not change, still Mahoning, Trumbull and Mercer County, PA. 2011: 561,697 2012: 558,206
As you can see, 5 of the 8 are losing population, though most had slower losses in 2012 than they did in 2011. This may also be a sign of population moving toward the urban centers, or again, could just be a blip.
One of the interesting pieces of data about the metro areas is the section on components of population change, meaning where did the growth or loss come from.
Total Metro Births July 1, 2011 to July 1, 2012 and Rank 1. Cincinnati: +27,374 2. Columbus: +25,910 3. Cleveland: +22,484 4. Dayton: +9,414 5. Akron: +7,418 6. Toledo: +7,285 7. Youngstown: +5,446
Total Metro Deaths July 1, 2011 to July 1, 2012 and Rank 1. Cleveland: -20,290 2. Cincinnati: -18,204 3. Columbus: -14,457 4. Dayton: -7,930 5. Youngstown: -6,811 6. Akron: -6,756 7. Toledo: -5,678
Natural Change (Births vs Deaths) July 1,2011 to July 1, 2012 and Rank 1. Columbus: +11,453 2. Cincinnati: +9,170 3. Cleveland: +2,194 4. Toledo: +1,607 5. Dayton: +1,484 6. Akron: +662 7. Youngstown: -1,365
Domestic Migration July 1, 2011 to July 1, 2012 and Rank 1. Columbus: +2,688 2. Akron: -2,248 3. Youngstown: -2,341 4. Dayton: -2,717 5. Toledo: -2,931 6. Cincinnati: -6,036 7. Cleveland: -10,579
Columbus is the only metro seeing positive domestic migration in Ohio.
International Migration July 1, 2011 to July 1, 2012 and Rank 1. Columbus: +4,729 2. Cleveland: +3,555 3. Cincinnati: +3,217 4. Dayton: +1,175 5. Akron: +1,009 6. Youngstown: +778 7. Toledo: +676
Total In-Migration July 1, 2011 to July 1, 2012 and Rank 1. Columbus: +7,417 2. Youngstown: -974 3. Akron: -1,239 4. Dayton: -1,542 5. Toledo: -2,255 6. Cincinnati: -2,819 7. Cleveland: -7,024
Canton is the only other Ohio metro that saw a net postive in-migration for the time period besides Columbus.
The Columbus Metropolitan Area resides within a group of metros between 1.5 and 2.5 million people. I wanted to take a look at population densities between that group of metros to see how different they really are and where Columbus might fall within them.
Metro Area Population Density Per Square Mile in 2011 and 2012 by Rank 2011 —————————– 2012 1. San Jose: 1,430.6 — 1. Cleveland: 1,033.3 2. Cleveland: 1,035.7 — 2. Providence: 978.8 3. Providence: 978.1 — 3. Milwaukee: 859.6 4. Milwaukee: 856.9 — 4. San Jose: 702.9 5. Charlotte: 687.7 — 5. Virginia Beach: 642.2 6. Virginia Beach: 634.6 — 6. Orlando: 637.0 7. Orlando: 622.0 — 7. Cincinnati: 484.4 8. Cincinnati: 486.6 — 8. Indianapolis: 444.4 9. Columbus: 468.5 — 9. Charlotte: 443.4 10. Indianapolis: 457.5 — 10. Austin: 428.6 11. Austin: 416.7 — 11. Pittsburgh: 413.7 12. Pittsburgh: 413.6 — 12. Columbus: 400.8 13. Portland, OR: 331.9 — 13. Portland: 335.9 14. Sacramento: 313.8 — 14. Sacramento: 316.7 15. San Antonio: 297.1 — 15. San Antonio: 302.4 16. Nashville: 280.6 — 16. Kansas City: 276.5 17. Kansas City: 258.2 — 17. Nashville: 270.7 18. Las Vegas: 243.5 — 18. Las Vegas: 247.3
Higher metro population doesn’t necessarily equate to higher density. The smaller metros tend to have higher densities. Columbus is middle of the pack.
Core County Population in 2011 and 2012 by Rank 2011 —————————————— 2012 1. Clark (Las Vegas): 1,969,975 — 1. Clark (Las Vegas): 2,000,759 2. Santa Clara (San Jose): 1,809,378 — 2. Santa Clara (San Jose): 1,837,504 3. Bexar (San Antonio): 1,756,153 — 3. Bexar (San Antonio) 1,785,704 4. Sacramento (Sacramento): 1,436,105 — 4. Sacramento (Sacramento): 1,450,121 5. Cuyahoga (Cleveland): 1,270,294 — 5. Cuyahoga (Cleveland): 1,265,111 6. Allegheny (Pittsburgh): 1,227,066 — 6. Allegheny (Pittsburgh): 1,229,338 7. Franklin (Columbus): 1,178,799 — 7. Orange (Orlando): 1,202,234 8. Orange (Orlando): 1,169,107 — 8. Franklin: (Columbus): 1,195,338 9. Travis (Austin): 1,063,130 — 9. Travis (Austin): 1,095,584 10. Milwaukee (Milwaukee): 952,532 — 10. Mecklenburg (Charlotte): 969,031 11. Mecklenburg (Charlotte): 944,373 — 11. Milwaukee (Milwaukee): 955,205 12. Marion (Indianapolis): 911,296 — 12. Marion (Indianapolis): 918,977 13. Hamilton (Cincinnati): 800,362 — 13. Hamilton (Cincinnati): 802,038 14. Multnomah (Portland): 748,031 — 14. Multnomah (Portland): 759,256 15. Jackson (Kansas City): 676,360 — 15. Jackson (Kansas City): 677,377 16. Davidson (Nashville): 635,475 — 16. Davidson (Nashville): 648,295 17. Providence (Providence): 626,709 — 17. Providence (Providence): 628,323 18. Virginia Beach (No County): 442,707 — 18. Virginia Beach (No County): 447,021
Core County Area Size in Square Miles in 2011 by Rank Clark (Las Vegas): 8,091 Santa Clara (San Jose): 1,304 Bexar (San Antonio): 1,257 Travis (Austin): 1,022 Orange (Orlando): 1,004 Sacramento (Sacramento): 995 Allegheny (Pittsburgh): 745 Jackson (Kansas City): 616 Mecklenburg (Charlotte): 546 Franklin (Columbus): 544 Davidson (Nashville): 526 Multnomah (Portland): 466 Cuyahoga (Cleveland): 457 Providence (Providence): 436 Hamilton (Cincinnati): 413 Marion (Indianapolis): 403 Virginia Beach (No County): 248 Milwaukee (Milwaukee): 242
Core County Population Density Per Square Mile in 2011 and 2012 by Rank 2011 ——————————————— 2012 1. Milwaukee (Milwaukee): 3,936.1 — 1. Milwaukee: 3,947.1 2. Cuyahoga (Cleveland): 2,779.6 — 2. Cuyahoga: 2,768.3 3. Marion (Indianapolis): 2,261.3 — 3. Marion: 2,280.3 4. Franklin (Columbus): 2,166.9 — 4. Franklin: 2,197.7 5. Hamilton (Cincinnati): 1,937.9 — 5. Hamilton: 1,942.0 6. Virginia Beach (No County): 1,785.1 — 6. Virginia Beach: 1,802.5 7. Mecklenburg (Charlotte): 1,729.6 — 7. Mecklenburg: 1,774.8 8. Allegheny (Pittsburgh): 1,647.1 — 8. Allegheny: 1,650.1 9. Multnomah (Portland: 1,605.2 — 9. Multnomah: 1,629.3 10. Sacramento (Sacramento): 1,443.3 — 10. Sacramento: 1,457.4 11. Providence (Providence): 1,437.4 — 11. Providence: 1,441.1 12. Bexar (San Antonio): 1,397.1 — 12. Bexar: 1,420.6 13. Santa Clara (San Jose): 1,387.6 — 13. Santa Clara: 1,409.1 14. Davidson (Nashville): 1,208.1 — 14. Davidson: 1,232.5 15. Orange (Orlando): 1,164.4 — 15. Orange: 1,197.4 16. Jackson (Kansas City): 1,098.0 — 16. Jackson: 1,099.6 17. Travis (Austin): 1,040.2 — 17. Travis: 1,072.0 18. Clark (Las Vegas): 243.5 — 18. Clark: 247.3
The core counties of metros within the Midwest are clearly the most dense, with most hovering around or above 2,000 people per square mile. Columbus has the 4th densist core county of the bunch.
City Population in 2011 and 2012 by Rank 2011 —————— 2012 1. San Antonio: 1,359,758 2012 numbers to be released in May 2013. 2. San Jose: 967,487 3. Indianapolis: 827,609 4. Austin: 820,611 5. Columbus: 797,434 6. Charlotte: 751,087 7. Nashville: 609,644 8. Milwaukee: 597,867 9. Portland: 593,820 10. Las Vegas: 589,317 11. Sacramento: 472,178 12. Kansas City: 463,202 13. Virginia Beach: 442,707 14. Cleveland: 393,806 15. Pittsburgh: 307,484 16. Cincinnati: 296,223 17. Orlando: 243,195 18. Providence: 178,053
City Area Size in Square Miles in 2011 by Rank Nashville: 527.9 Virginia Beach: 497.3 San Antonio: 412.1 Indianapolis: 372.0 Kansas City: 319.0 Charlotte: 297.7 Austin: 297.0 Columbus: 217.2 San Jose: 180.0 Portland: 145.1 Las Vegas: 135.8 Orlando: 110.7 Sacramento: 100.1 Milwaukee: 96.8 Cleveland: 82.5 Cincinnati: 79.4 Pittsburgh: 58.3 Providence: 20.5
City Population Density Per Square Mile in 2011 by Rank Providence: 8,685.5 Milwaukee: 6,176.3 San Jose: 5,374.9 Pittsburgh: 5274.2 Cleveland: 4,773.4 Sacramento: 4,717.1 Las Vegas: 4,339.6 Portland: 4,092.5 Cincinnati: 3,726.1 Columbus: 3,671.4 San Antonio: 3,299.6 Austin: 2,763.0 Charlotte: 2,523.0 Indianapolis: 2,224.8 Orlando: 2,196.9 Kansas City: 1,452.0 Nashville: 1,154.8 Virginia Beach: 890.2
So for the most part, when it comes to metro density, Columbus runs mostly in the middle, although it does have a rather dense core county.
I’ll examine some tract densities in Part 2, as well as the overall trends for Columbus and where it might fall come 2020.