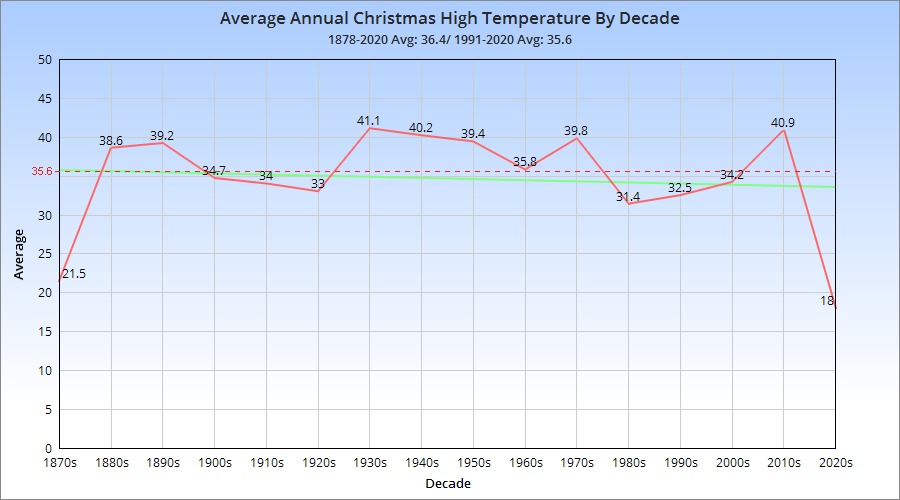
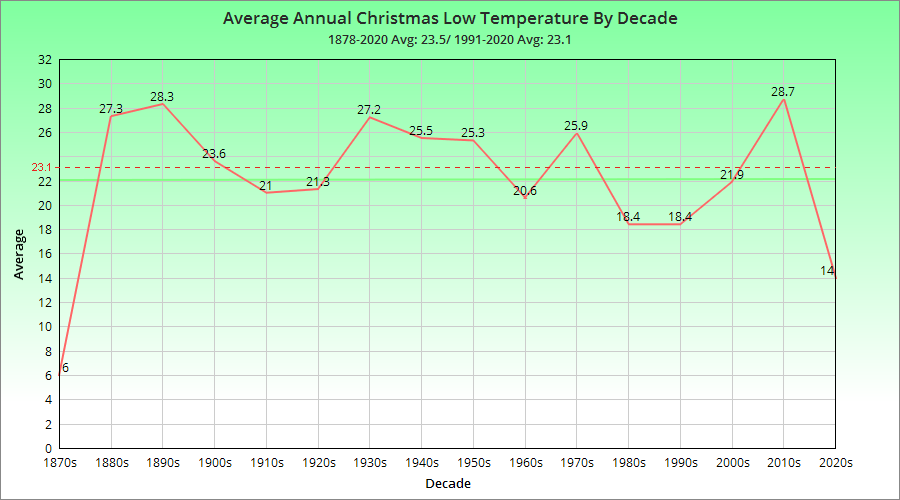
Columbus, Ohio weather is has varied wildly over the 143 years of records, and the holidays are no different. It’s seen record warmth into the 60s, and record cold well below zero, as well as heavy snow and driving rainstorms. The records below break down Columbus’ historic Christmas Day climatology.
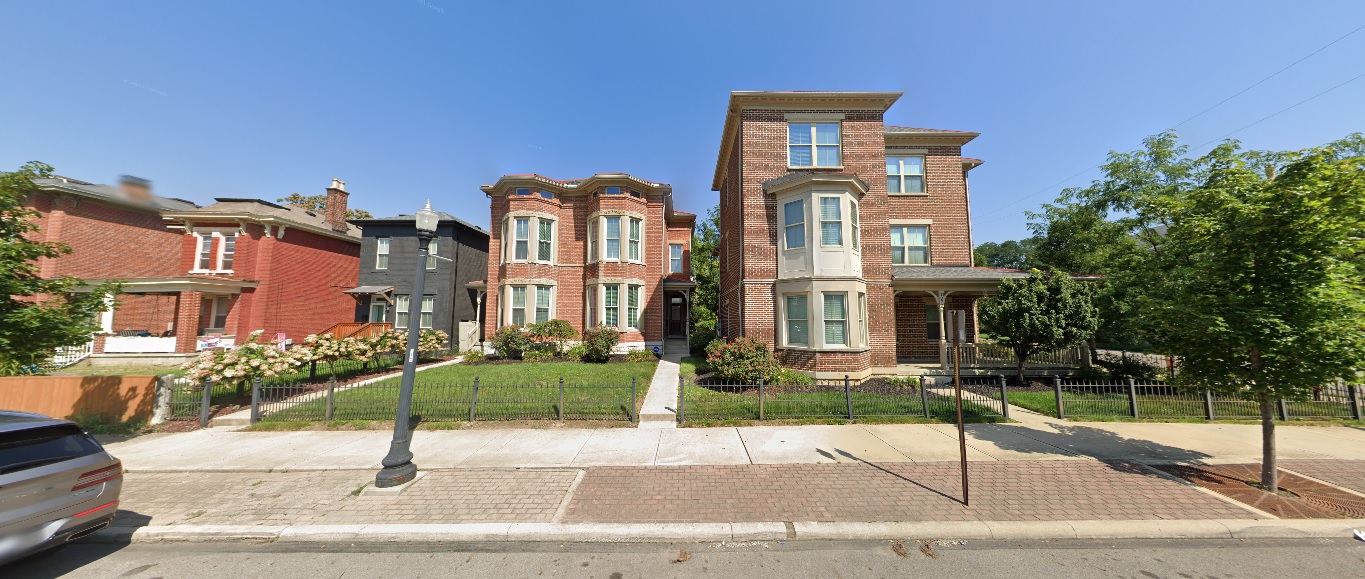
I received a massive positive response for the first version of this series, which was just a simple mashup of before and after photos of different parts of Columbus urban neighborhoods over the course of a decade. Because of that response, I have decided to do this How Columbus has changed in 10 years part 2 series. This time, besides adding more photos from core neighborhoods, I will expand the series out to other parts of the city and some suburbs, though still remaining within the 270 Outerbelt. In some ways, these before and after photos are even more drastic than the first set.
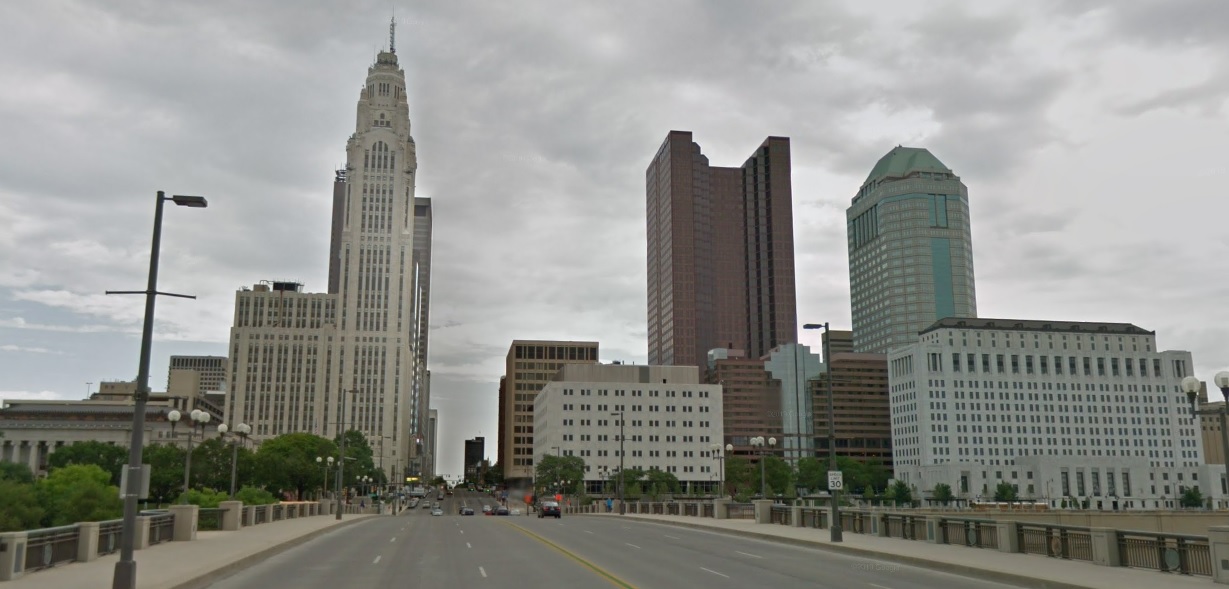
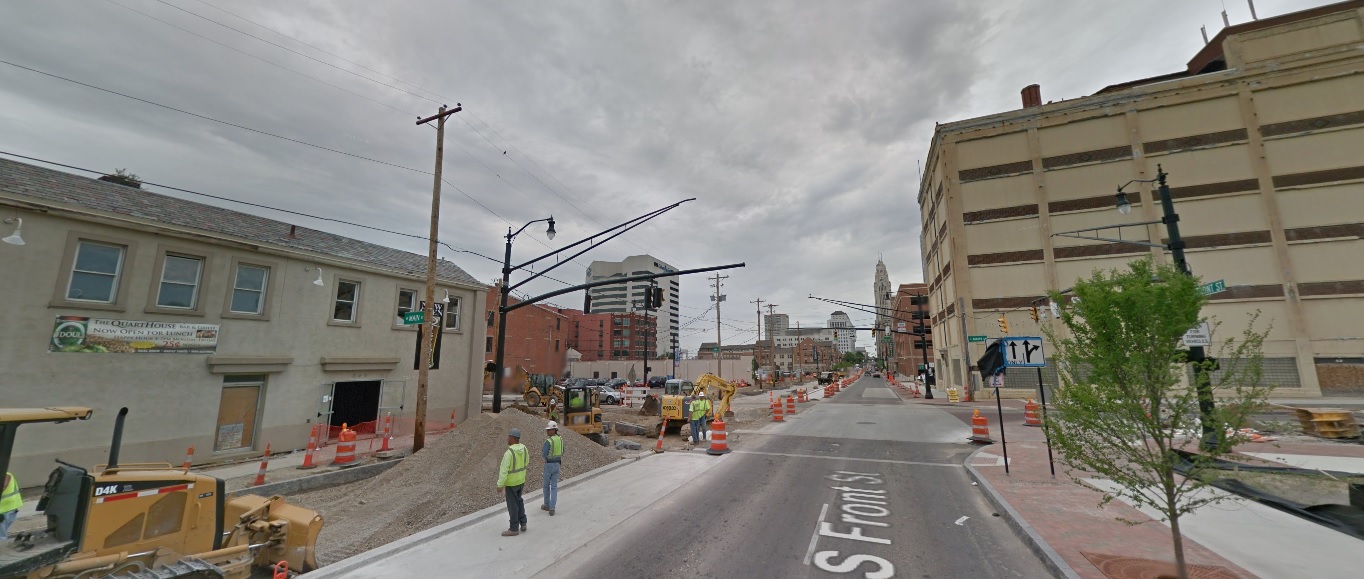
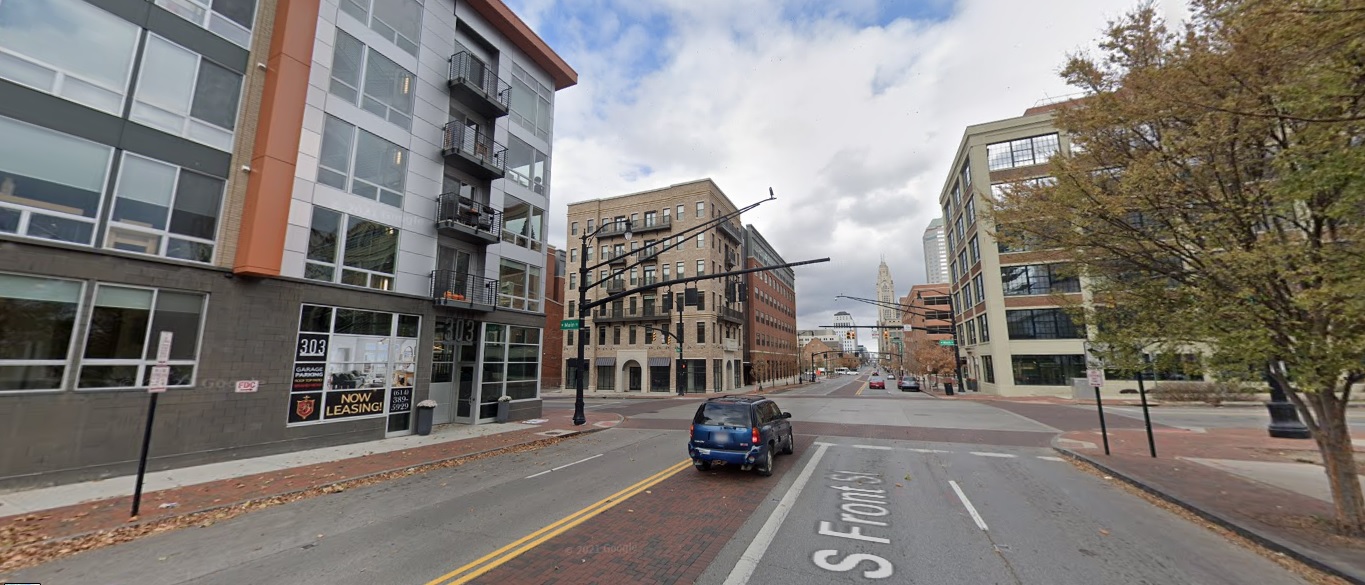
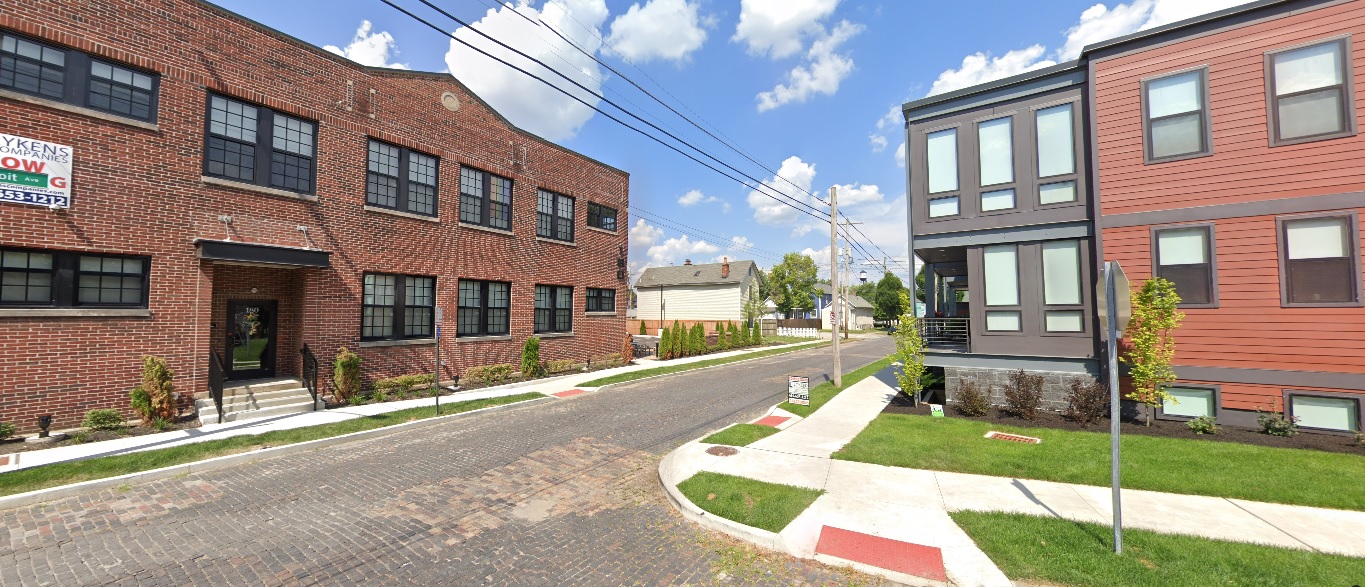
Downtown
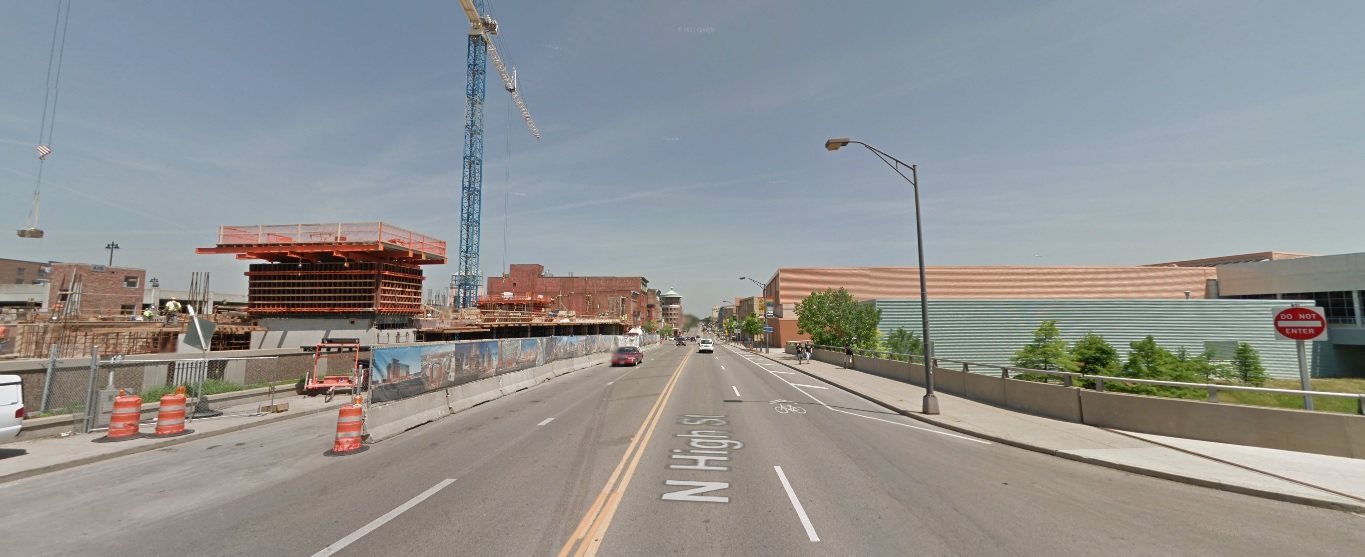
Front Street, looking north from Main Street. Before: 2011 After: 2021
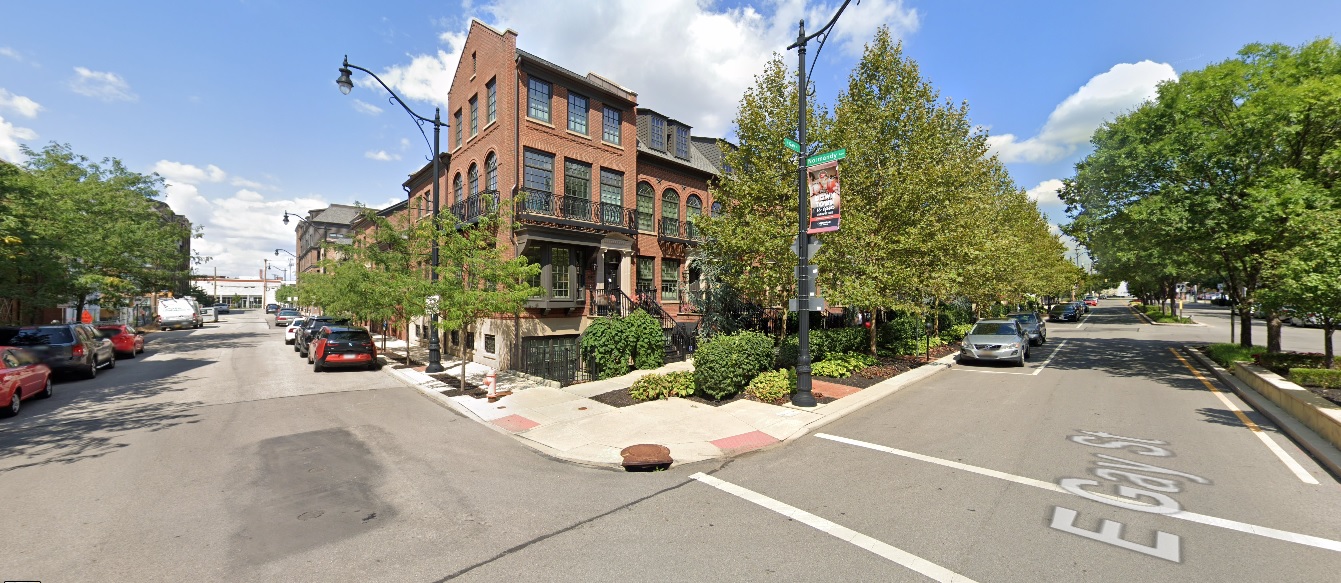
Gay Street, looking west from Front Street. Before: 2011 After: 2020
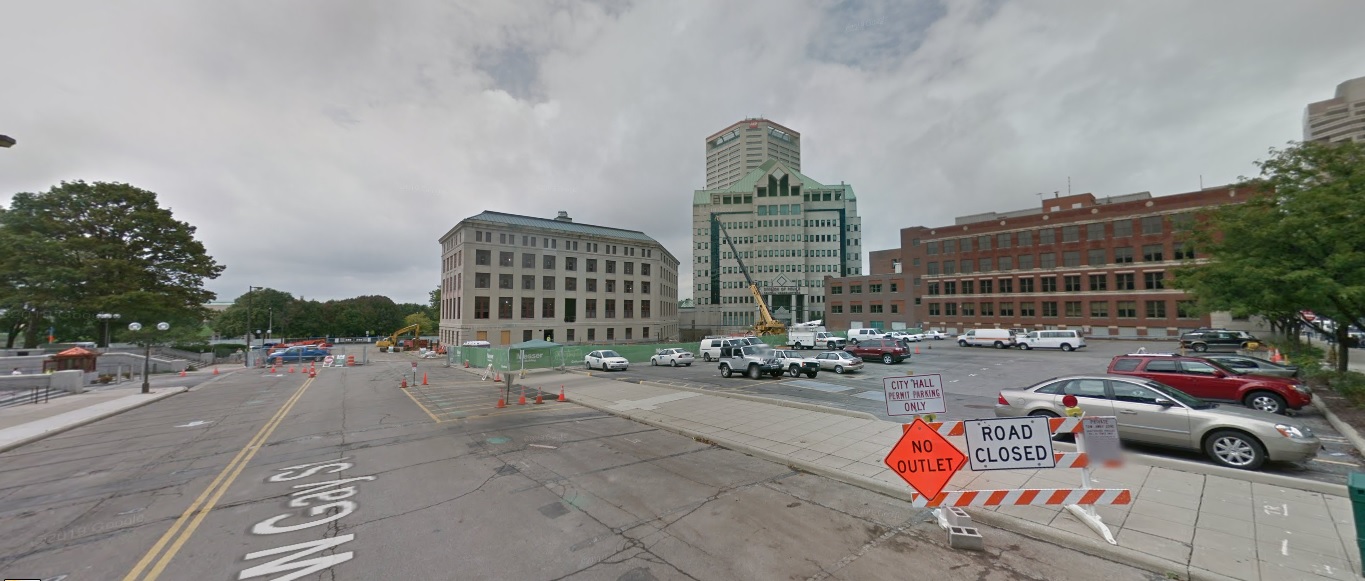
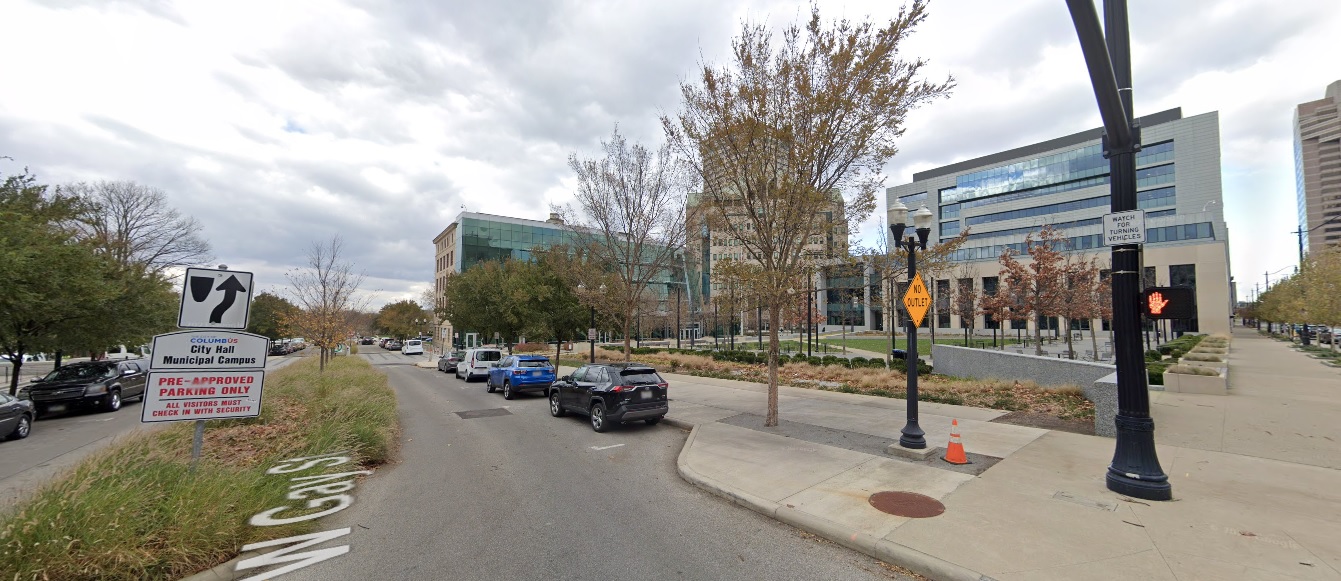
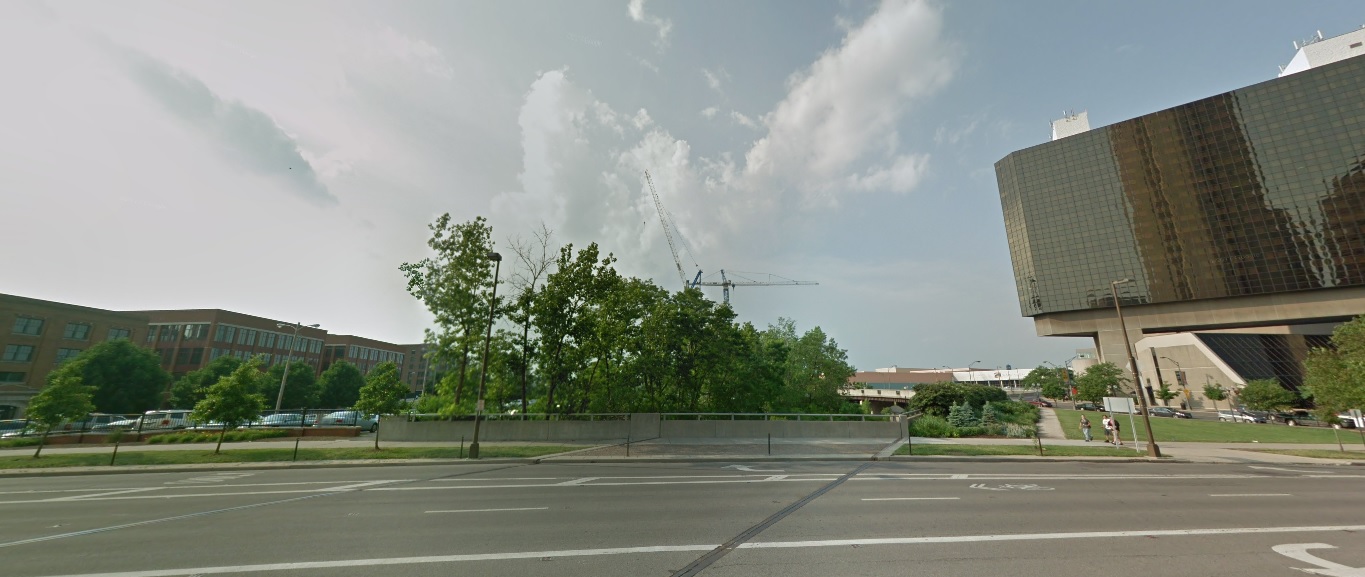
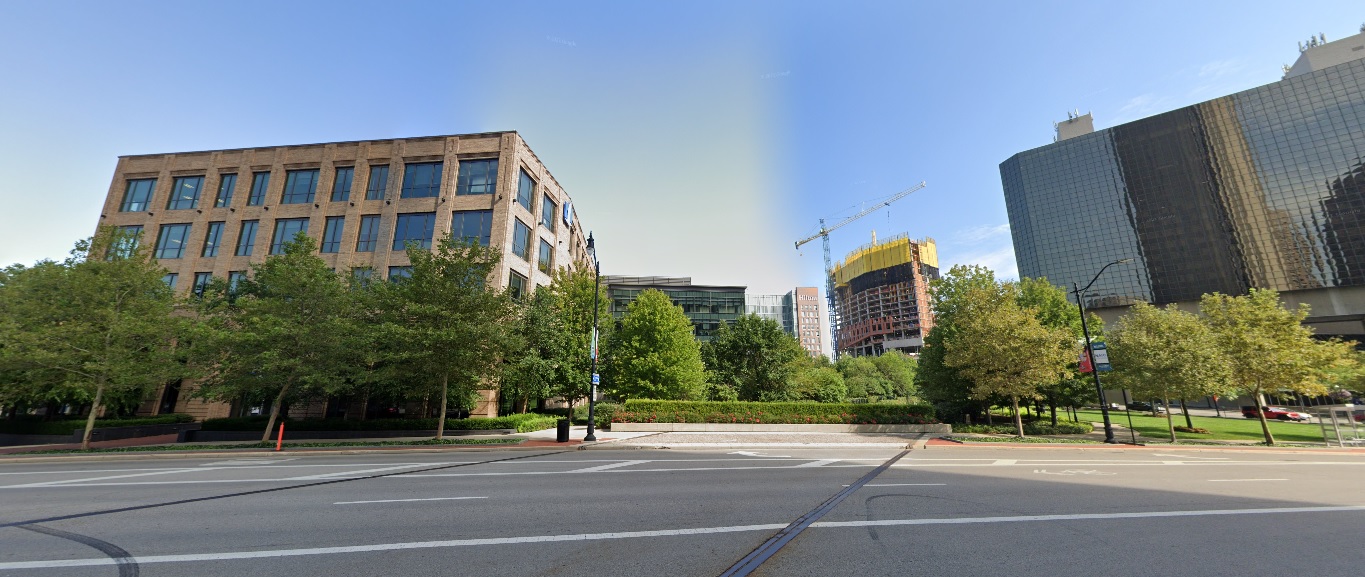
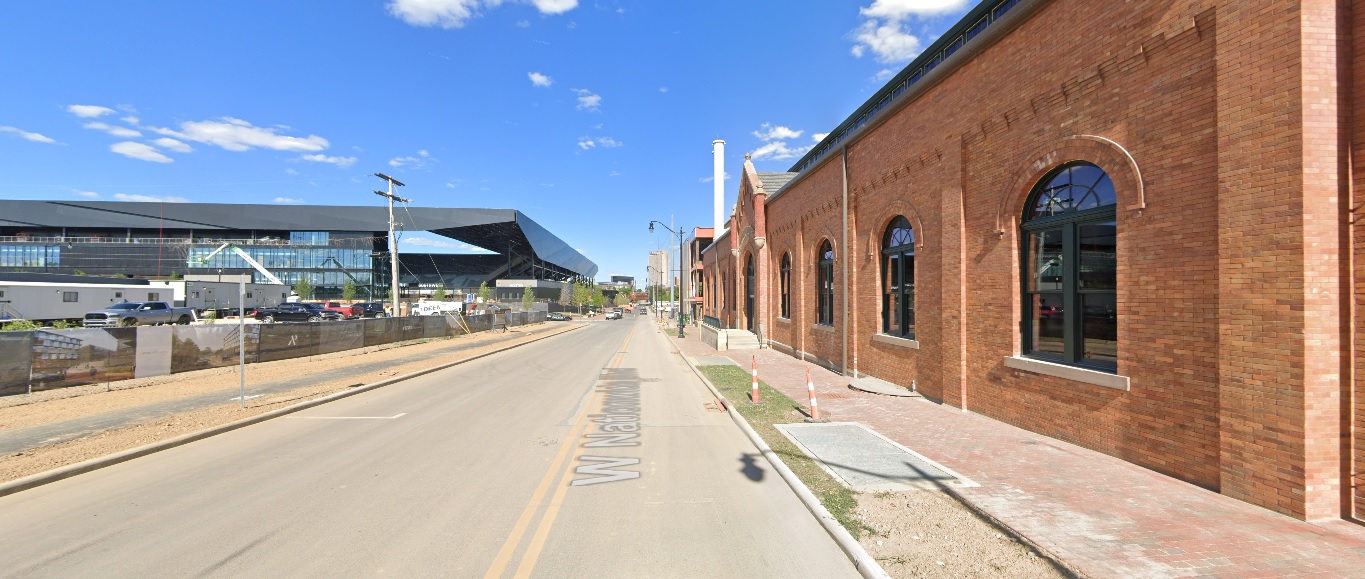
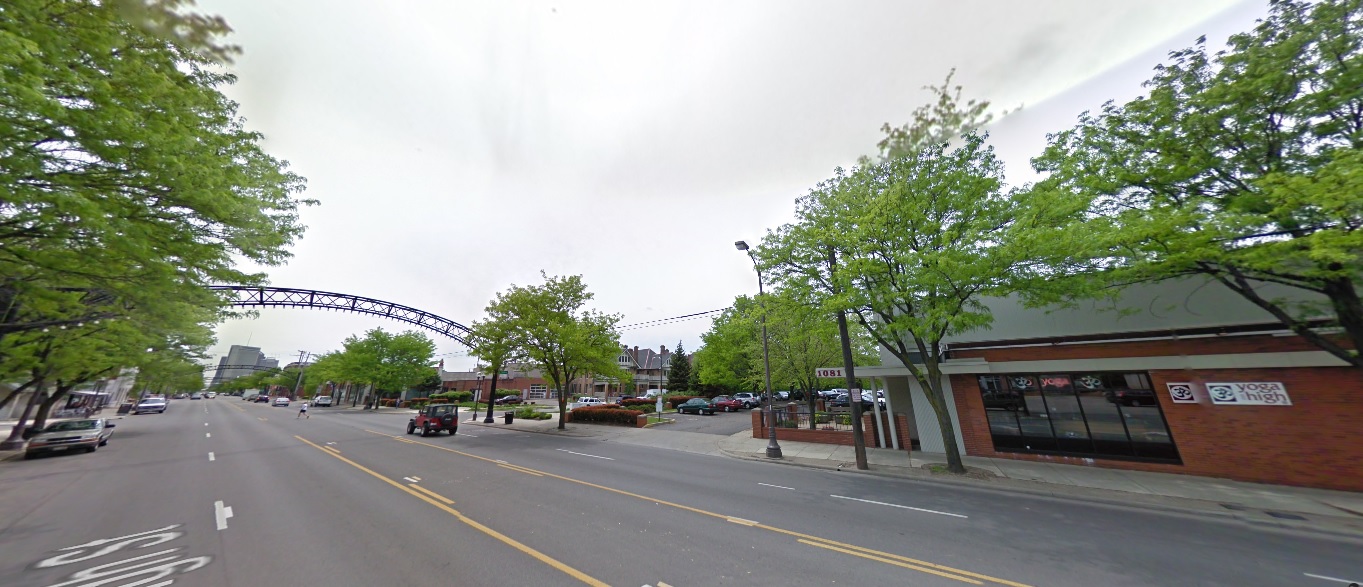
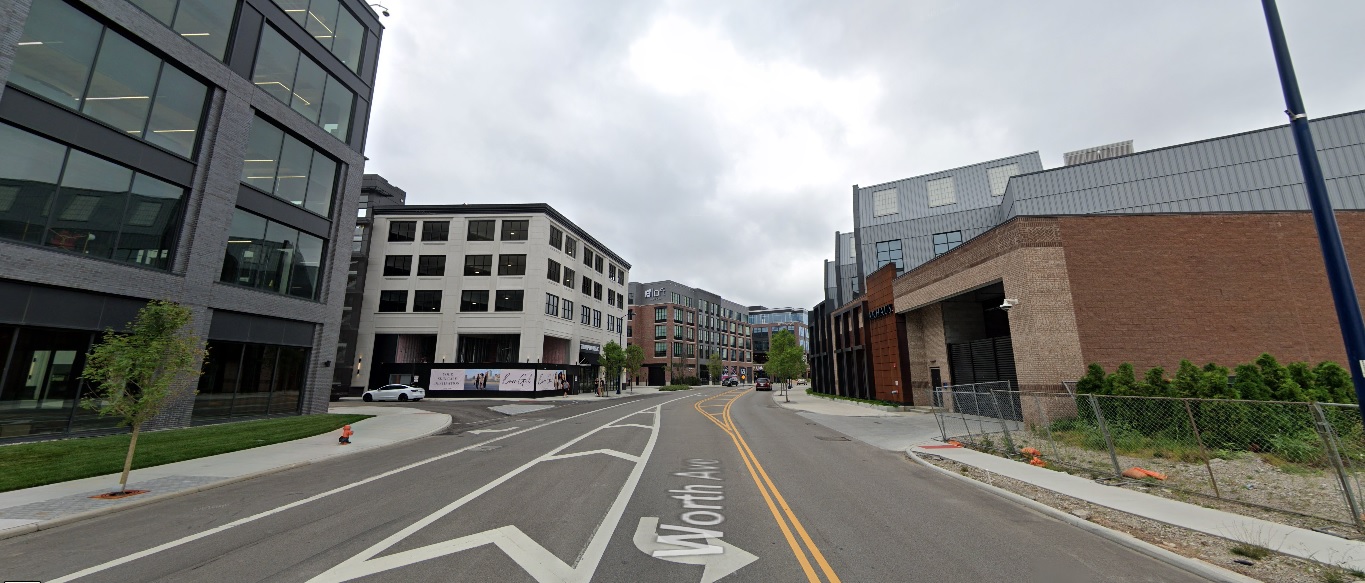
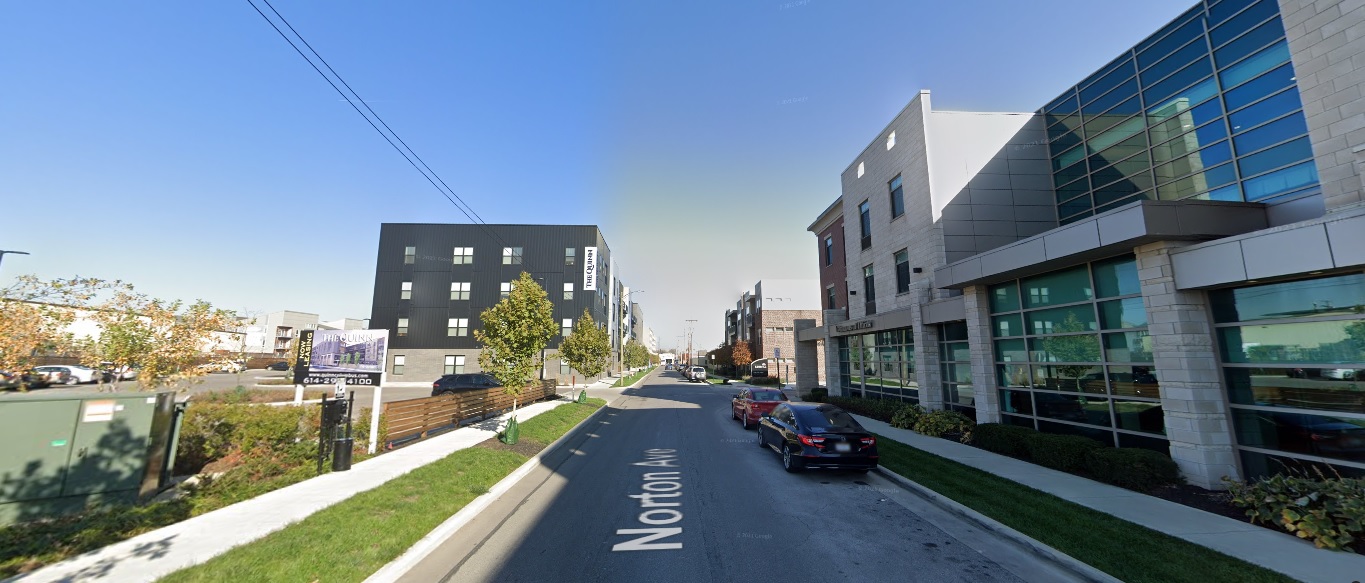
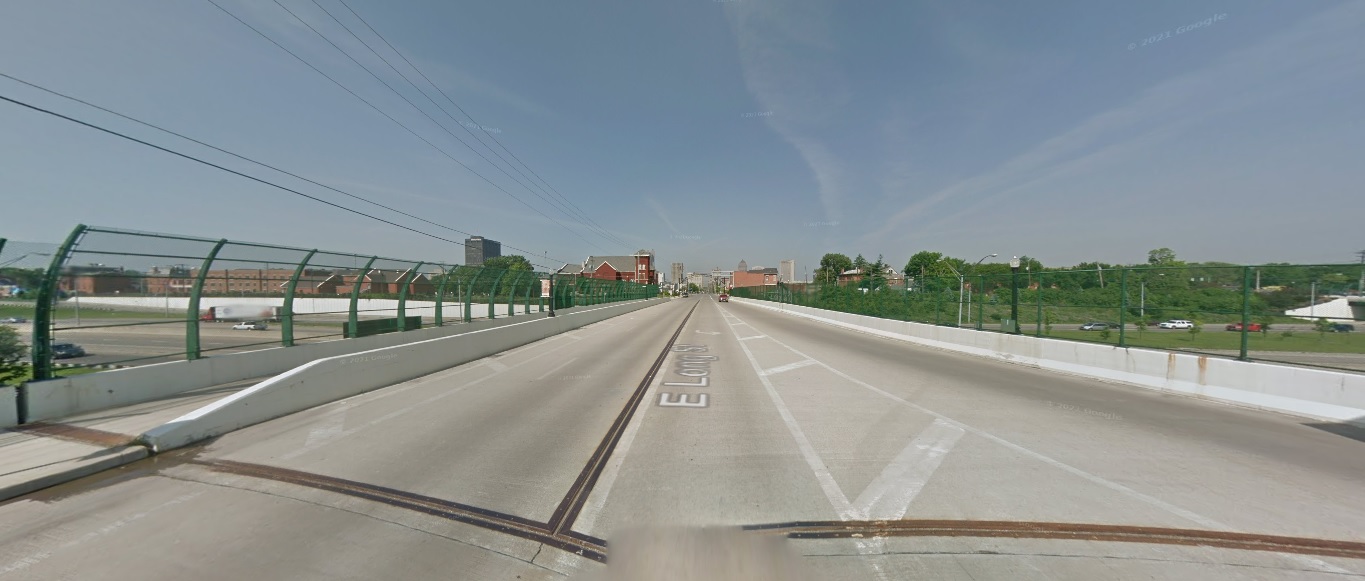
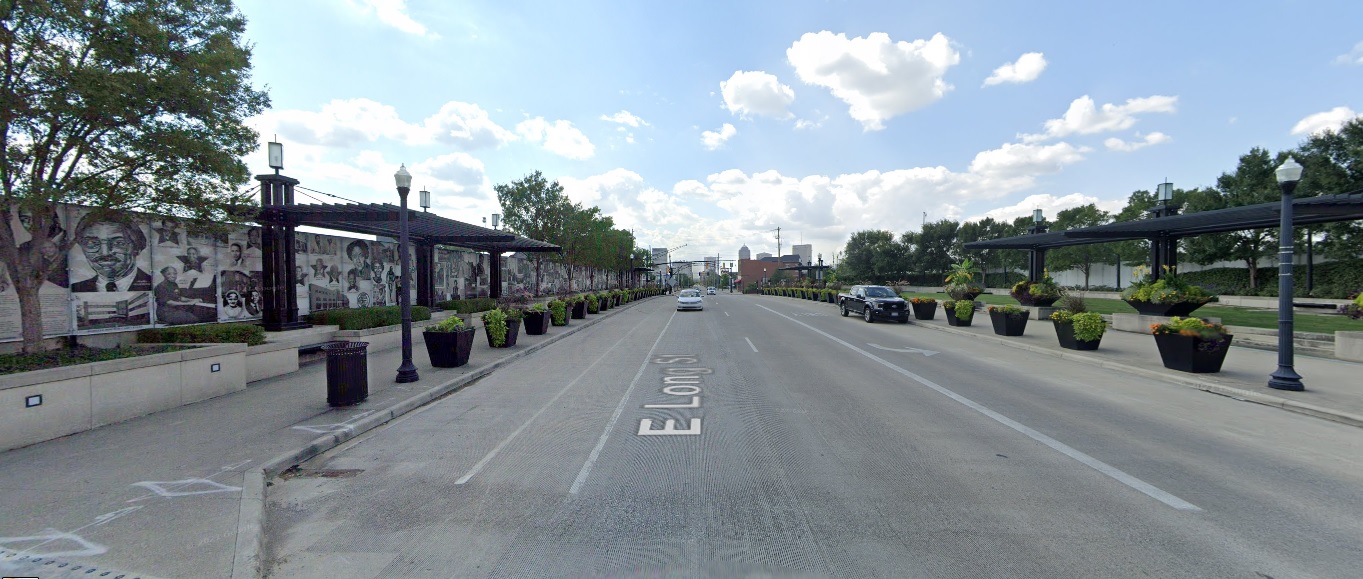
Long Street, looking west at I-71. Before: 2011 After: 2021
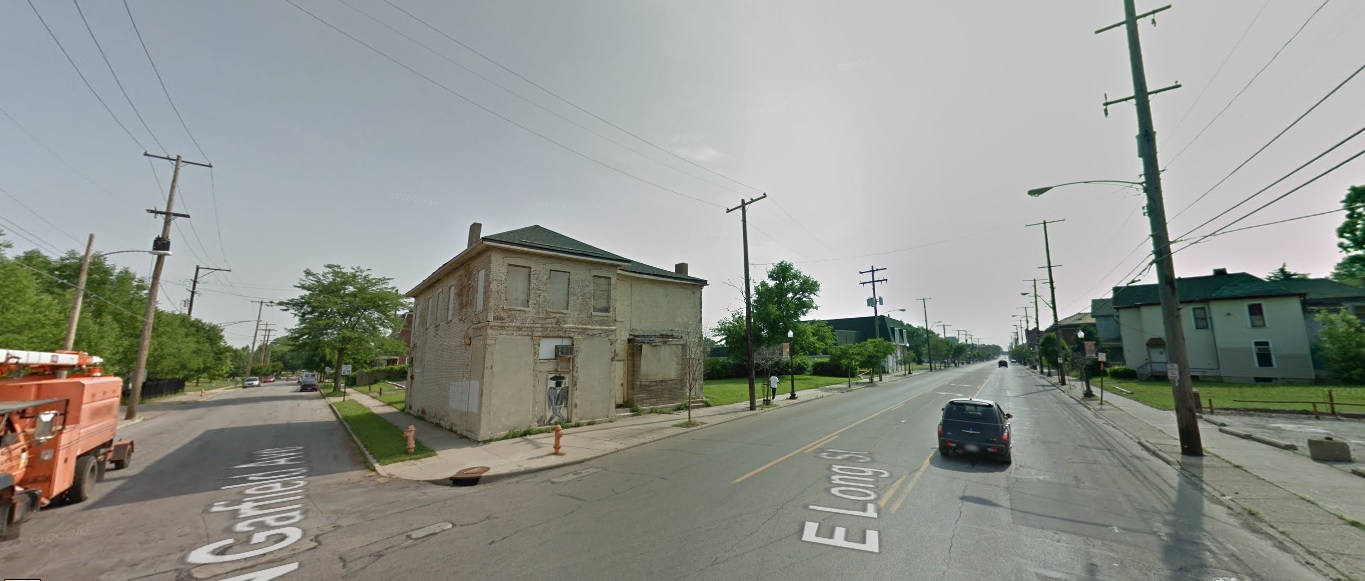
Long Street, looking northeast at Garfield Avenue. Before: 2011 After: 2021
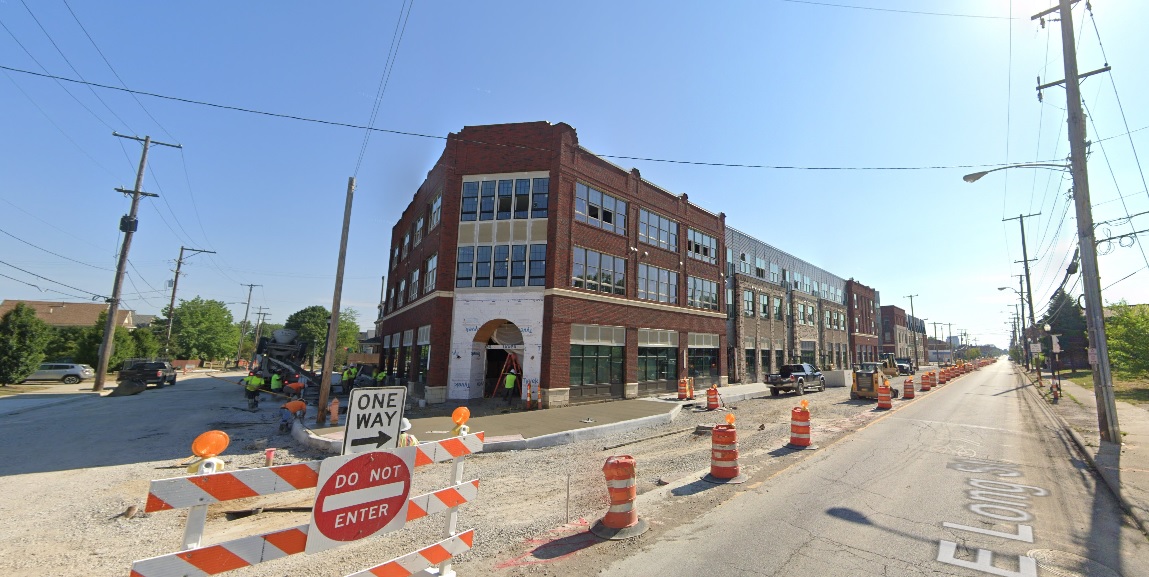
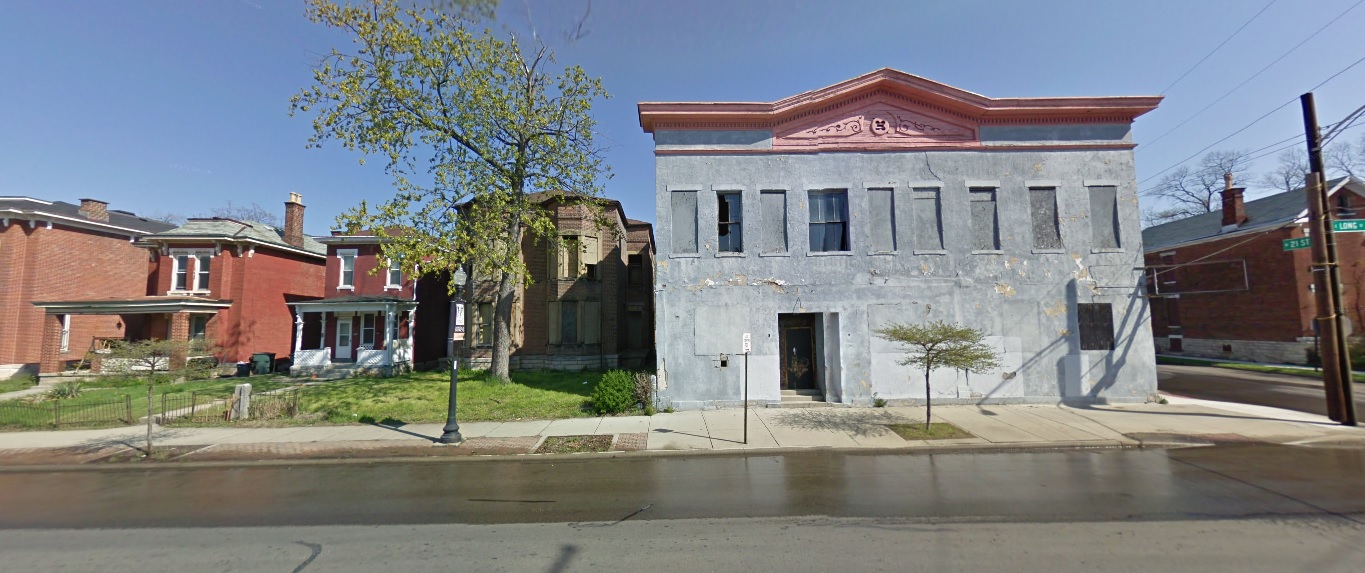
Long Street, looking north just west of 21st Street. Before: 2011 After: 2021
West Side
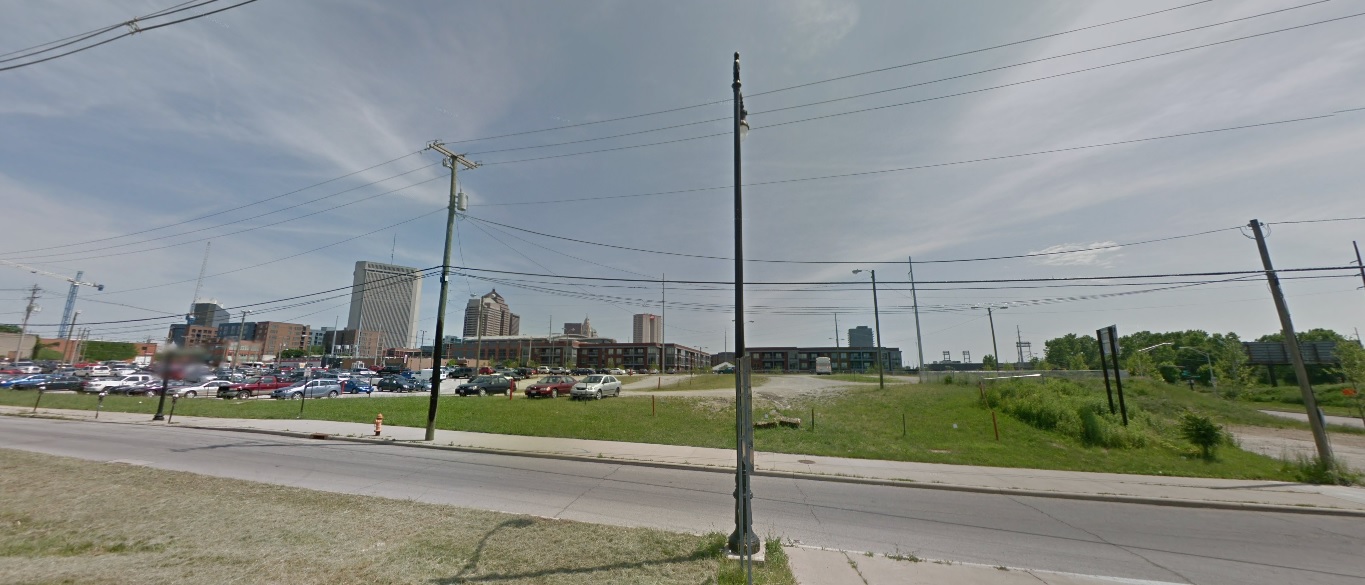
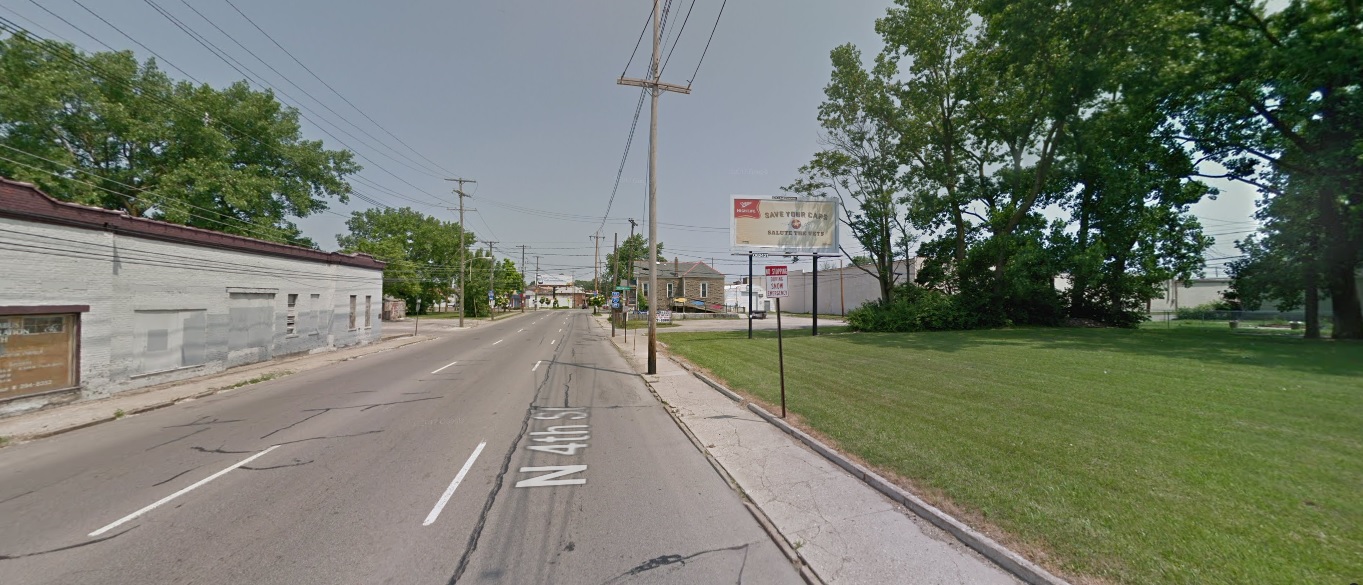
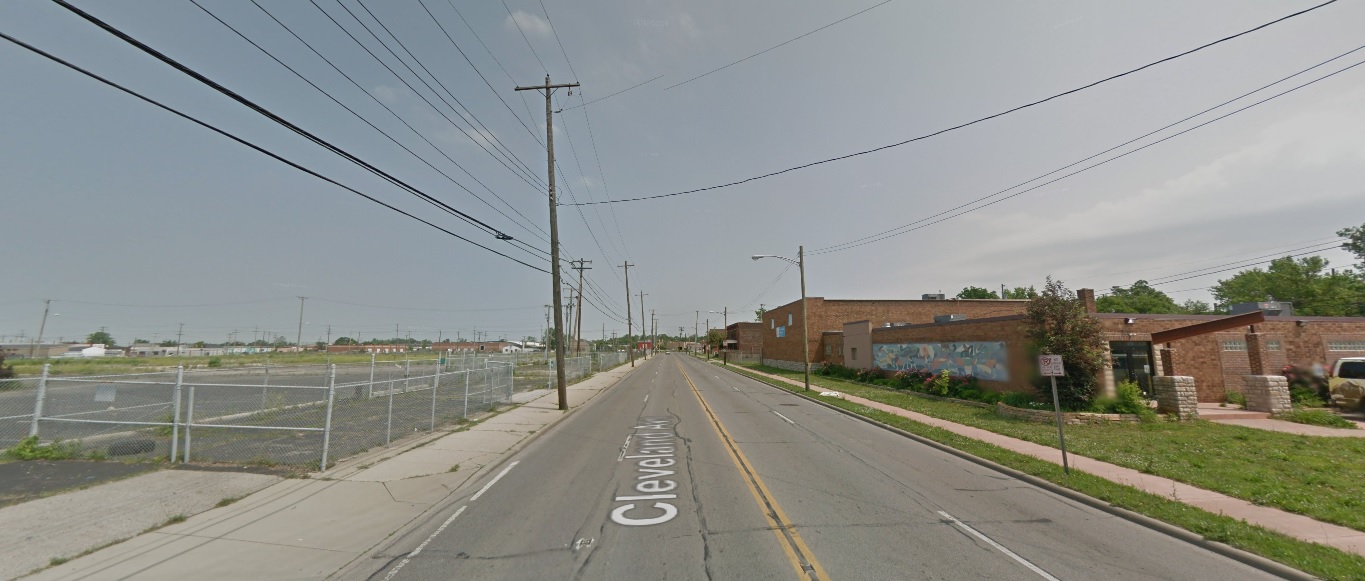
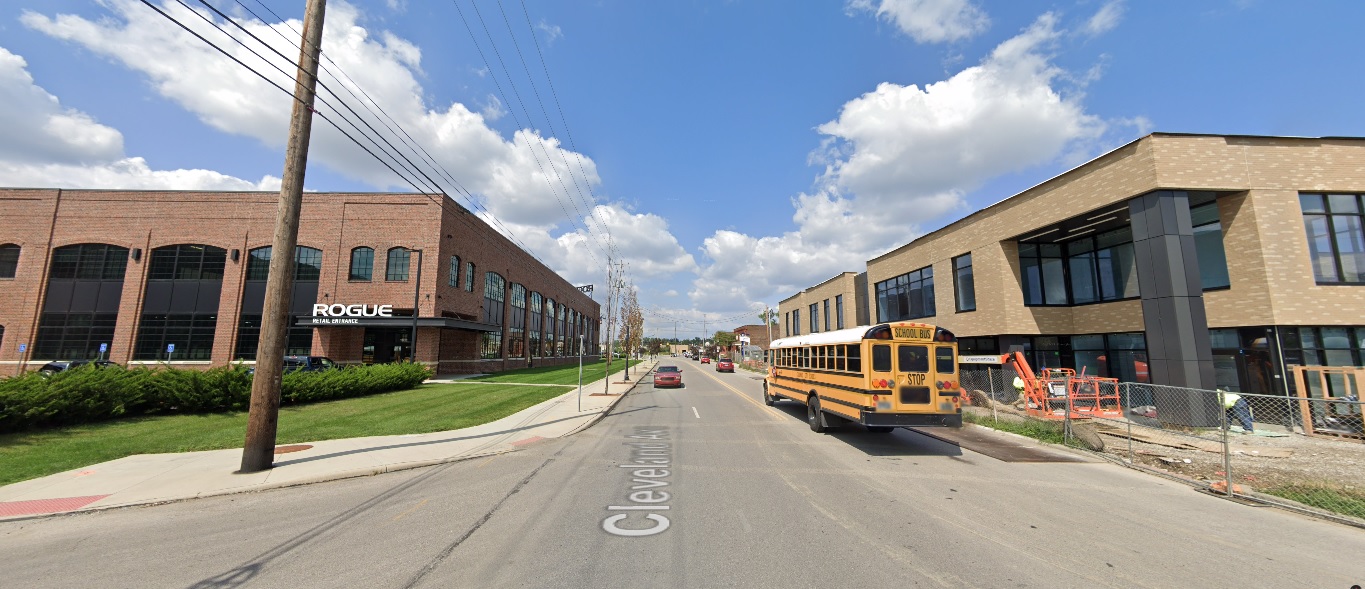
Georgesville Road, looking east south of Broad Street. Before: 2011 After: 2021
North Side
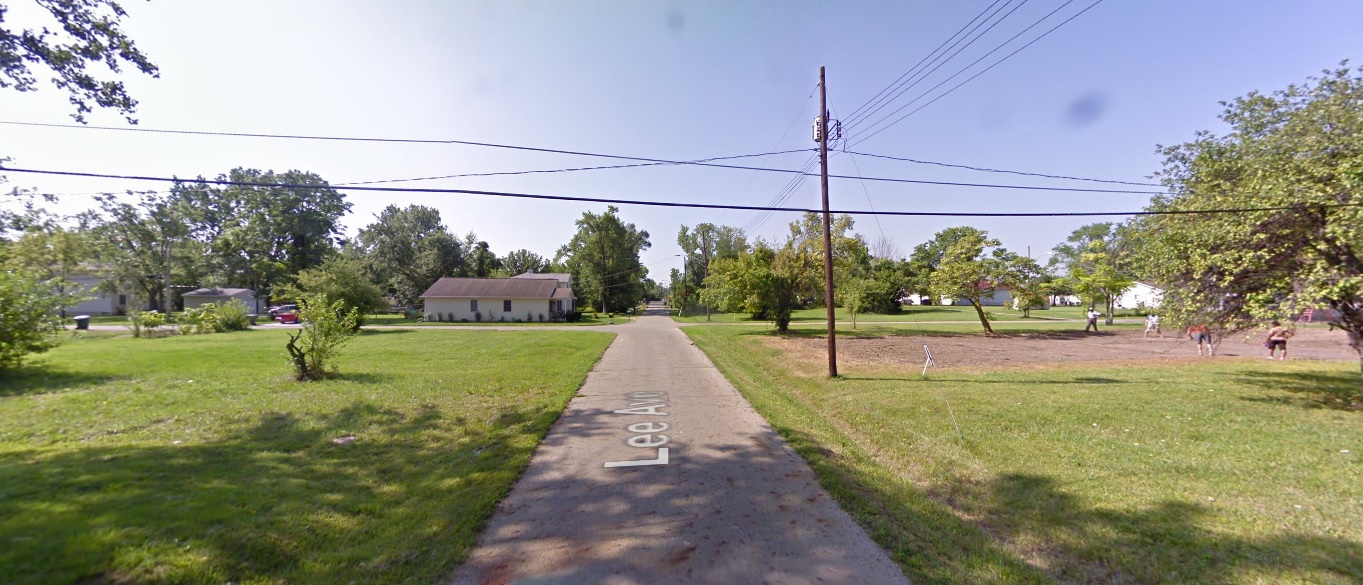
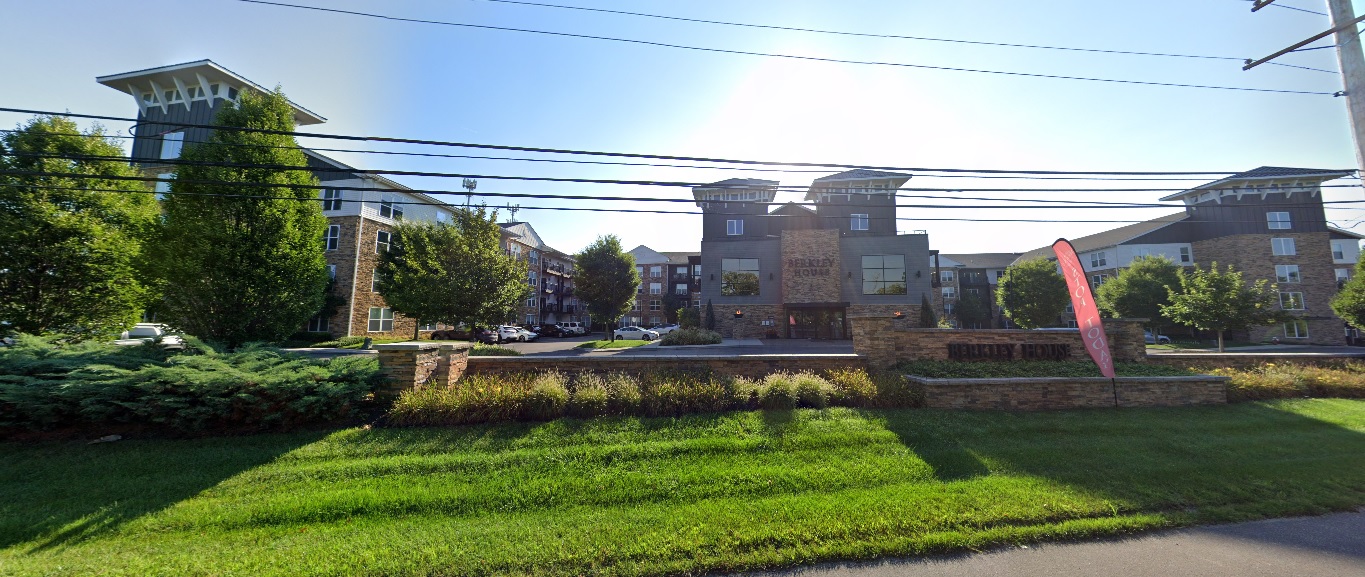
Wakeford Street, looking west from Olentangy River Road. Before: 2011 After: 2021
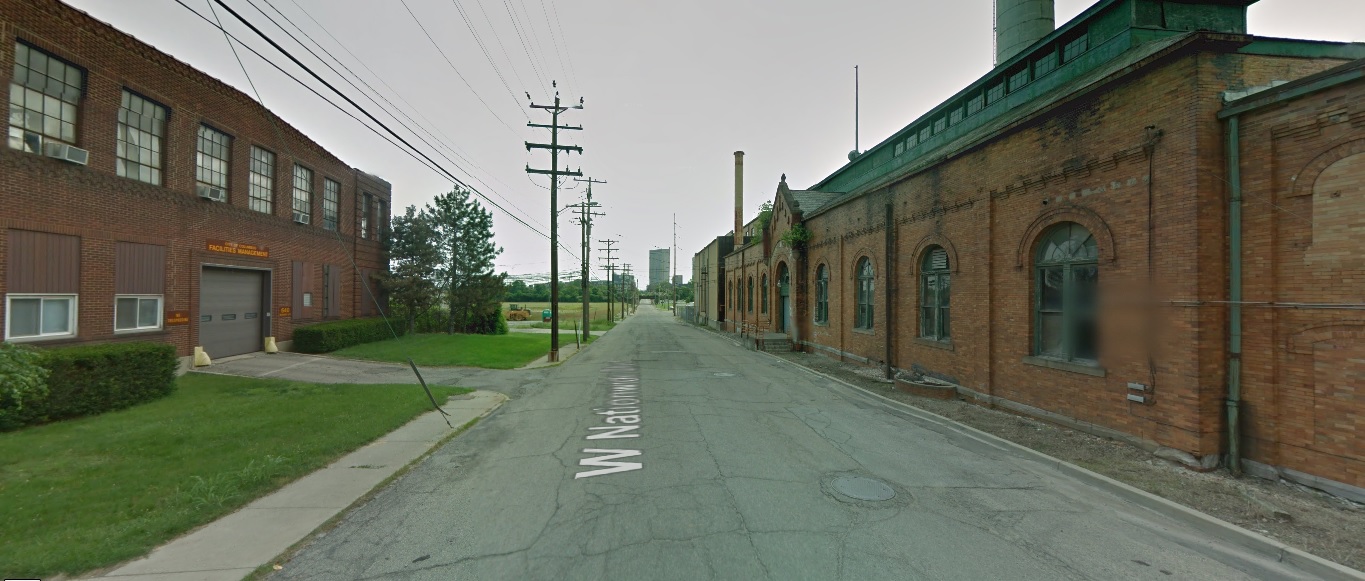
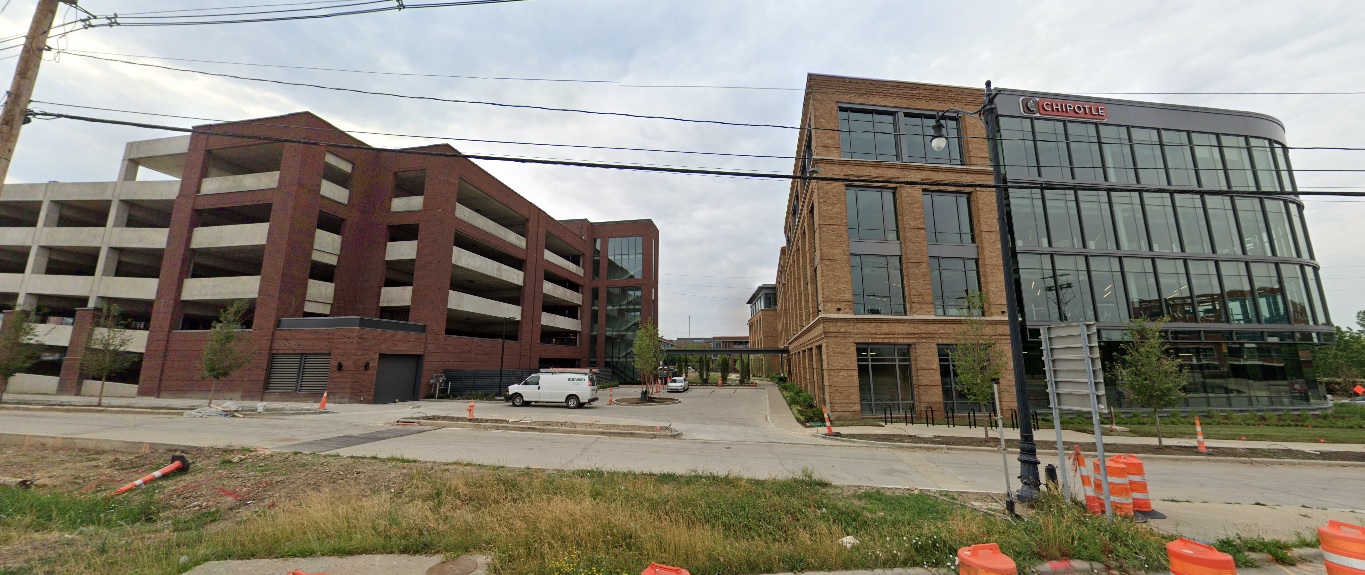
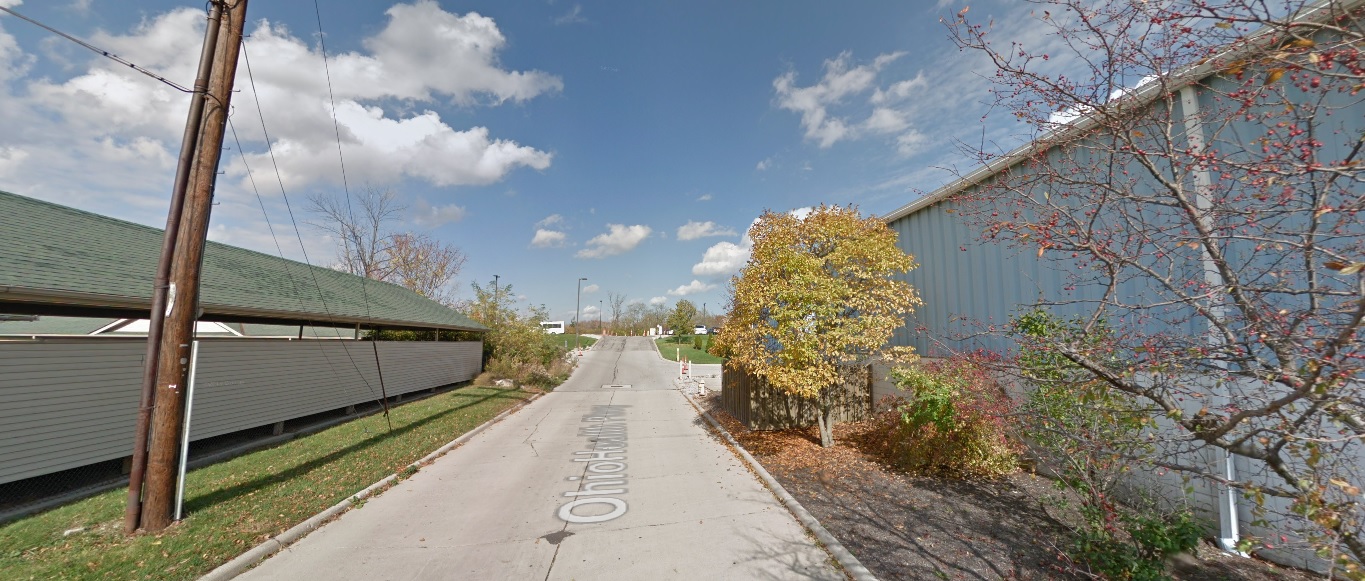
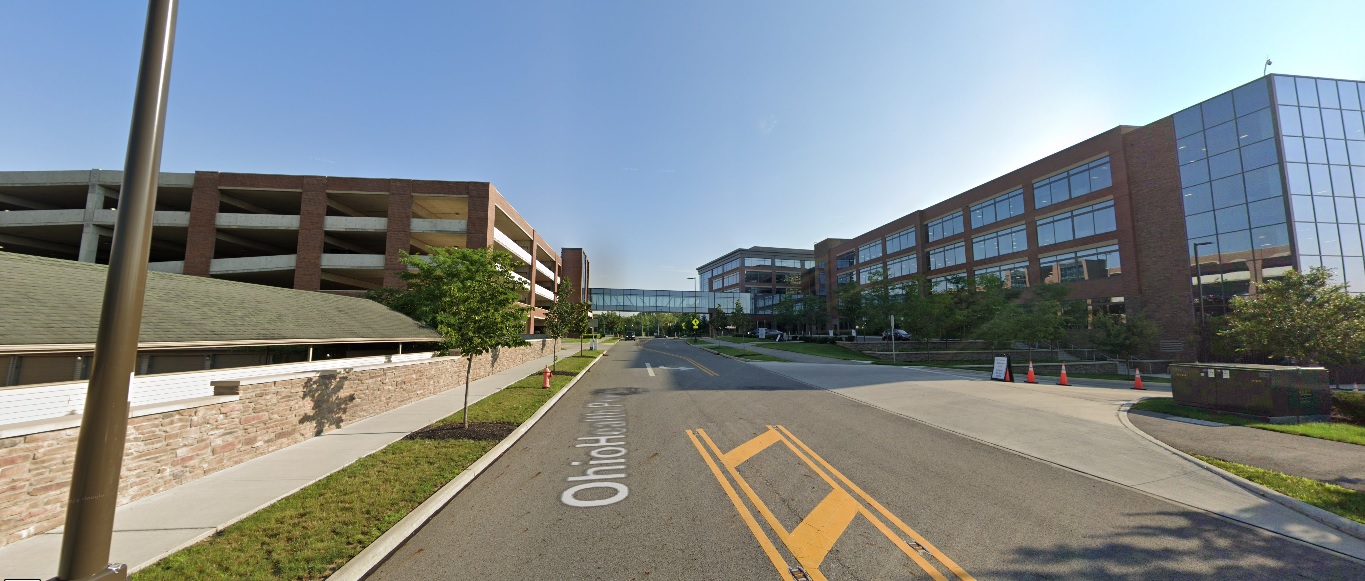
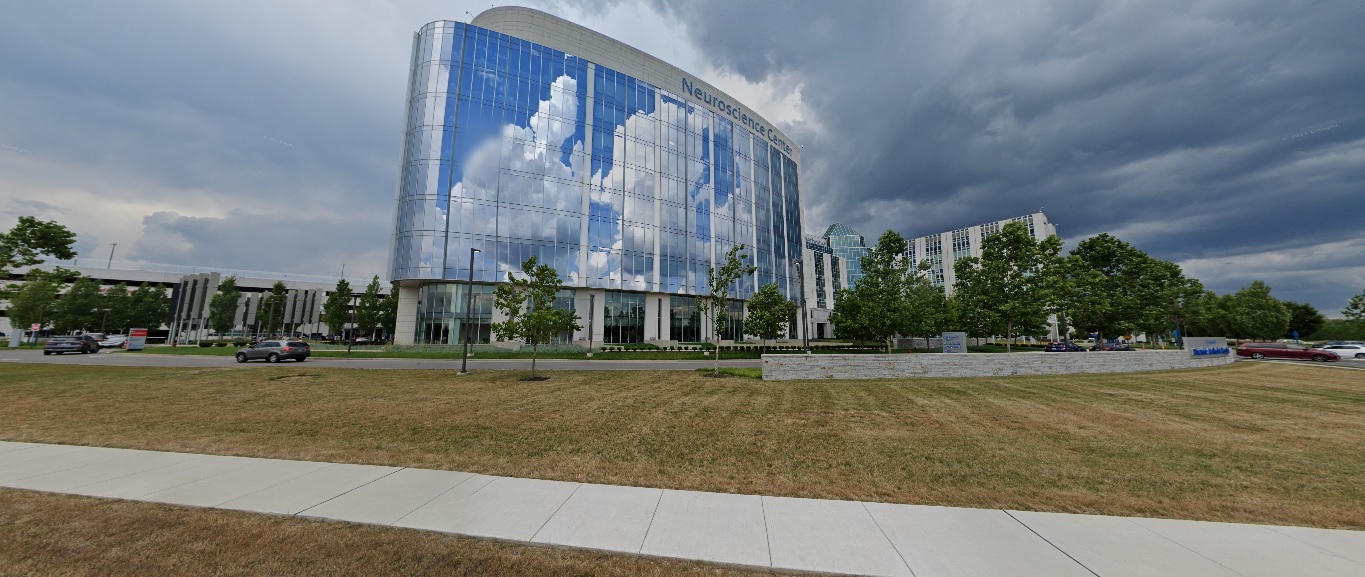
Ohio Health Parkway, looking north from Healthy Community Way. Before: 2015 After: 2021
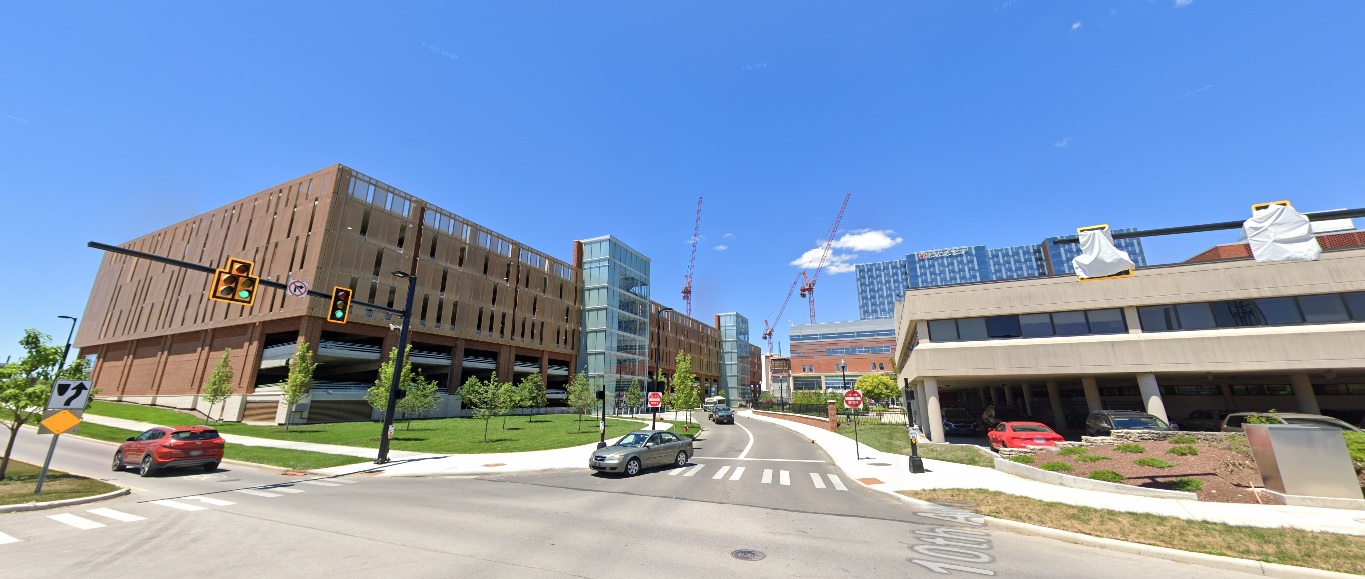
East North Broadway, looking north at 315. Before: 2011 After: 2021
Grandview Heights
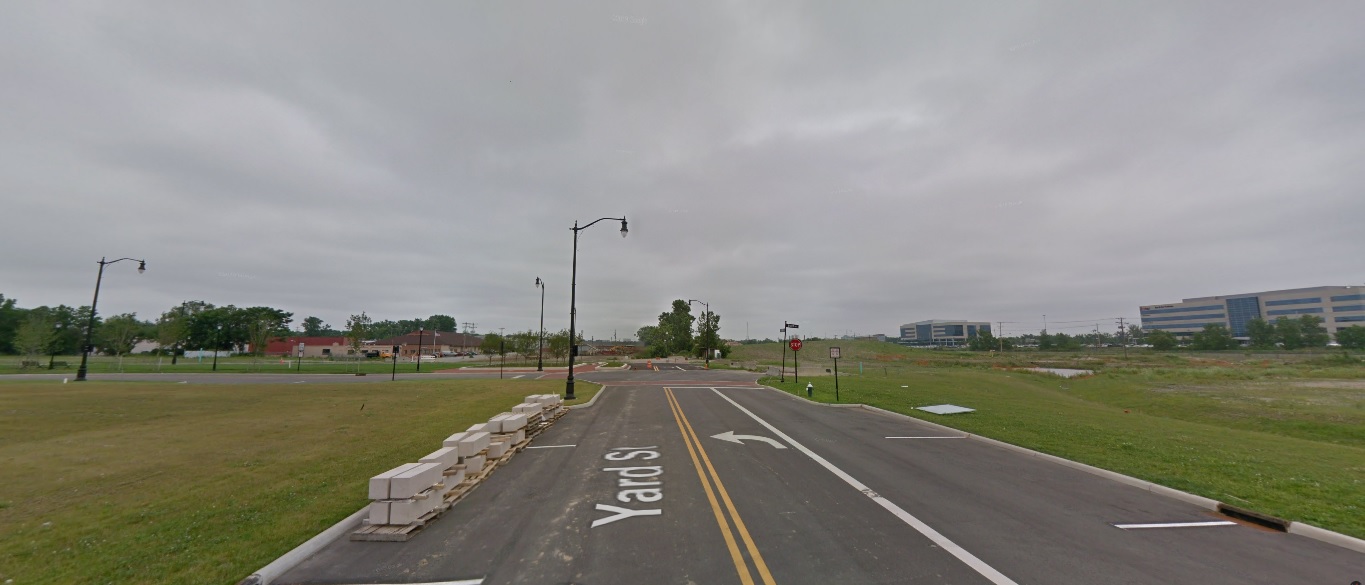
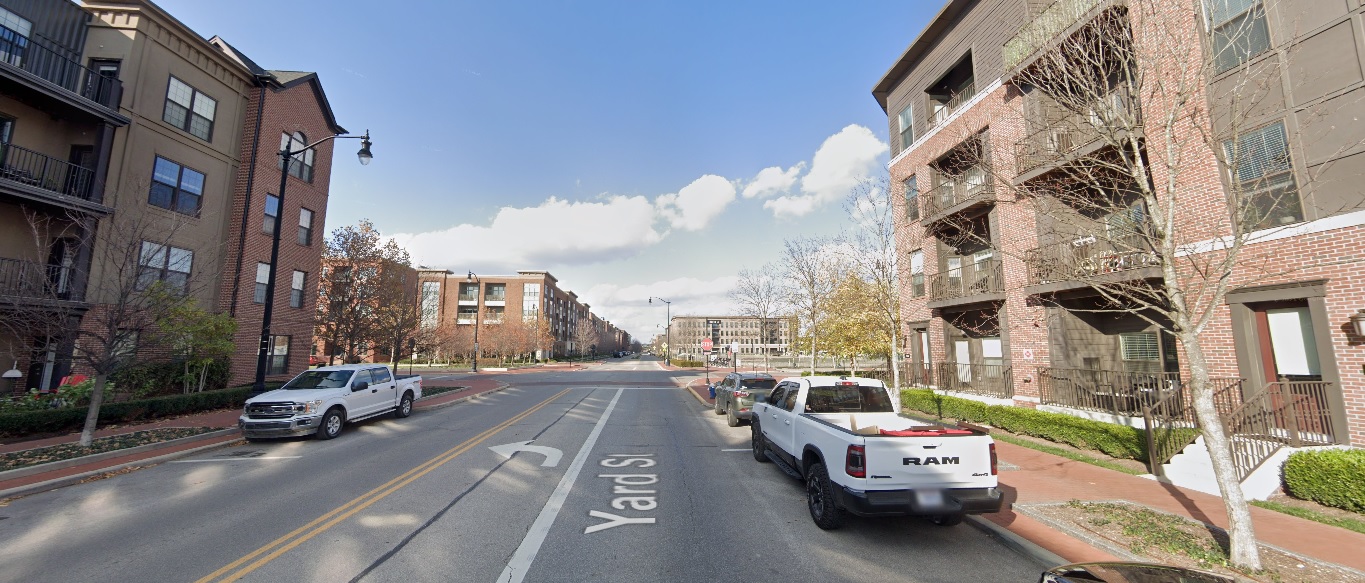
Yard Street, looking north from just south of Burr Avenue. Before: 2011 After: 2020
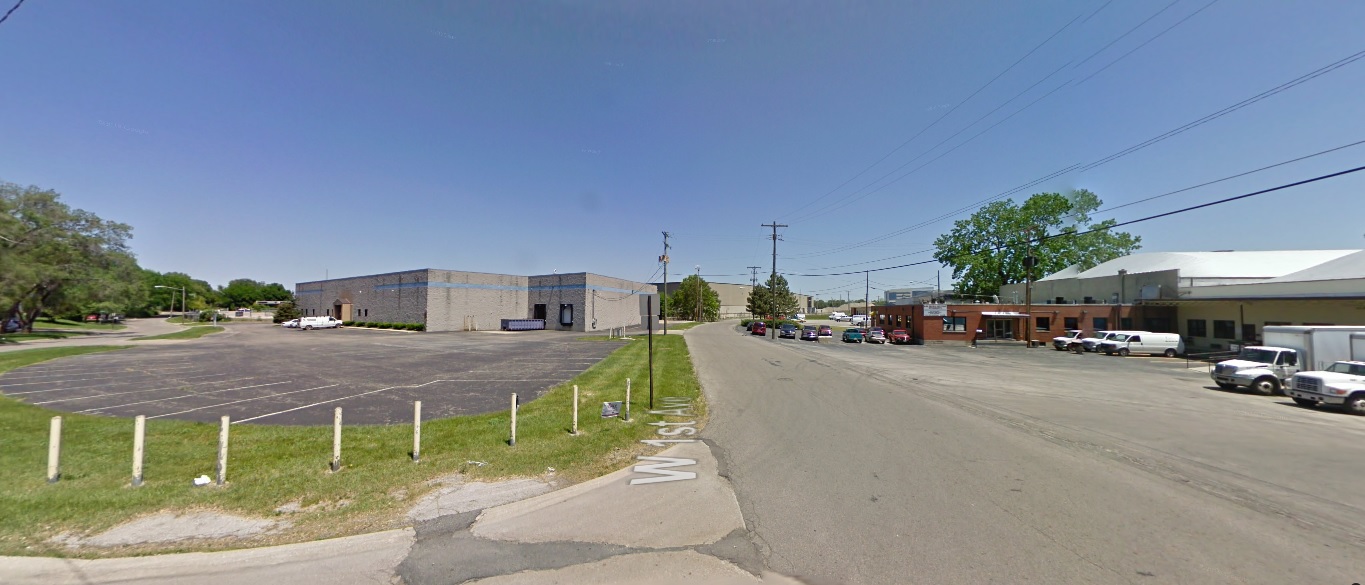
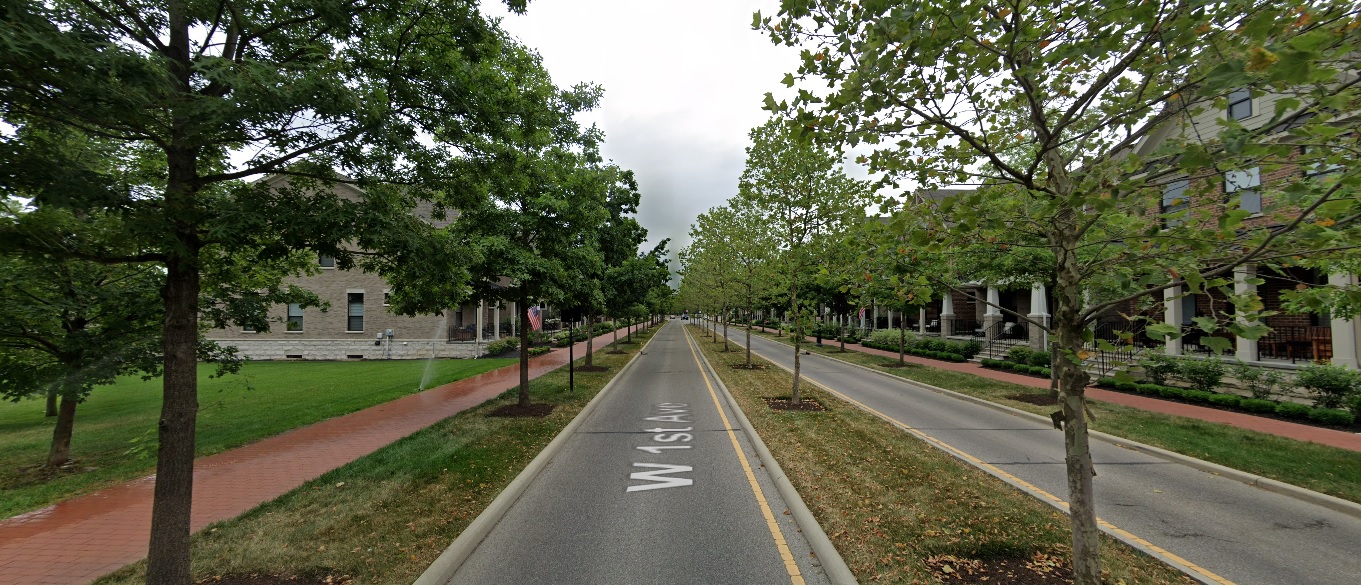
First Avenue, looking northeast at Edgehill Road. Before: 2012 After: 2021
Dublin
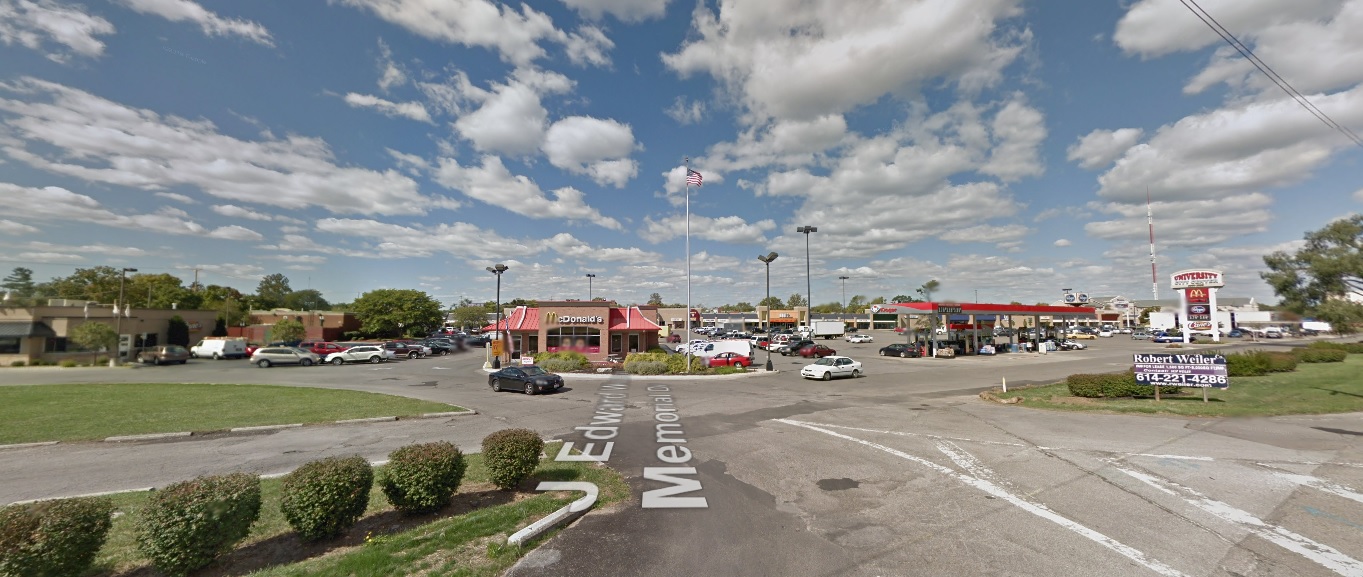
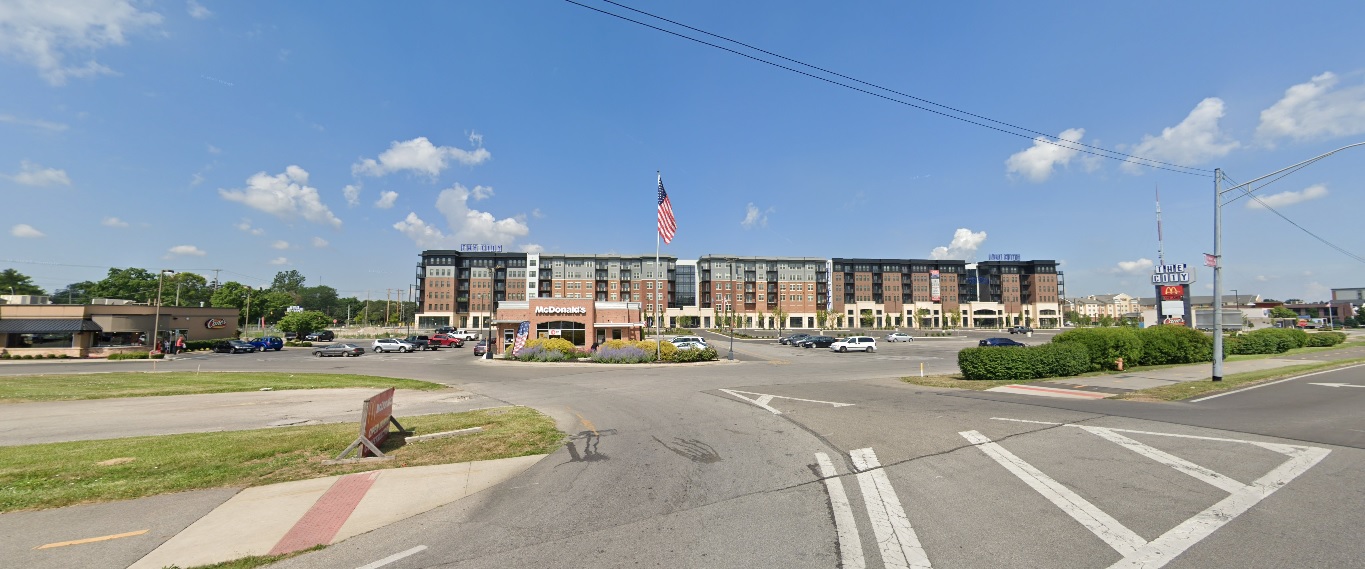
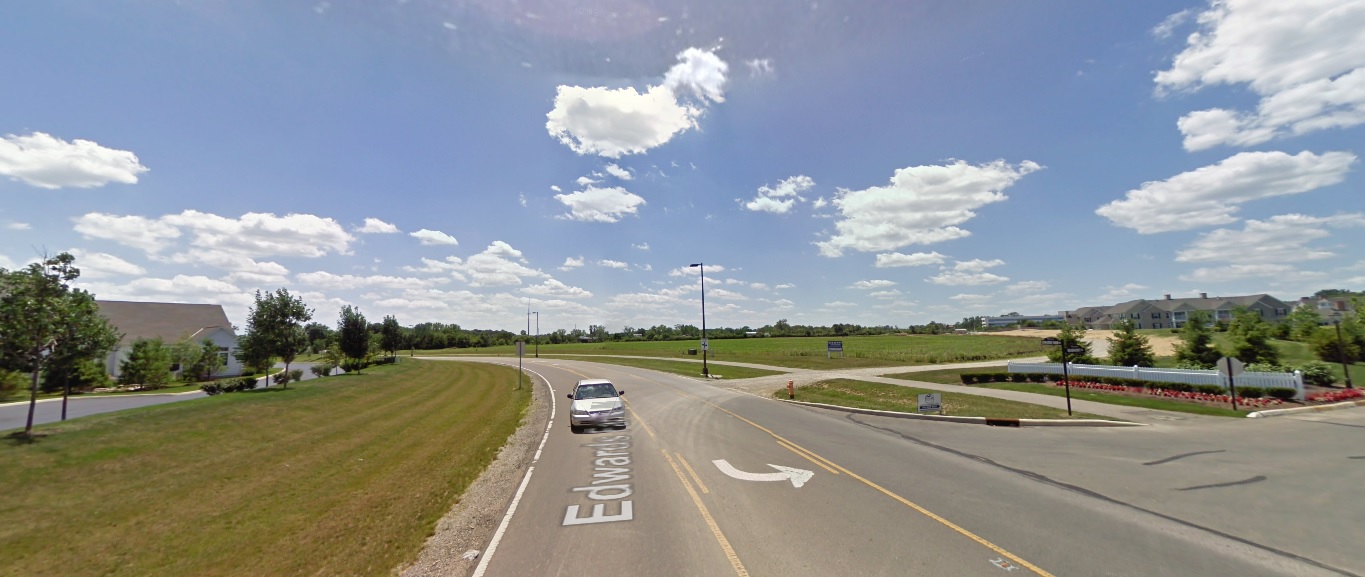
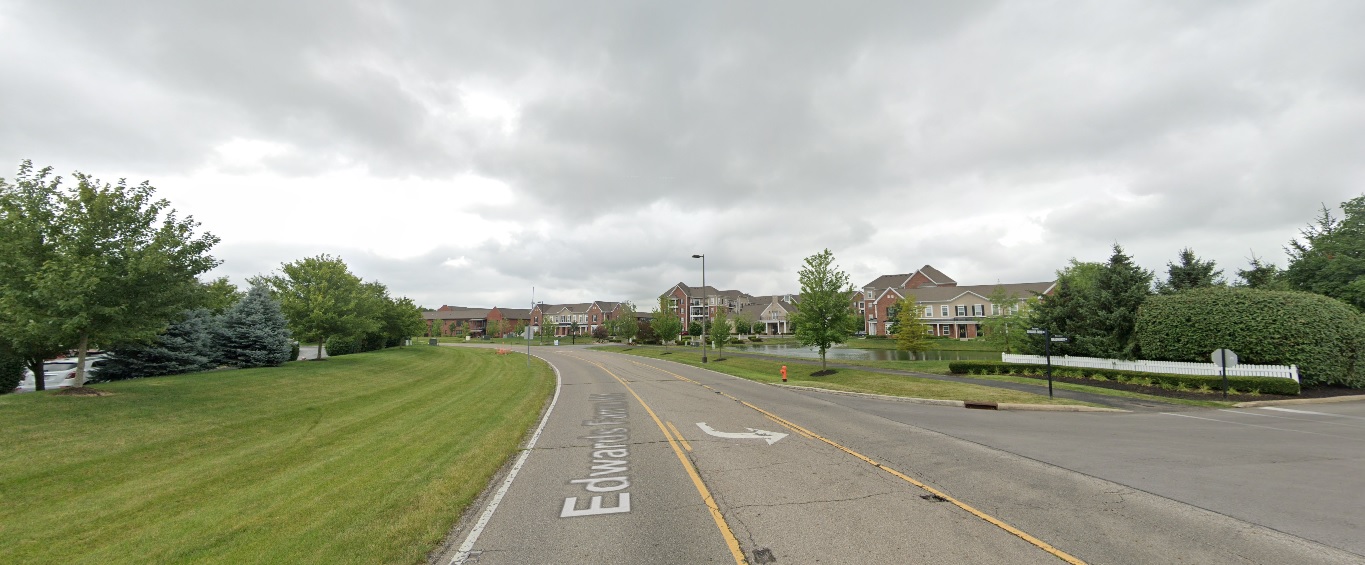
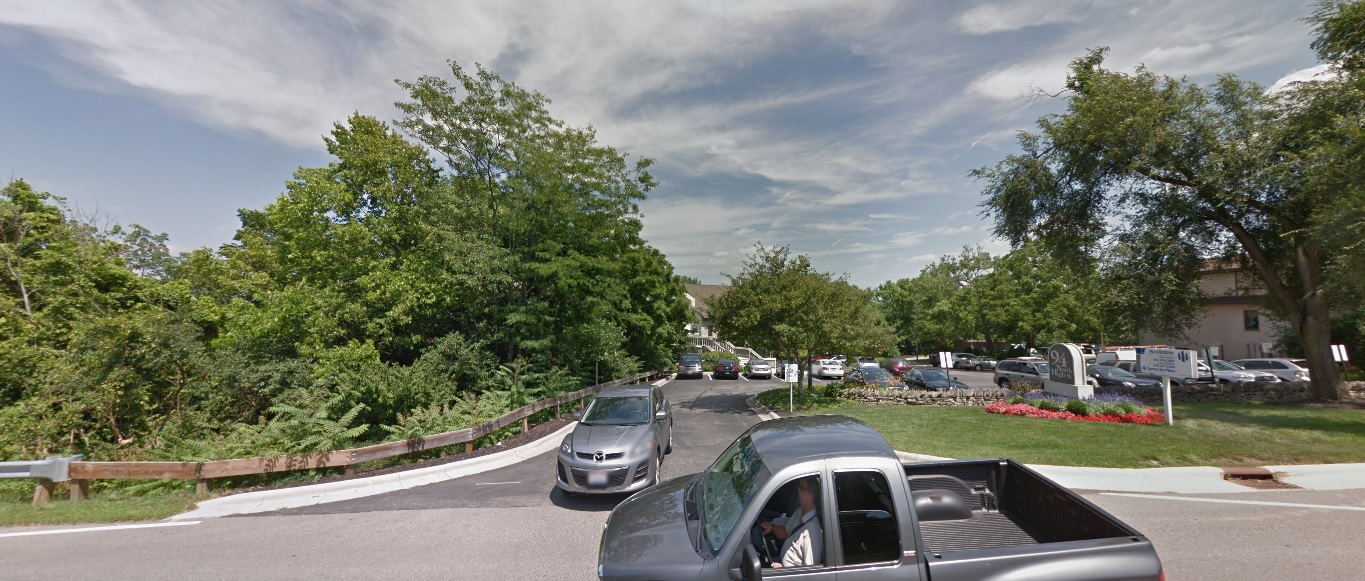
Edwards Farms Drive, looking south at Frawley Drive. Before: 2011 After: 2021
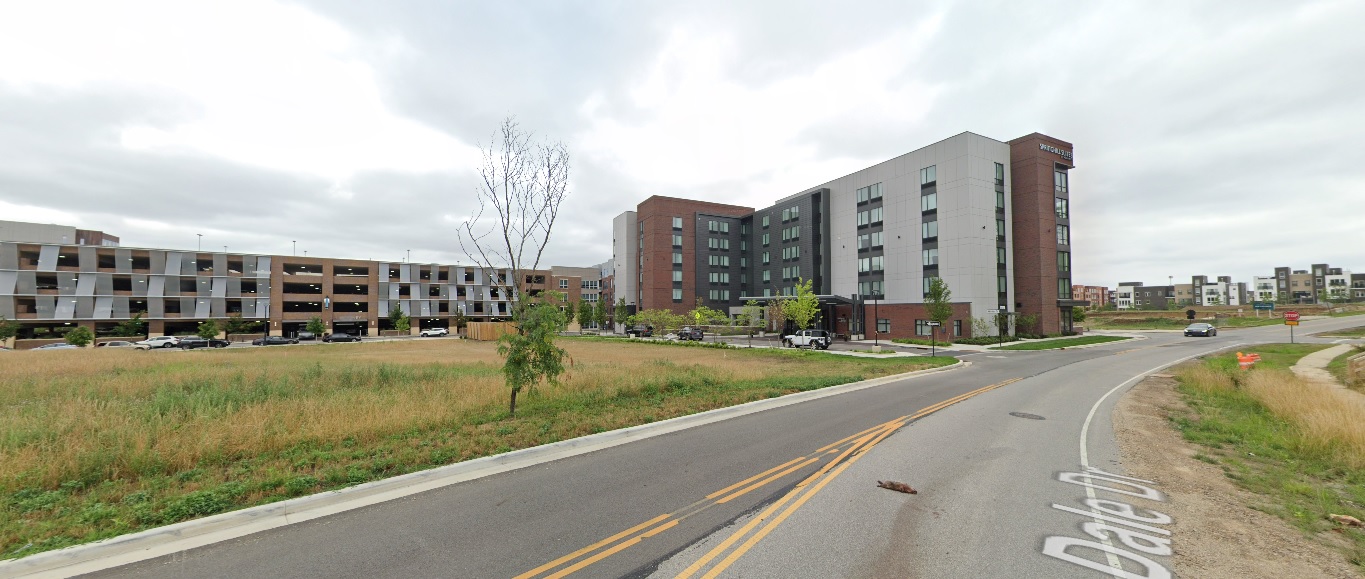
Dale Drive, looking northwest north of Banker Drive. Before: 2011 After: 2021
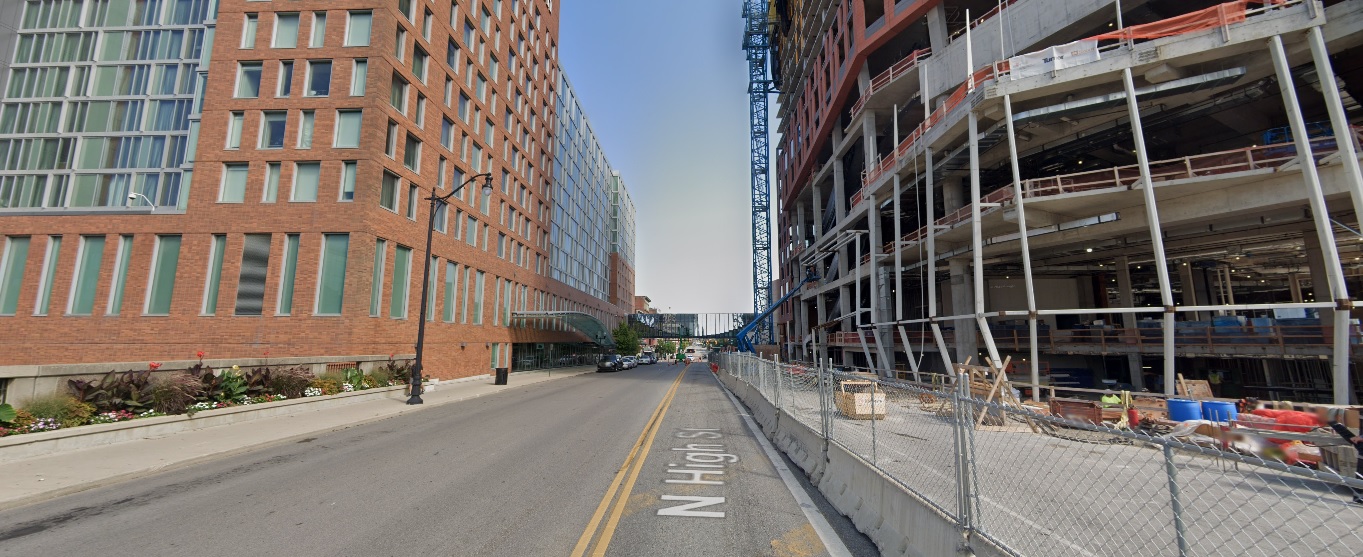
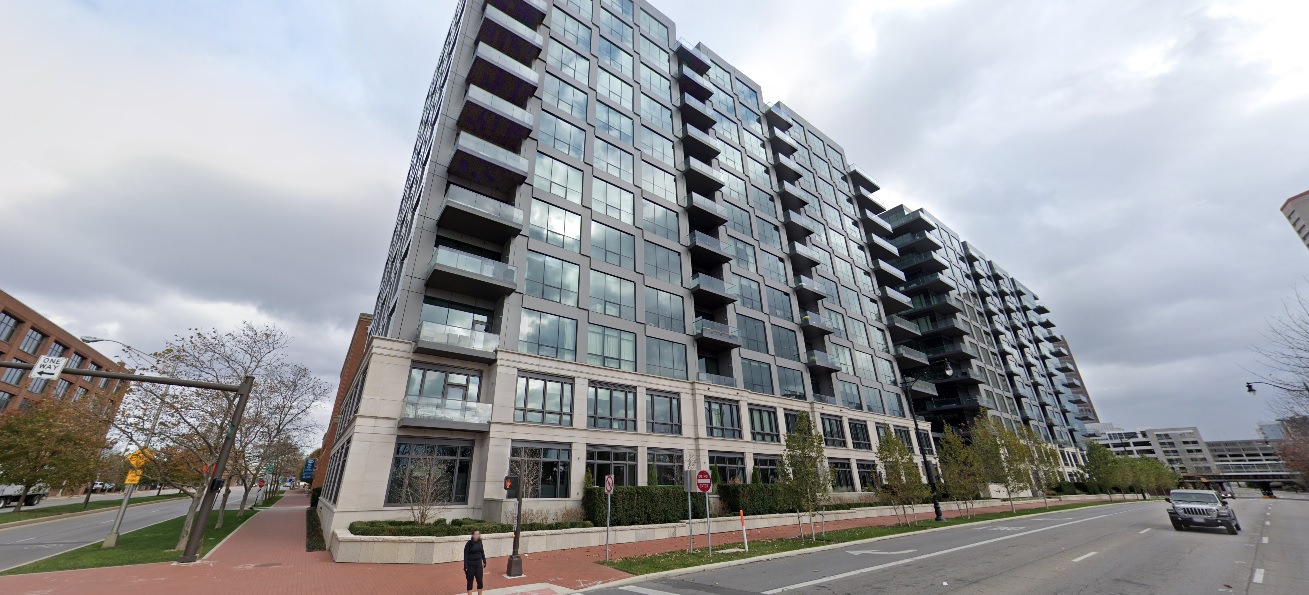
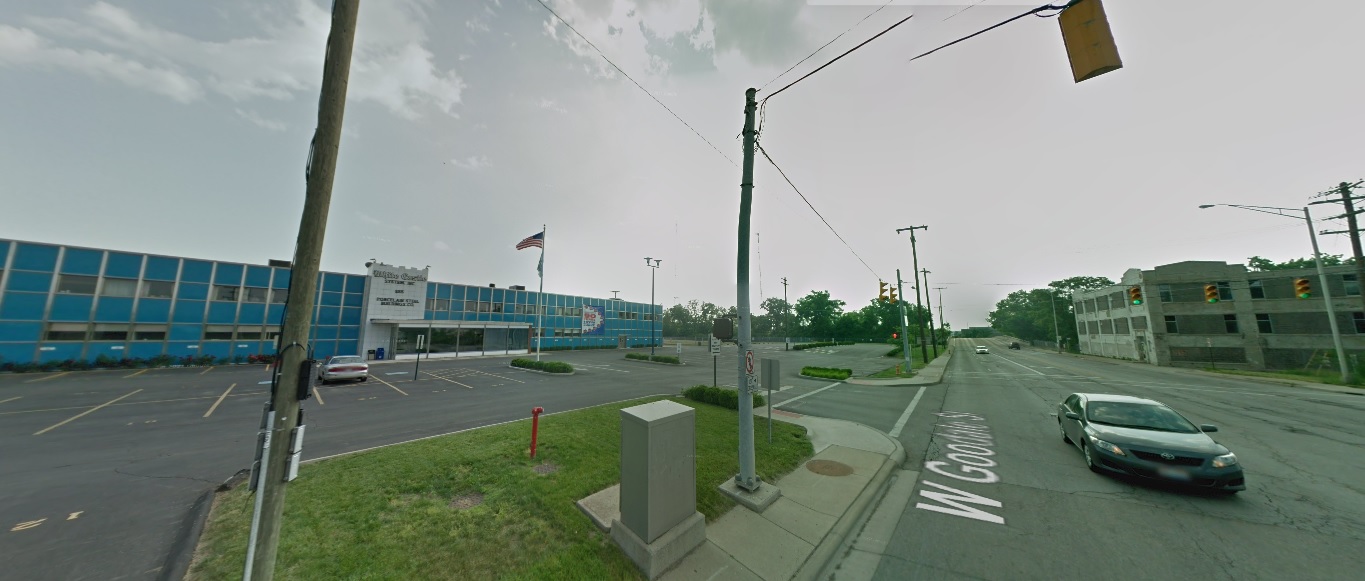
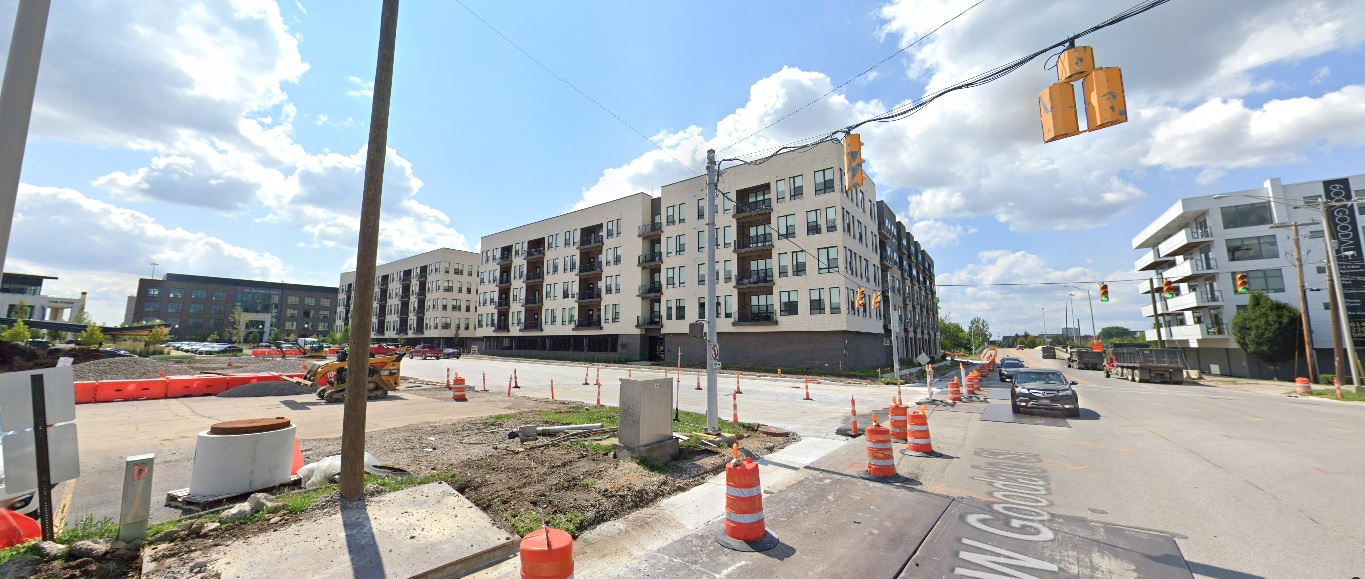
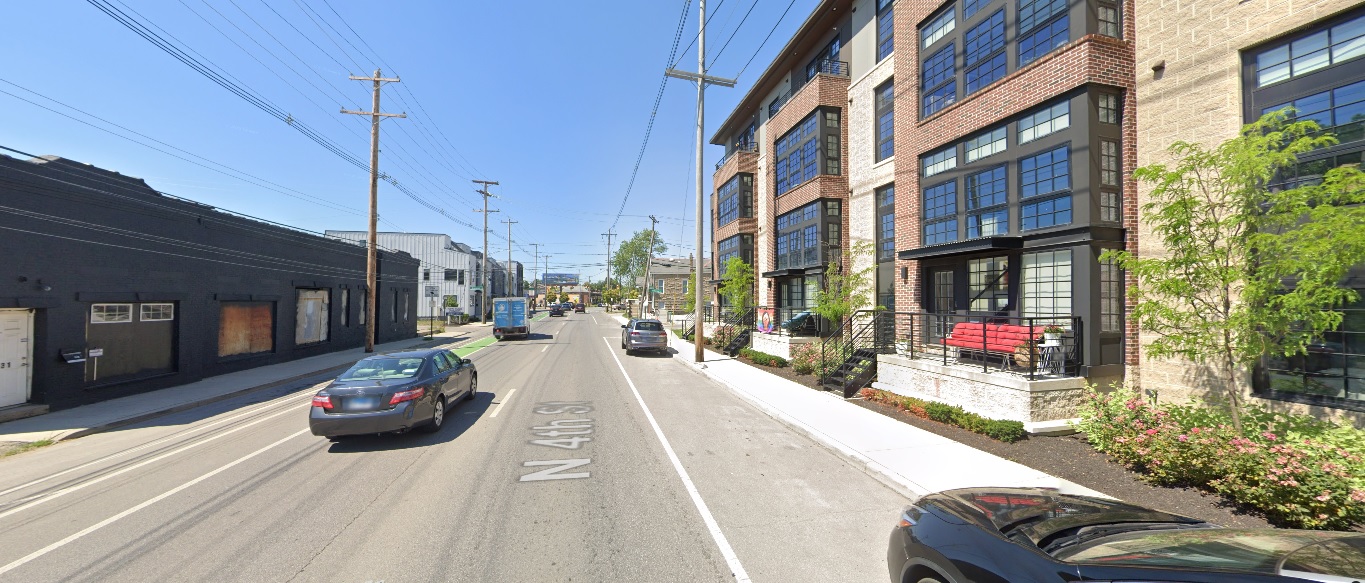
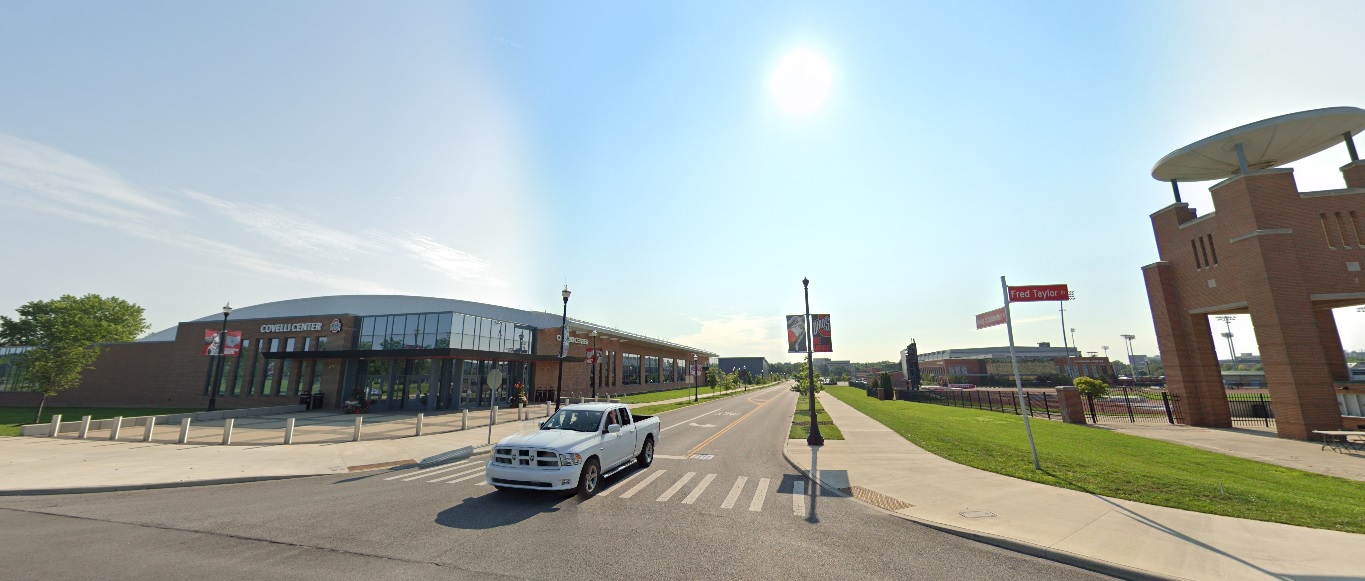
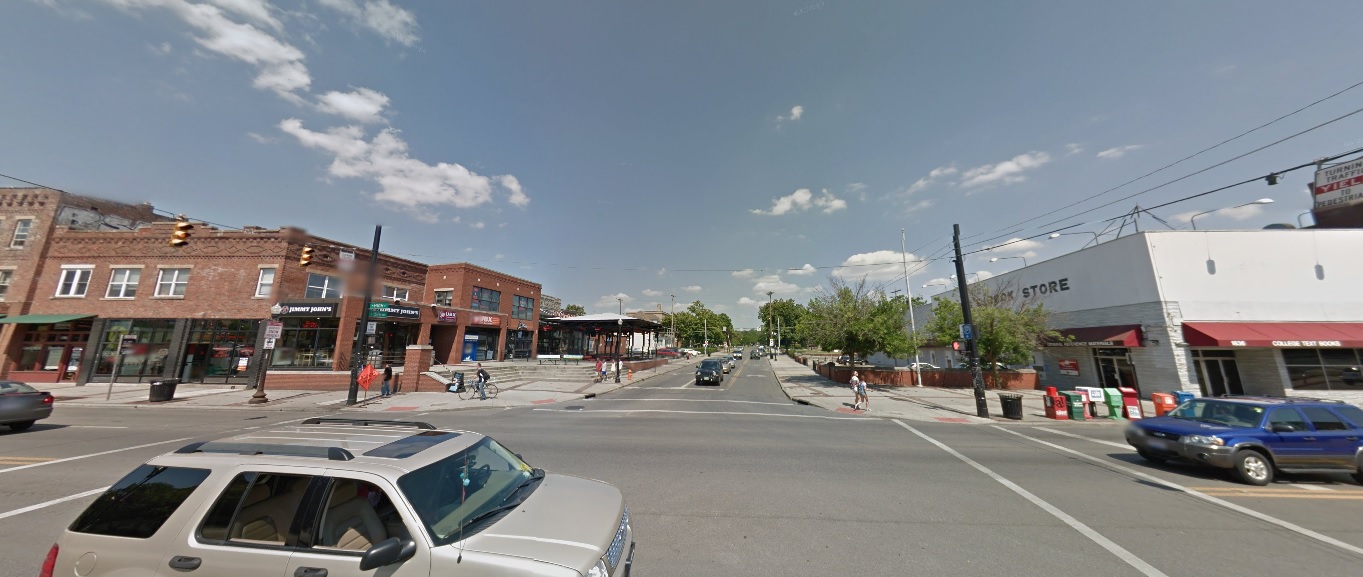
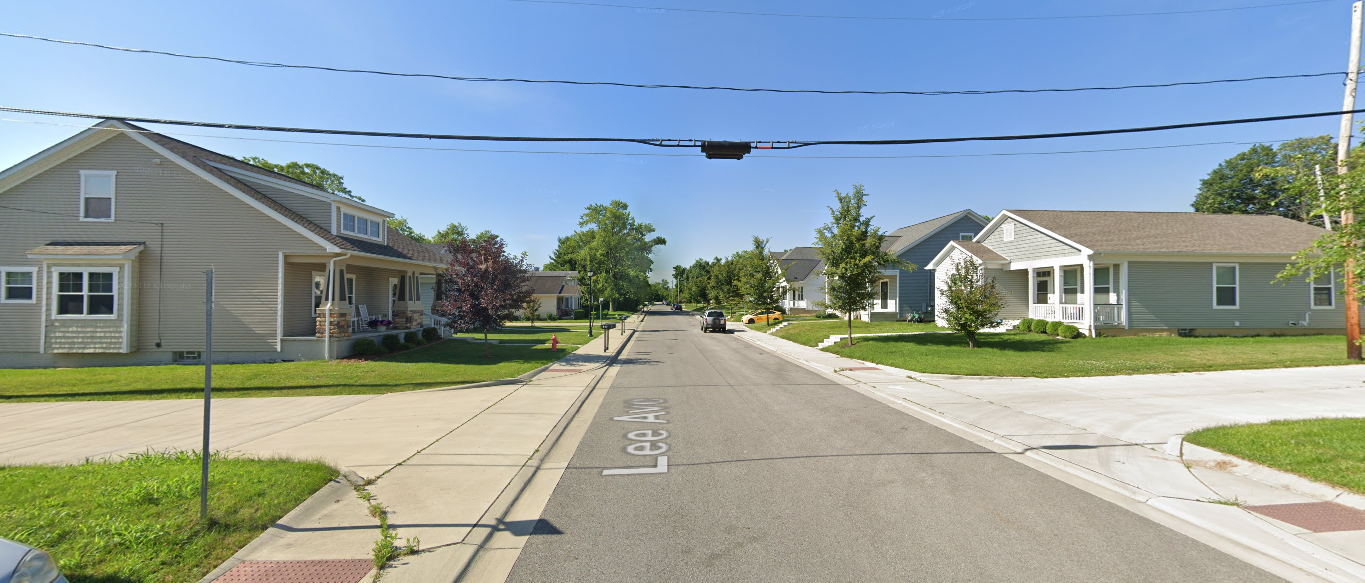
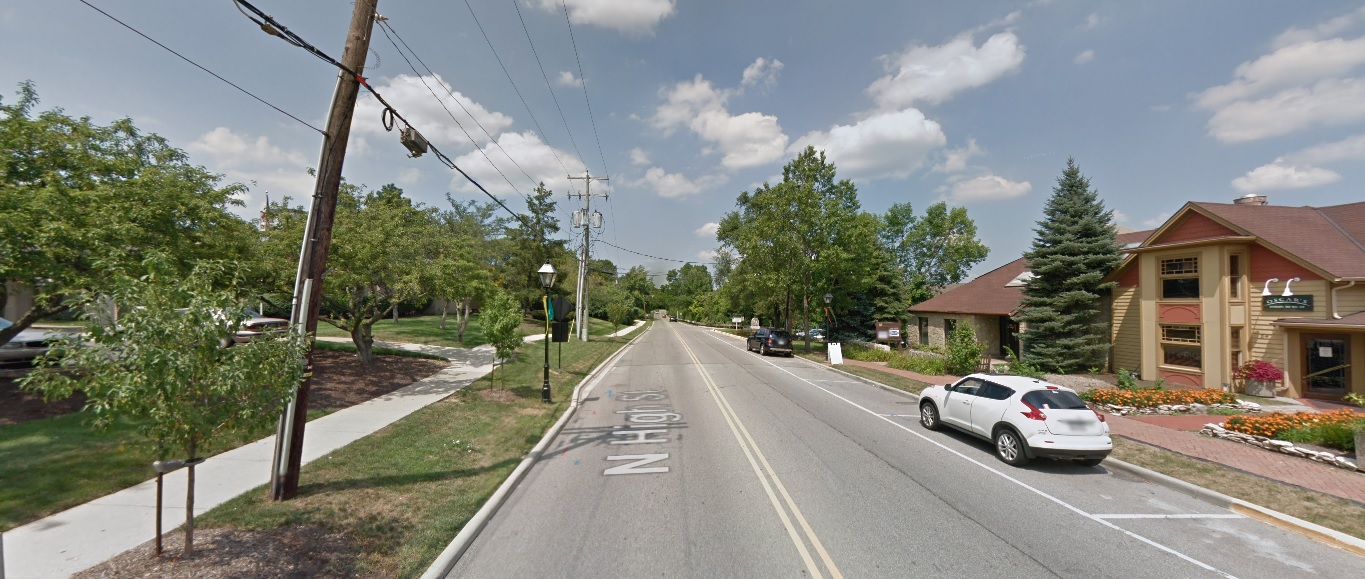
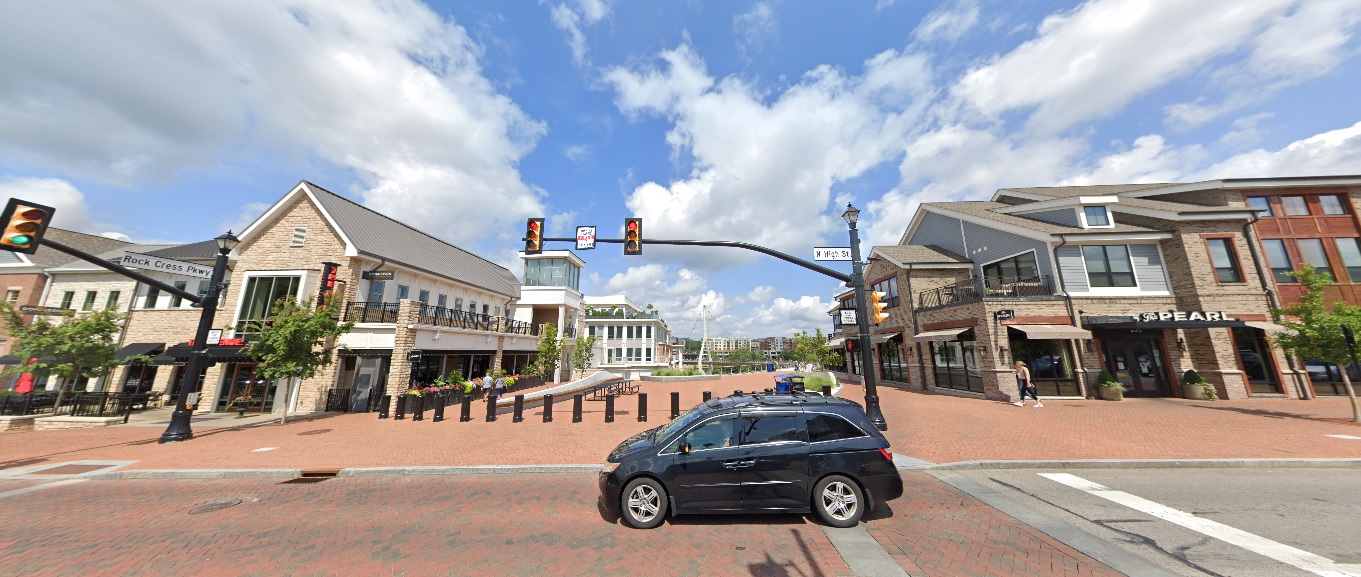
High Street, looking north from North Street. Before: 2011 After: 2021
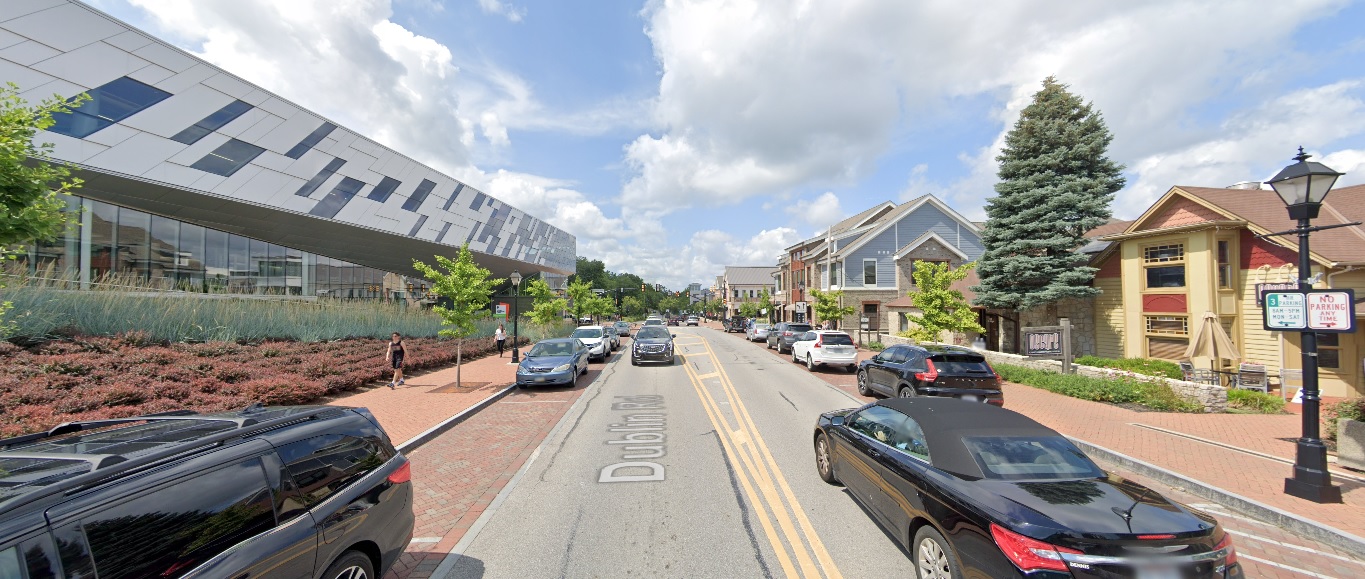
High Street, looking east at Rock Cress Parkway. Before: 2011 After: 2021
Upper Arlington
Riverside Drive, looking east just south of Bethel Road. Before: 2011 After: 2021
Bexley
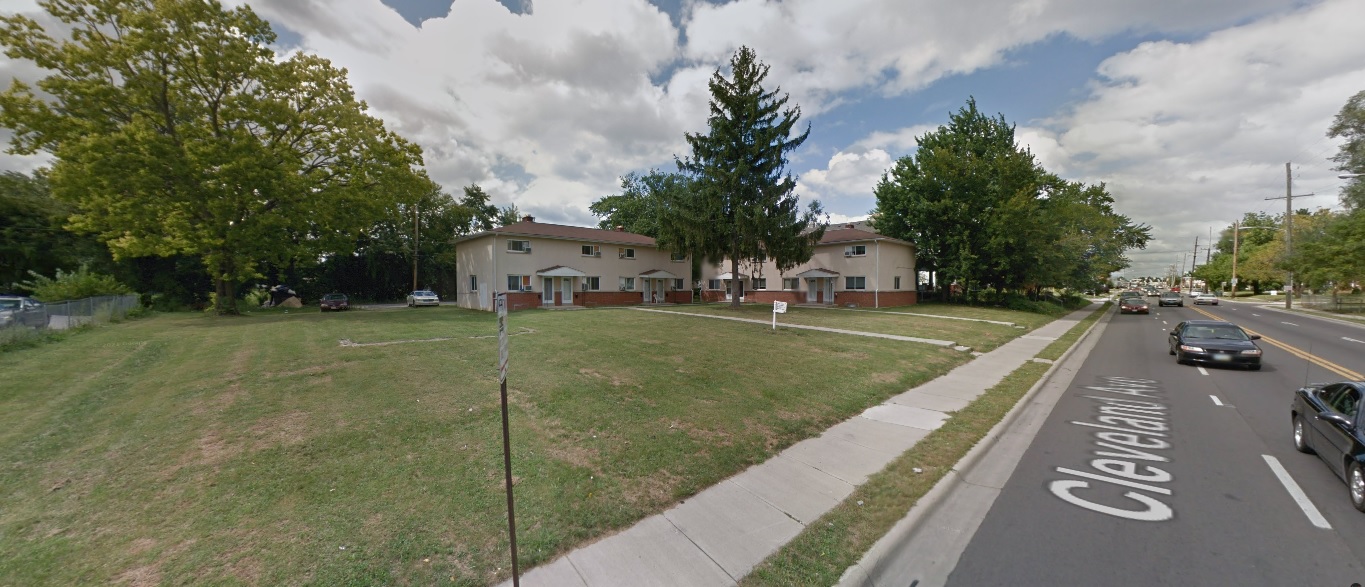
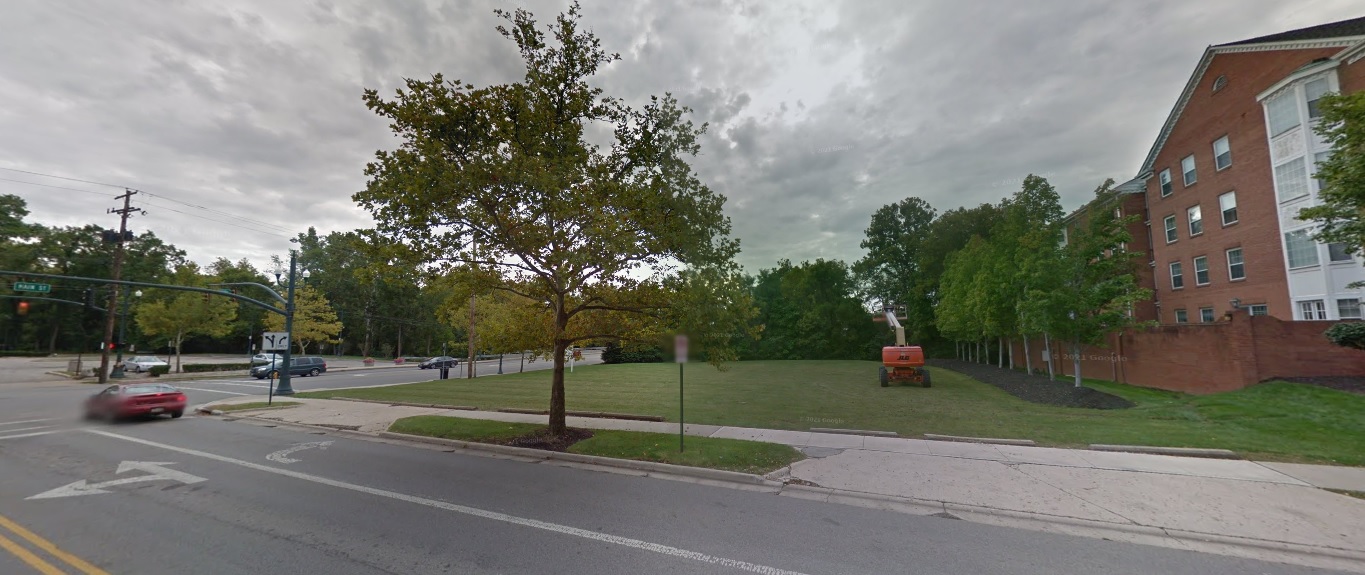
Parkview Avenue, looking southwest just north of Main Street. Before: 2011 After: 2021
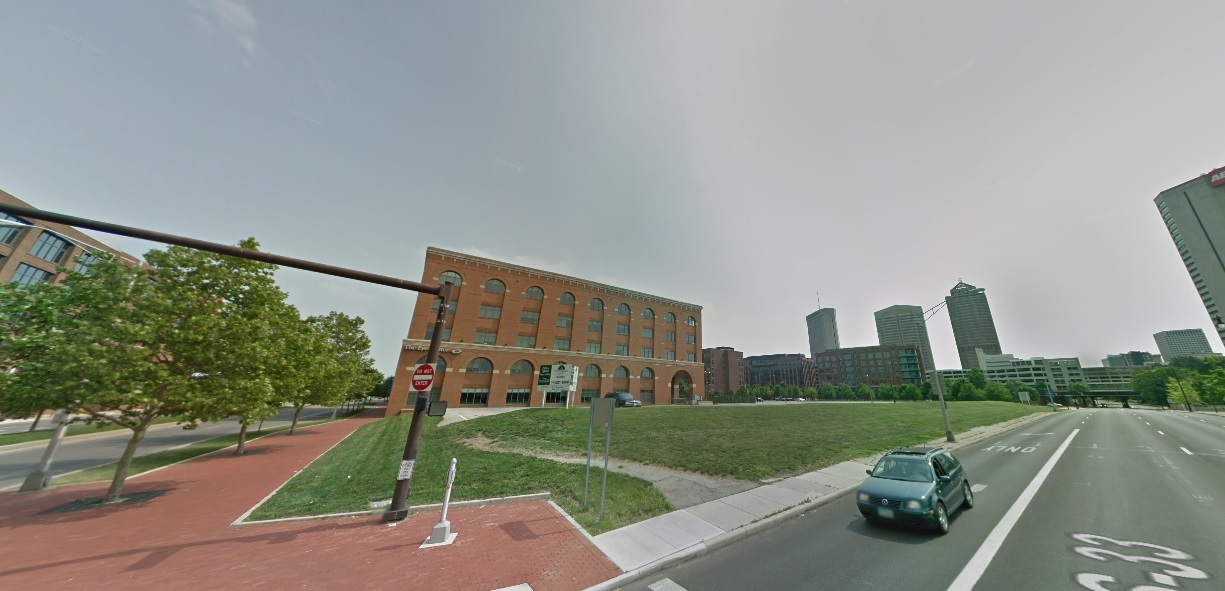
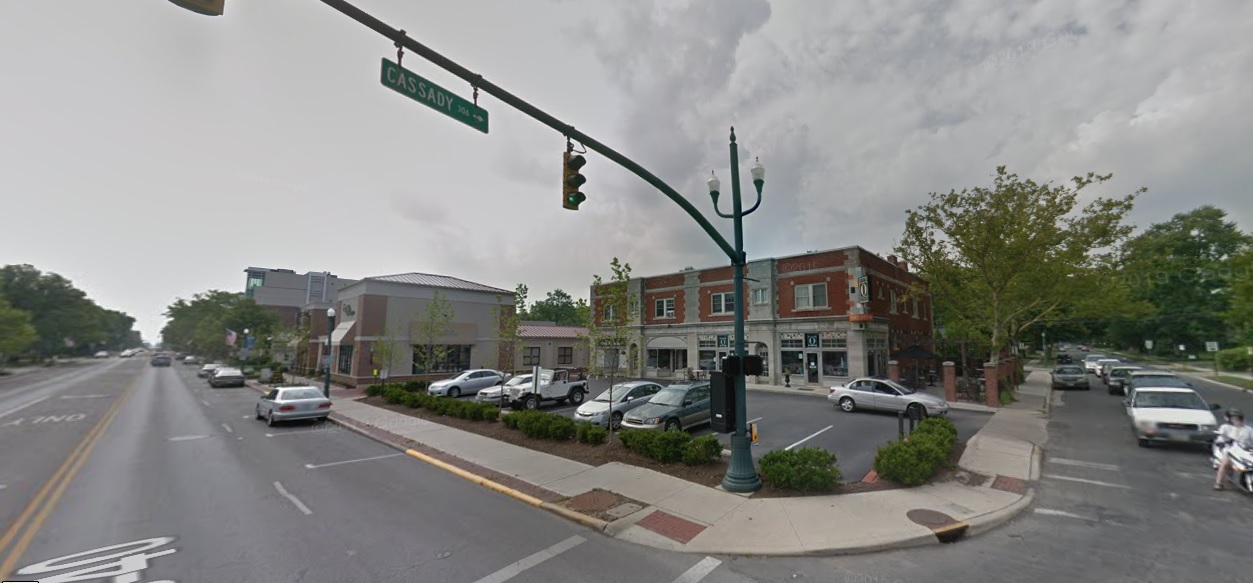
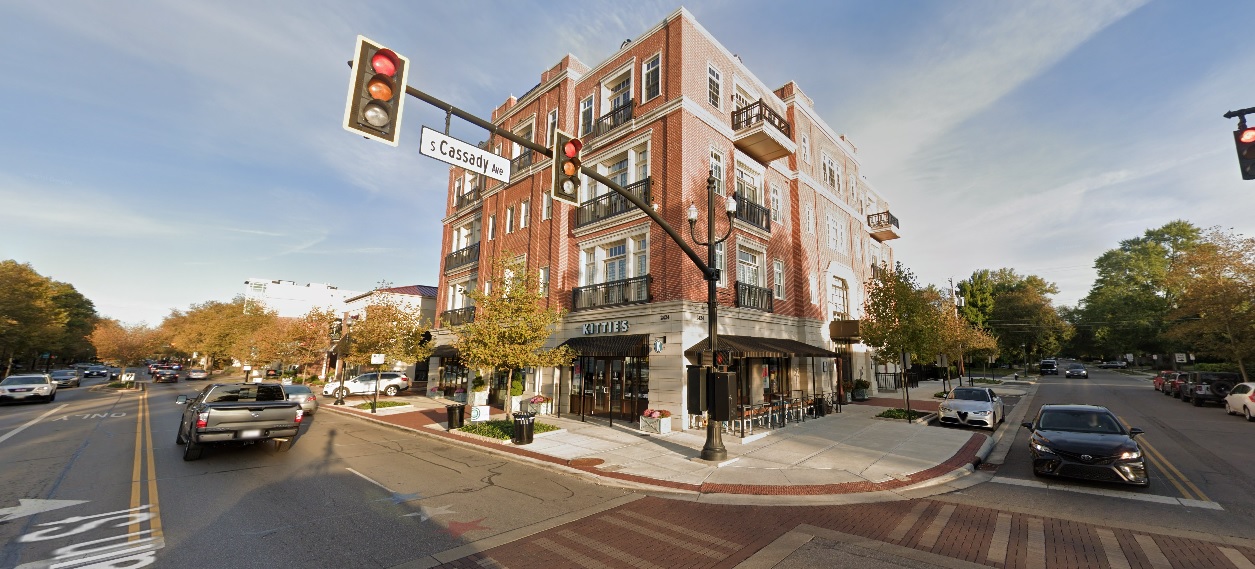
Main Street, looking northwest at Cassady Avenue. Before: 2011 After: 2021
As I stated in the previous installment, these photos still just represent a small fraction of the development and changes that have occurred across the city and its suburbs in the past decade. These are meant to be representative of those changes, not to suggest that other neighborhoods not featured didn’t change as well. Either way, enjoy!
This 2-part before and after series highlights many projects that have changed the landscape around the city. Many other projects that will continue to transform the area for the next decade and beyond are still in development or construction phases. A list of local area commissions provide monthly updates on potential new projects around the city.
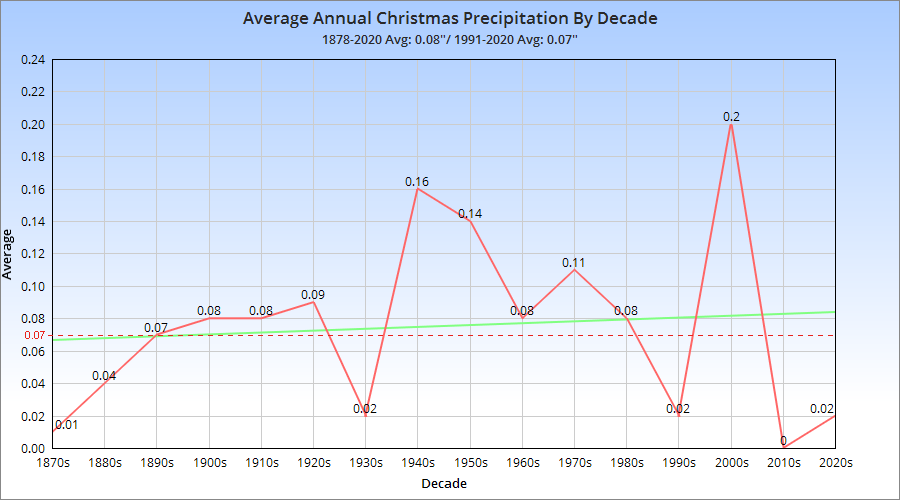
White Christmases are pretty rare in the Columbus, Ohio area. An inch or more has fallen on the date only 11 times since 1878. An official White Christmas, however, is defined as having 1″ or more snow on the ground, not necessarily falling on the day itself. That has only happened 21 times since 1939, with only 4 of those times coming since 2000. So these white holidays are relatively rare.
A white Christmas Eve has been even less likely. 1″ or more has been on the ground on December 24th just 16 times since 1939.
Accumulating snow is not all that rare for Christmas Eve. It’s occurred 31 times since 1878, or about once every 4-5 years. So not exactly an annual occurrence, but it happens at least a few times per decade. However, most of those instances were less than 1″ of snow- in fact, 27 of the 31 times were less than 1″. That means 1″ or more of snow has fallen on Christmas Eve just 4 times in the last 142 years, a very rare event indeed.
The largest Christmas Eve snowfall until this year was just 2.7″ in 1980. This year’s Christmas Eve snowstorm brought anywhere from 2″-8″ across the Columbus metro area. In Franklin County, 3″-5″ was common. Officially, the airport received 3.4″ on the 24th, which counts as the largest Christmas Eve snowstorm in Columbus history. Snow was still falling lightly Christmas day, so a little more could be added to the final storm total, but another official White Christmas has gone into the books.
Although Ohio is technically still counting some votes, there shouldn’t be any significant movement in the overall numbers, so we can now take a look at how the local area voted down to the precinct level. In this post, though, the focus is on 2020 election results for Columbus metro counties, as well as past elections going back to 2000.
First, here are the voting total breakdowns by every metro county since 2000.
Delaware County Total Votes By Election 2020: 126,374 2016: 105,639 2012: 98,899 2008: 92,581 2004: 80,456 2000: 55,403 Fairfield County 2020: 81,598 2016: 73,554 2012: 72,220 2008: 72,147 2004: 67,882 2000: 54,094 Franklin County 2020: 632,532 2016: 587,524 2012: 572,188 2008: 561,763 2004: 525,827 2000: 414,074 Hocking County 2020: 13,860 2016: 12,929 2012: 12,768 2008: 13,016 2004: 13,199 2000: 10,756 Licking County 2020: 94,396 2016: 83,624 2012: 81,550 2008: 82,570 2004: 79,420 2000: 62,466 Madison County 2020: 19,887 2016: 17,421 2012: 17,557 2008: 17,510 2004: 17,398 2000: 14,667 Morrow County 2020: 18,468 2016: 16,688 2012: 16,217 2008: 16,679 2004: 16,328 2000: 12,839 Perry County 2020: 16,676 2016: 15,101 2012: 15,020 2008: 15,437 2004: 15,189 2000: 12,828 Pickaway County 2020: 28,326 2016: 24,912 2012: 24,154 2008: 23,787 2004: 22,852 2000: 17,740 Union County 2020: 33,535 2016: 27,695 2012: 25,623 2008: 24,984 2004: 22,631 2000: 17,024
Total Metro Area 2020: 1,065,652 2016: 965,087 2012: 936,196 2008: 920,474 2004: 861,182 2000: 671,891
All of Columbus’ metro counties saw at or near record turnout levels, but also just high general vote totals. The metro added almost 400,000 total voters since 2000, partly explained by the area’s population growth.
Now let’s look at a breakdown of partisanship by total votes. With the margins, positive numbers are Republican, negative numbers are Democratic, again since 2000.
Only 3 metro counties- Delaware, Fairfield and Franklin- moved further blue since 2016. Franklin and Delaware moved strongly left, Fairfield only slightly. Delaware and Franklin also moved more blue from 2012 to 2016. Union stayed very similar to 2016. Delaware and Franklin are the 2 most urbanized counties in the metro, so it makes sense they moved bluer. The most rural counties tended to have the strongest movement to the right.
2020 was the first election in which either party surpassed half a million votes.
Metro Area Margin Between Democratic and Republican Votes (Negative is Democrat, Positive is Republican) 2020: -87,648 2016: -45,097 2012: -65,040 2008: -52,119 2004: +40,202 2000: +63,063
2020 provided the largest margin for either party since 2000, and the metro has generally become more blue over time.
This post will update daily county voting data, where available, through the election. Numbers in parenthesis are from the previous day, for comparison. There are 8 counties without data, as those county board of elections do not post their statistics online.
**Last Updated: 11/2/2020- 10AM
Total Votes in Ohio Through 11/1: 2,909,171 (2,854,258)
County Average of the Return Rate for 2020 Absentee Ballots: 92.02% (91.09%)
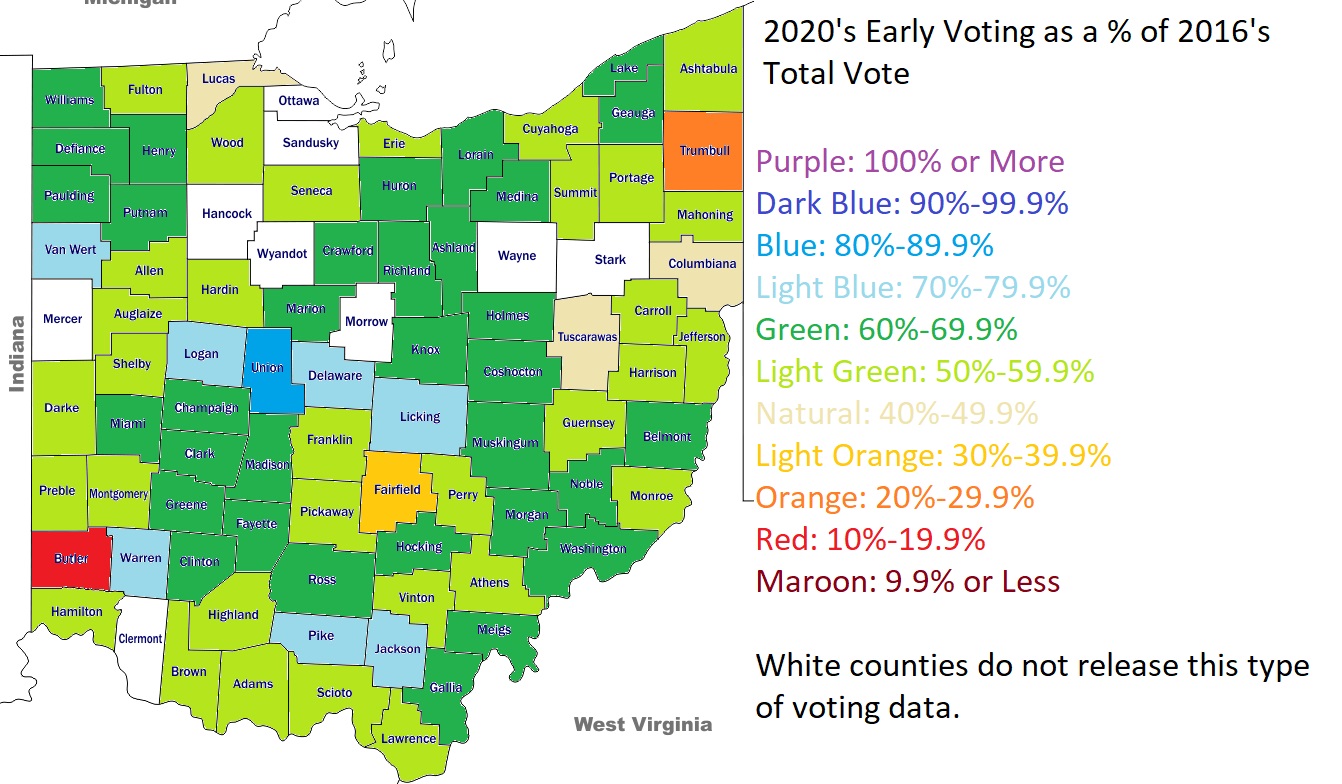
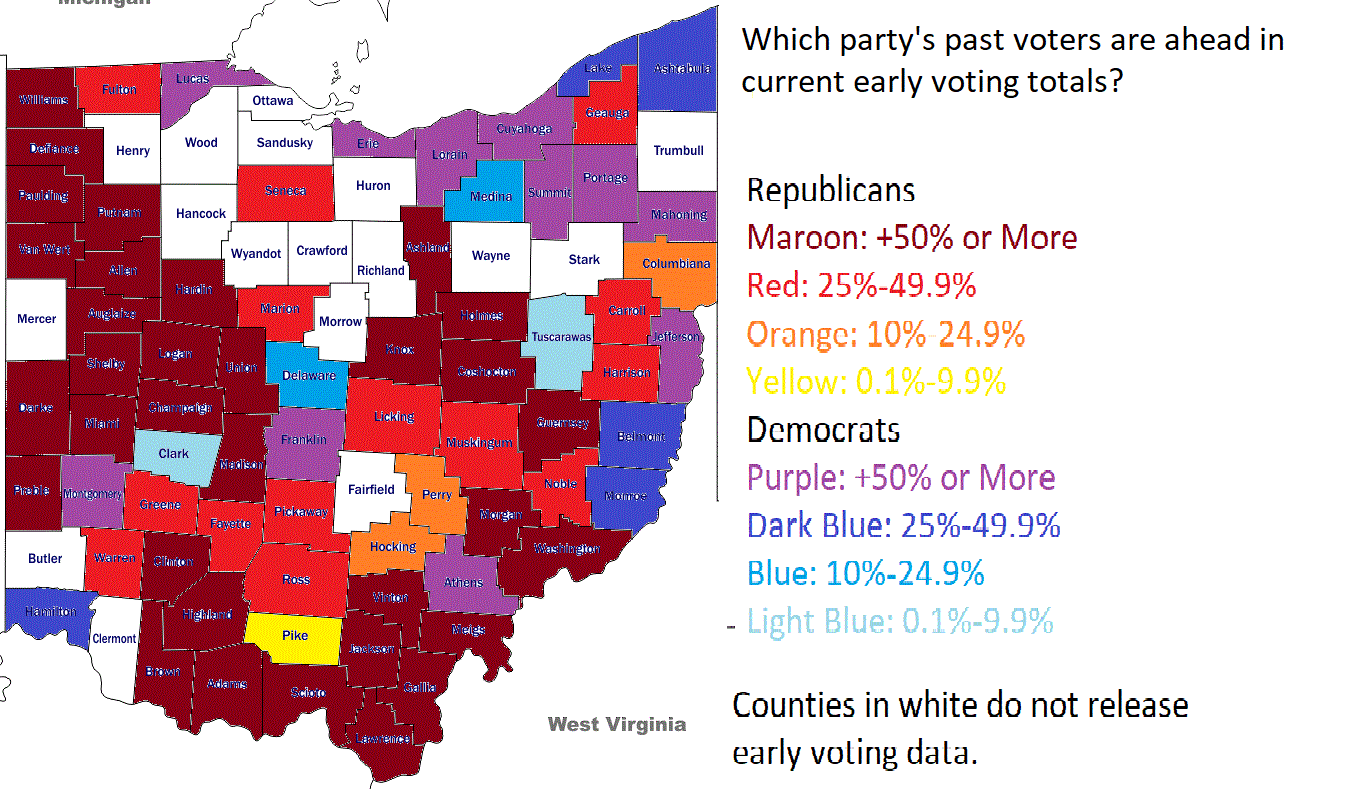
Ohio does not register voters by party, but most counties do release the breakdown of how registered voters voted in previous elections and apply that breakdown to current early voting totals. These numbers are in no way any guarantee of how voters will actually vote in 2020, but they do provide at least some context as to *who* is voting so far. So which party’s past voters are ahead in the counties?
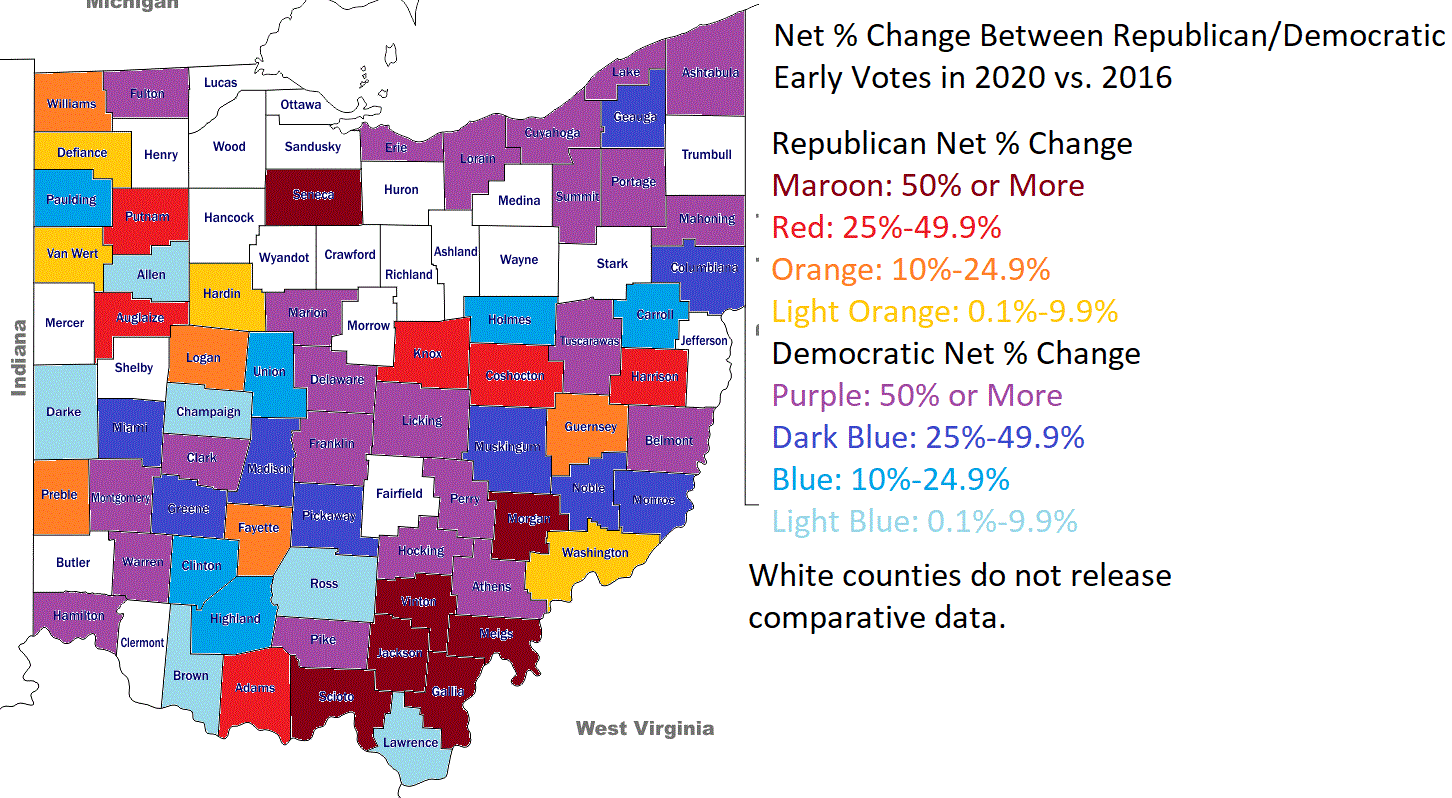
And here is a map of the net change of Democratic and Republican early votes between 2016 and 2020. Again, although we can’t be sure who these people voted for, it does appear that Democrats have made broad gains across most of the state.