Strange Columbus 1884 Earthquake


Strange Columbus September 1884 Earthquake Columbus, Ohio

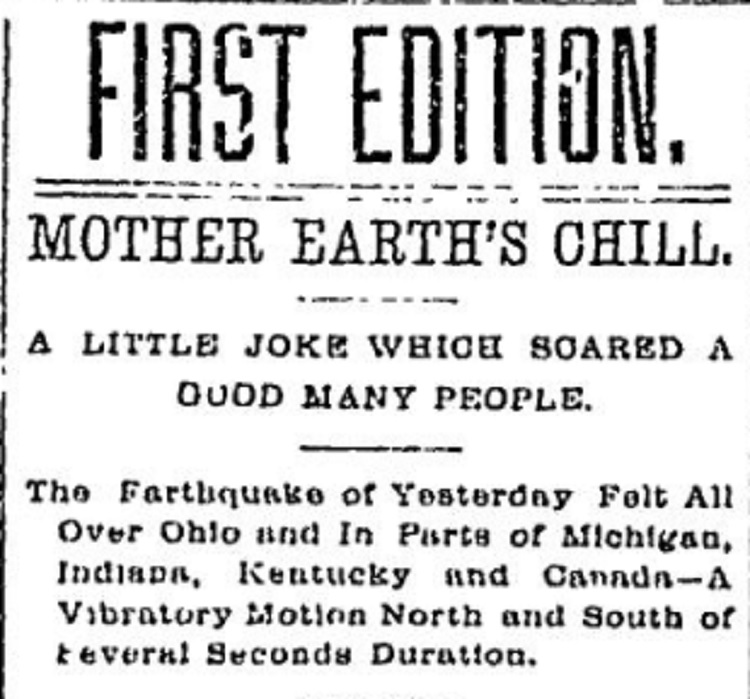
Columbus Dispatch headline from September 20, 1884.

This Strange Columbus 1884 Earthquake edition reviews a fairly rare event in the state-a damaging seismic event. While most earthquakes felt within the state have epicenters outside of Ohio- either west in the Missouri/Illinois area or north in Ontario or Quebec- the September, 1884 quake was one of the few damaging ones that had its origins within state borders.
At around 2:45PM on the 19th, an estimated magnitude 4.8 tremor struck northwest Ohio. While 4.8 is not particularly strong as far as earthquakes go, Ohio’s geology allows even relatively weak quakes to shake the land with much greater force than in other parts of the country.
The earthquake was felt across all of Ohio and several surrounding states. The Crestline Advocate, from small Crestline, Ohio to the west of Mansfield, provided accounts from all over the region a week after the event. Here are just a few.

From Crestline itself:
A genuine earthquake visited this locality last Friday afternoon at 2:45, in which houses were made to tremble and furniture rattle. Several persons ran from dwellings and business houses, expecting everything to “fall in.” The swaying motion was very distinct, running east and west. The sensation was
something new in this section. The experience here was the same as that telegraphed from numerous portions of the State. Our neighboring towns, also, reported a lively shaking up. James Booth says that, at the time of the occurrence, he was thrown from a lounge on which he was lying, then bounded up from the floor, whirled around, and went scooting out of his front door up into the air, and when he collected his scattered senses he found himself on the roof of his domicile, standing on his head. He didn’t say this in just so many words, but this was inferred from the experience he related.

COLUMBUS, O., September 20. – At 2:40p.m. yesterday, a shock of earthquake was felt in different parts of this city, the vibrations lasting over thirty seconds. At the Capitol (sic) University the chandeliers swayed to and fro and students left their rooms amid great excitement.

CLEVELAND, Ohio., September 20. –
Yesterday afternoon an earthquake was felt in many parts of this city. Tables and furniture were moved in the houses, pictures on the walls were shaken, causing quite an excitement among the inmates. The motion was from west to east and was confined to three distinct rockings finally subsiding and dying away in a sort of a tremor.

CINCINNATI, O., September 20. – At 2:30 yesterday afternoon the shock of an earthquake was felt in this city and in Covington, Ky. There was a slight trembling of buildings and rocking motion felt, which was sufficiently marked to cause astonishment and comment. The motion was from north to south and was a gentle undulation, without any tremor or upheaval. The shocks lasted about ten seconds, there being a perceptible pause between the first and second. A gentleman, who was writing at home on Cutter Street, said he felt his table vibrate. It stopped and then moved again less violently than before. Reports from Mt. Vernon and Delaware, Ohio, say the shock was felt at their places.

A 1998 report on the event further described some of the damage and range of the earthquake.
The earthquake caused damage at Lima, where the shock was “of considerable violence and caused much excitement.” Plaster was shaken from ceilings east and southeast of Columbus at Zanesville, Ohio, and Parkersburg, W. Va. Windows and dishes were broken at Defiance and Norwalk, Ohio; to the west at Fort Wayne and Muncie, Ind.; to the north at Lansing, Mich.; and to the east at Wheeling, W. Va. Furniture was displaced and 14 buildings were heavily shaken at Urbana, Ohio, in Champaign County, and at many other towns in the regions. Also felt in Iowa, Kentucky, Pennsylvania, and western Ontario, Canada, and at Washington, D.C. by workmen on top of the unfinished Washington Monument.

The exact epicenter was never determined, but research long after put the likely origin in Allen County.

The United Stated Geological Survey, or USGS, puts out an earthquake map with all current and past earthquakes from around the world. Users can select regions and search for earthquakes going back a century or more, or search based on magnitudes.

Columbus Restaurant History

Columbus restaurant history Kahiki

Ever looked at a building and wondered if it was ever a former Pizza Hut? Or wanted to know how long Kahiki was in business? Columbus Restaurant History is a fantastic link for all of the local area’s foodie history. Not only are there stories about individual restaurants and chains, but you can look up former restaurant locations, dates of existence, old menus and so much more! It’s just a really cool link for a niche part of Columbus’ history.

Take a look!


Columbus Economy May 2022


Columbus Economy May 2022

Now hiring sign

For the Columbus economy May 2022 report, we will look for any signs that the local economy is being negatively affected by ongoing inflation and higher energy prices.

Overall Metro Area May 2022 and Change from May 2021
Labor Force: 1,132,871 +24,699
Employed: 1,100,438 +43,723
Unemployed: 32,433 -19,024
Unemployment Rate: 2.9% -1.7
Total Non-Farm Jobs: 1,123,200 +28,300

The 2.9% May unemployment rate for the Columbus metro remains one of the lowest in more than 30 years, and all metrics were better than they were a year ago.

Overall Metro Area May 2022 and Change from February 2020 (Pre-Pandemic)
Labor Force: 1,132,871 +12,067
Employed: 1,100,438 +23,598
Unemployed: 32,433 -11,531
Unemployment Rate: 2.9% -1.0
Total Non-Farm Jobs: 1,123,200 +11,800
The metro area has surpassed pre-pandemic data across the board.

Now let’s view the results by industry.

Mining/Logging/Construction
5/2020———–5/2021———-5/2022

43,200————45,700———47,500
This industry has fully recovered from the pandemic and continues to set new highs.

Manufacturing
5/2020———–5/2021———-5/2022

66,700———–71,900———-72,300
Although manufacturing has largely recovered from pandemic lows, it remains *well* below anytime before 2000.

Trade/Transportation/Utilities
5/2020———–5/2021———-5/2022

205,400———-221,000———238,000
This industry is at 30 year highs.

Information
5/2020———–5/2021———-5/2022

15,500———–15,600———-16,600
The industry has been in somewhat of a decline overall since the Dot.com boom of the late 1990s. It recovered most pandemic losses, but seems unlikely to do much better in the long run.

Financial Activities
5/2020———–5/2021———-5/2022

83,900———–84,500———-83,700
Financial activities jobs have declined slightly since recovering its pandemic losses.

Professional and Business Services
5/2020———–5/2021———-5/2022
166,500———-179,600———178,200
As with the financial activities industry, this industry initially recovered from the pandemic, but has stagnated a bit since then.

Education and Health Services
5/2020———–5/2021———-5/2022

145,600———-159,700———158,800
These industries have been somewhat stagnant as well since around October, 2020.

Leisure and Hospitality
5/2020———–5/2021———-5/2022
69,000———-97,200———-107,600
This industry was arguably hit the hardest of any during the pandemic crash, but have recovered fairly strongly since then. However, because the fall was so great, it has not completely come back to date.

Other Services
5/2020———–5/2021———-5/2022

32,800———–39,800———-41,500
This industry is on track for full recovery by late summer.

Government
5/2020———–5/2021———-5/2022

177,500———-179,900———179,000
Government jobs remain below where they were pre-pandemic, and have shown little movement either way.

Overall, the metro has recovered from the pandemic and most metrics are generally positive, but not all industries are doing equally well. There remains no sign of any impending downturn.

The Bureau of Labor Statistics, the source of this data, is useful for local employment data for any metro area in the United States.

Housing Market Update May 2022


Local housing market update May 2022 Columbus, Ohio

In this latest edition of the Housing Market Update May 2022, we see that home prices continue to reach record levels in the metro area, and houses are selling faster than ever. With rising mortgage interest rates, will the region eventually see a slowdown?

Note: LSD= Local School District, CSD= City School District. In both cases, school district boundaries differ from city boundaries.

Top 15 Most Expensive Locations By Median Sales Price in May 2022
1. New Albany: $789,900
2. New Albany Plain LSD: $650,000
3. Big Walnut LSD: $572,127
4. Powell: $565,000
5. Upper Arlington CSD: $558,000
6. Dublin: $555,000
7. Grandview Heights: $545,000
8. Granville CSD: $530,000
9. Dublin CSD: $515,000
10. Olentangy LSD: $505,000
11. Buckeye Valley LSD: $495,000
12. Worthington: $481,000
13. German Village: $475,000
14. Bexley: $470,000
15. Pickerington: $444,000
16. Canal Winchester CSD: $430,000
Several suburbs now have median prices at or above half a million dollars, with several others not too far behind.

Top 15 Least Expensive Locations by Median Sales Price in May 2022
1. Lancaster CSD: $175,000
2. Miami Trace LSD: $180,000
3. Newark CSD: $184,000
4. Circleville CSD: $187,500
5. Whitehall CSD: $205,000
6. Jefferson LSD: $220,000
7. London CSD: $227,450
8. Groveport Madison LSD: $243,000
9. Hamilton LSD: $256,700
10. Obetz: $256,700
11. Columbus CSD: $257,500
12. Columbus: $277,750
13. Reynoldsburg CSD: $280,500
14. Minerva Park: $291,500
15. South Western CSD: $295,450
On the opposite side of things, even some of the cheapest markets are approaching the $300K mark. Columbus itself remains *relatively* affordable in comparison to the market overall.

Overall Market Median Sales Price in May: $303,460
Based on the 10 Columbus Metro Area counties.

Top 15 Locations with the Highest Median Sales Price % Growth Between May 2021 and May 2022
1. Canal Winchester CSD: +65.4%
2. Big Walnut LSD: +50.4%
3. Whitehall: +48.6%
4. Northridge LSD: +42.6%
5. Groveport Madison LSD: +39.0%
6. Grandview Heights: +38.3%
7. Granville CSD: +31.7%
8. Gahanna: +27.6%
9. Teays Valley LSD: +26.4%
10. Pataskala: +26.3%
11. Pickerington: +25.1%
12. Downtown: +24.3%
13. Johnstown-Monroe LSD: +23.5%
14. Powell: +22.8%
15. Sunbury: +22.5%

Top 15 Locations with the Lowest Median Sales Price % Growth Between May 2021 and May 2022
1. German Village: -24.6%
2. Miami Trace LSD: -19.3%
3. Obetz: -14.0%
4. Bexley: -5.5%
5. Delaware CSD: -4.7%
6. New Albany: -2.5%
7. Minerva Park: -2.2%
8. Lancaster CSD: -0.6%
9. Newark CSD: -0.1%
10. Jonathan Alder LSD: 0.0%
11. Short North: 0.5%
12. London CSD: +1.1%
13. Westerville: +2.4%
14. Circleville CSD: +3.0%
15. Beechwold/Clintonville: +3.5%
So far, the “Intel Effect” has yet to kick in in places like Newark and some Northeast Side communities. Only Johnstown is seeing a significant price increase. This may have to do with some of these places already being overvalued, especially New Albany.

Overall Market Median Sales Price % Change May 2022 vs. May 2021: +14.5%
Based on 53 metro market locations.

Top 10 Locations with the Most New Listings in May 2022
1. Columbus: 1,337
2. Columbus CSD: 898
3. Olentangy LSD: 214
4. South Western CSD: 210
5. Hilliard CSD: 162
6. Dublin CSD: 146
7. Westerville CSD: 139
8. Worthington CSD: 94
9. Dublin: 90
10. Lancaster CSD: 88

Top 10 Locations with the Fewest New Listings in May 2022
1. Valleyview: 0
2. Lithopolis: 2
3. Minerva Park: 5
4. Obetz: 6
5. Jefferson LSD: 12
6. Northridge LSD: 14
7. Johnstown-Monroe LSD: 15
8. Miami Trace LSD: 18
9. Sunbury: 20
10. Granville CSD: 20
11. German Village: 21

Total New Listings in the Columbus Metro in May 2022: +3,362
Overall Metro New Listings % Change May 2022 vs May 2021: -3.1%
New listings fell in May year-over-year even though the late spring is often a time when more homes go onto the market. Franklin County had one of the largest declines in inventory, dropping about 6.9%.


Top 10 Fastest-Selling Locations by # of Days Homes Remain on the Market Before Sale in May 2022
1. Grandview Heights: 3
2. Canal Winchester CSD: 4
3. Hilliard: 4
4. Miami Trace LSD: 4
5. Minerva Park: 4
6. Westerville: 4
7. Westerville CSD: 4
8. German Village: 5
9. Hilliard CSD: 5
10. Marsyville CSD: 5
11. Powell: 5
12. Reynoldsburg CSD: 5
13. Sunbury: 5
14. Worthington: 5
15. Worthington CSD: 5
16. Bexley: 6
17. Dublin: 6
18. Groveport Madison LSD: 6
19. Jefferson LSD: 6
20. Pickerington: 6
21. Hamilton LSD: 7
22. Lancaster CSD: 7
23. Newark CSD: 7
24. Pickerington LSD: 7
25. Upper Arlington CSD: 7
26. Whitehall: 7
27. Beechwold/Clintonville: 8
28. Gahanna: 8
29. Delaware CSD: 9
30. South Western CSD: 9
31. Blacklick: 10
32. Columbus: 10
33. Johnstown-Monroe LSD: 10
34. Gahanna Jefferson LSD: 12
35. Dublin CSD: 13
36. Grove City: 13

The “Top 10” became the Top 36 just given that most of the local markets are selling so similarly quickly. There is relatively little spread between the fastest and slowest-selling markets, with some obvious exceptions.

Top 10 Slowest-Selling Locations by # of Days Homes Remain on the Market Before Sale in May 2022
1. Northridge LSD: 84
2. Downtown: 75
3. New Albany: 29
4. Buckeye Valley LSD: 28
5. Granville CSD: 27
6. Teays Valley LSD: 27
7. London CSD: 26
8. Short North: 25
9. Jonathan Alder LSD: 22
10. Big Walnut LSD: 20
11. New Albany LSD: 19
12. Obetz: 19
13. Pataskala: 19

Top 10 Locations with the Greatest % Decline of # of Days on the Market Before Sale May 2022 vs. May 2021
1. Bexley: -76.0%
2. Jefferson LSD: -73.9%
3. Lancaster CSD: -72.0%
4. Dublin: -68.4%
5. Johnstown-Monroe LSD: -64.3%
6. Grandview Heights: -62.5%
7. Reynoldsburg CSD: -58.3%
8. Short North: -51.0%
9. Hamilton LSD: -50.0%
10. Hilliard: -50.0%
11. Westerville: -50.0%
12. Hilliard CSD: -44.4%

Top 10 Locations with the Lowest % Decline of # of Days on the Market Before Sale May 2022 vs. May 2021
1. Northridge LSD: +1,300.0%
2. Jonathan Alder LSD: +633.3%
3. Valleyview: +400.0%
4. London CSD: +188.9%
5. New Albany: +141.7%
6. New Albany LSD: +111.1%
7. Downtown: +92.3%
8. Granville CSD: +80.0%
9. Circleville CSD: +77.8%
10. Teays Valley LSD: +68.8%

% Change for the # of Days Homes Remain on the Market Before Sale Across the Metro Overall: 15.6
Overall Metro Days on Market % Change May 2022 vs May 2021: -1.3%

Columbus Realtors offers monthly housing reports and other data back several years.


Best States for Retirement


best states for retirement

Perhaps the beaches of Florida aren’t the best place to retire after all?

There are a LOT of rankings out there related to the best states for retirement. And yet none of them produce the same list. Because of different criteria used, websites produce vastly different rankings. Some lists prioritize climate, others tax rates, others still healthcare costs. Some others having a long criteria list. No two are exactly alike. Further complicating the matter is that while there are hundreds of websites that list rankings, the vast majority of them just reprint a half-dozen or so studies from other websites, but with slightly different framing.
What I haven’t seen, however, is an average of all those rankings. That is what I attempted here. I tried to find as many rankings using original criteria and that ranked all 50 states and DC, and then averaged all those rankings into a new number. This helped to smooth out the varying criteria that can offer wildly opposing results into a more consistent ranking.

Average State Ranking Position Across All Studies Reviewed
1. North Dakota: 9.0
2. Delaware: 12.2
3. New Hampshire: 12.8
4. Virginia: 13.0
5. Iowa: 13.8
6. Florida: 14.4
7. Maine: 14.8
8. South Dakota: 15.0
9. Idaho: 15.4
10. Wyoming: 16.4
11. South Carolina: 19.2
12. Montana: 19.6
13. Pennsylvania: 19.8
14. Nebraska: 21.2
15. Alabama: 21.8
16. Colorado: 22.2
17. North Carolina, Ohio: 23.8
18. Vermont: 24.0
19. Missouri: 24.2
20. Georgia, Minnesota: 24.6
21. Wisconsin: 24.8
22. Tennessee, Utah: 26.0
23. Arizona: 26.6
24. Kansas, Michigan: 27.0
25. Mississippi: 28.0
26. Hawaii, Indiana, West Virginia: 28.4
27. Kentucky: 28.6
28. Oregon: 28.8
29. Arkansas: 29.0
30. Nevada: 29.2
31. Connecticut: 30.6
32. Alaska, Rhode Island: 31.2
33. Massachusetts, Oklahoma: 33.2
34. Washington: 34.6
35. Louisiana: 34.8
36. Maryland: 35.0
37. Texas: 35.6
38. New Mexico: 36.2
39. Illinois: 36.4
40. California: 37.6
41. New Jersey: 38.4
42. New York: 38.6
43. Washington, DC: 42.5

I definitely went into this thinking that Florida, Arizona, Texas and other warm-weather states would all come out near or at the very top, but it didn’t quite work out that way. Instead, the top 25 positions were much more mixed, and the Sunbelt region did not have the most states. Instead, the Midwest led the way with 10, followed by the Southeast with 8, the West with 6 and the Northeast with 5.
If going purely by average score, here is the breakdown of states by region with a score of under 25 versus those with an average score over 25, indicating the line between top and bottom-ranking states.
Score Below 25
Midwest: 9
Southeast: 6
Northeast: 5
West: 4
Score Above 25
West: 9
Southeast: 8
Northeast: 7
Midwest: 4

This all suggests that the Midwest is the best overall region to retire. The cold winters may not be everyone’s favorite, but favorable tax rates, quality of life metrics, low healthcare costs, low housing costs and other metrics make it otherwise a very attractive region. Ohio, too, comes in fairly favorable in the overall rankings, though it seems many retirees don’t consider Ohio or the greater Midwest as a retirement destination, and that’s to their detriment. It all comes down to what individuals prefer and prioritize, of course. The US Census does “Reason for Move” estimates of those people who move from one state or region to another, and they support that most people move for family, employment, education or health reasons. Contrary to popular belief, change of climate is way down at the bottom of the list. Cold-weather states, then, are perhaps just not capitalizing on their own net positives to attract more people.