December ended a 2-month decline in home sales for the area, with overall sales up 2.5% according to the Housing Market Update December 2013 data from Columbus Realtors.
Here are the stats for the 21 major areas of Franklin County that I look at housing stats for.
Top 10 December 2013 Sales Totals
1. Columbus: 657
2. Westerville: 47
3. Dublin: 45
4. Clintonville: 42
5. Upper Arlington: 41
6. Grove City: 39
7. Reynoldsburg: 38
8. Gahanna: 31
9. Hilliard: 22
10. Pickerington: 18
Top 10 December 2013 Sales Increases over December 2012
1. Minerva Park: +200.0%
2. Obetz: +200.0%
3. Reynoldsburg: +72.7%
4. Clintonville: +55.6%
5. Gahanna: +55.0%
6. Pataskala: +27.3%
7. Dublin: +15.4%
8. German Village: +10.0%
9. Worthington: +6.3%
10. Columbus: +3.8%
Top 10 Year-to-Date Sales Through December 2013
1. Columbus: 10,267
2. Dublin: 797
3. Upper Arlington: 719
4. Clintonville: 701
5. Westerville: 630
6. Grove City: 609
7. Hilliard: 556
8. Gahanna: 526
9. Reynoldsburg: 505
10. Pickerington: 312
Top 10 Year-to-Date Increases Through December 2013 Over 2012
1. Minerva Park: +51.9%
2. Gahanna: +31.8%
3. Pataskala: +31.0%
4. Reynoldsburg: +30.8%
5. Whitehall: +27.3%
6. Clintonville: +26.3%
7. Hilliard: +23.6%
8. Whitehall: +23.4%
9. Westerville: +21.9%
10. Bexley: +21.5%
Average Sales December 2013
Urban: 74.5
Suburban: 28.2
Urban without Columbus: 14.7
Average % Change December 2013 vs. December 2012
Urban: +40.5%
Suburban: +6.4%
Urban without Columbus: +44.2%
Average YTD Sales Through December 2013
Urban: 1,177.1
Suburban: 466.5
Urban without Columbus: 268.1
Average YTD % Change YTD Through December 2013
Urban: +15.7%
Suburban: +19.4%
Urban without Columbus: +15.3%
Top 10 Average Sales Price December 2013
1. New Albany: $563,187
2. Upper Arlington: $377,943
3. Bexley: $376,592
4. Dublin: $351,279
5. Downtown: $314,583
6. German Village: $303,136
7. German Village: $271,656
8. Hilliard: $249,811
9. Worthington: $232,741
10. Clintonville: $223,250
Top 10 Average Sales Price % Change December 2013 Over December 2012
1. Whitehall: +37.3%
2. New Albany: +32.8%
3. Pataskala: +29.6%
4. Reynoldsburg: +26.3%
5. Upper Arlington: +25.8%
6. Clintonville: +25.3%
7. Bexley: +23.7%
8. Hilliard: +21.9%
9. Gahanna: +19.6%
10. Dublin: +13.1%
Top 10 Average Sales Prices YTD Through December 2013
1. New Albany: $542,634
2. Upper Arlington: $365,143
3. Bexley: $352,214
4. Dublin: $336,048
5. German Village: $298,199
6. Downtown: $287,976
7. Worthington: $248,857
8. Grandview Heights: $223,185
9. Hilliard: $217,078
10. Gahanna: $199,546
Top 10 Average YTD Sales Price % Change Through December 2013 vs. 2012
1. Whitehall: +18.9%
2. Downtown: +14.0%
3. Minerva Park: +14.0%
4. Upper Arlington: +13.8%
5. Gahanna: +12.1%
6. New Albany: +9.8%
7. Reynoldsburg: +9.6%
8. Obetz: +9.0%
9. Worthington: +7.5%
10. Bexley: +5.8%
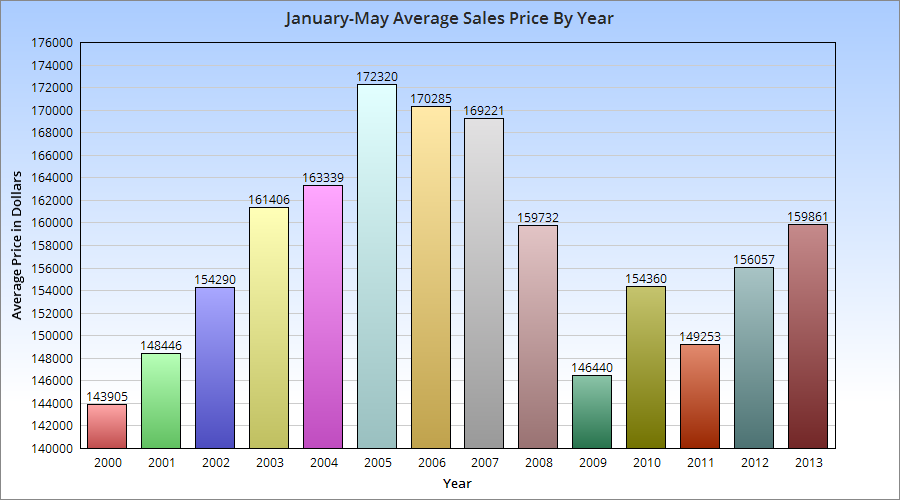
Average Sales Price December 2013
Urban: $218,764
Suburban: $233,048
Urban without Columbus: $227,832
Average Sales Price Change December 2012 vs. December 2012
Urban: -1.6%
Suburban: +15.5%
Urban without Columbus: -2.9%
Average Sales Price YTD
Urban: $217,056
Suburban: $224,060
Urban without Columbus: $226,017
Average Sales Price % Change YTD
Urban: +5.6%
Suburban: +5.6%
Urban without Columbus: +5.7%
Top 10 Fastest Selling Markets December 2013 (Based on Average # of Days for Listings to Sell)
1. Bexley: 26
2. Obetz: 42
3. New Albany: 47
4. Hilliard: 50
5. Clintonville: 51
6. Pataskala: 57
7. Gahanna: 58
8. Upper Arlington: 58
9. Reynoldsburg: 61
10. Grove City: 63
Top 10 Fastest Selling Markets YTD
1. Worthington: 42
2. Upper Arlington: 46
3. Grandview Height: 49
4. Clintonville: 50
5. Westerville: 53
6. Hilliard: 54
7. Bexley: 57
8. Gahanna: 59
9. Dublin: 63
10. Grove City: 64
Average # of Days Before Sale, December 2013
Urban: 73.4
Suburban: 63.9
Urban without Columbus: 73.8
Average # of Days Before Sale YTD
Urban: 61.3
Suburban: 62.9
Urban without Columbus: 60.9
Top 10 Lowest Market Housing Supplies (Based on # of Months to Sell all Listings)
1. Worthington: 1.2
2. Bexley: 1.8
3. Clintonville: 1.9
4. Hilliard: 1.9
5. Upper Arlington: 1.9
6. Grandview Heights: 2.1
7. Westerville: 2.1
8. Gahanna: 2.2
9. Minerva Park: 2.2
10. German Village: 2.3
A healthy housing supply is considered to be around 5 months. Anything less than 3 months is considered very low. All of the 21 areas I looked at were below 5 months, indicating a county-wide shortage. This shortage has only deepened over the last year, with December having the lowest number of available homes in nearly 15 years.
Average # of Months to Sell All Listings, December 2013
Urban: 2.7
Suburban: 3.2
Urban without Columbus: 2.6
Average % Change of Single-Family Home Sales December 2013 vs. December 2012
Urban: +28.5%
Suburban: +14.3%
Urban without Columbus: +30.8%
Average % Change of Single-Family Home Sales YTD vs. YTD 2012
Urban: +9.8%
Suburban: +19.0%
Urban without Columbus: +8.8%
Average % Change of Condo Sales December 2013 vs. December 2012
Urban: +20.5%
Suburban: -4.2%
Urban without Columbus: +20.5%
Average % Change of Condo Sales YTD vs. YTD 2012
Urban: +29.0%
Suburban: +23.5%
Urban without Columbus: +29.9%