Housing Market Update May 2021


Columbus housing market April 2013 Columbus, Ohio

housing market update May 2021 Columbus, Ohio

The local housing market update May 2021 is finally out, and the trends continue to show a strong sellers market. Prices continued to accelerate upward and supply continued to lag way behind, pushing home sales to occur even faster than they have been in recent months.

Note: LSD= Local School District, CSD= City School District. In both cases, school district boundaries differ from city boundaries.

Top 15 Most Expensive Locations By Median Sales Price in May 2021
1. New Albany: $810,000
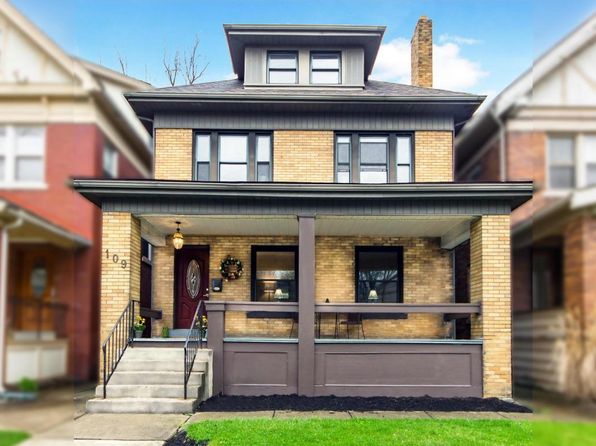
2. German Village: $630,000
3. New Albany Plain LSD: $570,000
4. Dublin: $528,750
5. Bexley: $497,500
6. Upper Arlington CSD: $495,000
7. Worthington: $461,420
8. Powell: $460,000
9. Dublin CSD: $450,000
10. Olentangy LSD: $445,000
11. Buckeye Valley LSD: $406,790
12. Granville CSD: $402,500
13. Short North: $400,450
14. Grandview Heights: $394,000
15. Jonathan Alder LSD: $390,000

New Albany proper posted an astronomical median price in May, reaching unprecedented numbers for a Columbus suburb.

Top 15 Least Expensive Locations by Median Sales Price in May 2021
1. Whitehall: $138,000
2. Valleyview: $157,500
3. Groveport Madison LSD: $175,825
4. Lancaster CSD: $176,000
5. Circleville CSD: $182,000
6. Newark CSD: $184,250
7. Jefferson LSD: $207,500
8. Columbus CSD: $220,000
9. London CSD: $225,000
10. Hamilton LSD: $237,000
11. Columbus: $240,000
12. Reynoldsburg CSD: $245,500
13. South-Western CSD: $249,900
14. Canal Winchester CSD: $260,000
15. Teays Valley LSD: $268,894

In general, the further out the place from Columbus, the cheaper the location, but there are some exceptions. Whitehall and Columbus proper remain relatively affordable compared to most locations in the metro.

Overall Market Median Sales Price in May 2021: $227,088
The overall market is defined by Columbus Metro Area counties.

Top 15 Locations with the Highest Median Sales Price % Growth Between May 2020 and May 2021
1. German Village: +59.5%
2. Worthington: +54.6%
3. Obetz: +52.2%
4. New Albany Plain LSD: +40.7%
5. Hamilton LSD: +39.4%
6. Dublin CSD: +32.0%
7. Delaware CSD: +32.0%
8. Dublin: +31.4%
9. Pickerington: +30.3%
10. New Albany: +29.7%
11. Newark CSD: +29.4%
12. Worthington CSD: +29.1%
13. Westerville CSd: +28.6%
14. Pataskala: +27.0%
15. Jonathan Alder LSD: +25.8%

Top 15 Locations with the Lowest Median Sales Price % Growth Between May 2020 and May 2021
1. Lancaster CSD: -7.3%
2. Jefferson LSD: -5.5%
3. Downtown Columbus: -4.2%
4. Hilliard: -0.5%
5. Teays Valley LSD: +3.5%
6. Powell: +5.1%
7. Big Walnut LSD: +6.2%
8. Grandview Heights: +6.8%
9. Granville CSD: +7.6%
10. Short North: +7.6%
11. Canal Winchester CSD: +8.3%
12. Minerva Park: +8.4%
13. London CSD: +10.3%
14. Circleville CSD: +11.3%
15. Buckeye Valley LSD: +11.4%

There were fewer locations down year-over-year in May than in previous months, though urban areas generally saw lower increases.

Overall Market Median Sales Price % Change May 2021 vs. May 2020: +18.6%

Top 10 Locations with the Most New Listings in May 2021
1. Columbus: 1,467
2. Columbus CSD: 972
3. South-Western CSD: 217
4. Hilliard CSD: 171
5. Westerville CSD: 168
6. Olentangy LSD: 166
7. Dublin CSD: 166
8. Worthington CSD: 118
9. Pickerington LSD: 115
10. Upper Arlington CSD: 101

Top 10 Locations with the Fewest New Listings in May 2021
1. Valleyview: 2
2. Lithopolis: 5
3. Minerva Park: 5
4. Jefferson LSD: 6
5. Obetz: 8
6. Sunbury: 8
7. Grandview Heights: 10
8. Johnstown-Monroe LSD: 11
9. Whitehall: 12
10. Circleville CSD: 14

Urban areas and major suburbs saw increases in supply versus previous months, but because sales were also stronger, it didn’t help with actual supply or prices.

Total New Listings in the Columbus Metro in May 2021: +3,468
Overall Metro New Listings % Change May 2021 vs May 2020: +14.3%


Top 10 Fastest-Selling Locations by # of Days Homes Remain on the Market Before Sale in May 2021
1. Jonathan Alder LSD: 3
2. Valleyview: 3
3. Canal Winchester CSD: 4
4. Groveport Madison LSD: 4
5. Lithopolis: 4
6. German Village: 5
7. Worthington: 5
8. Worthington CSD: 5
9. Beechwold/Clintonville: 6
10. Blacklick: 6
11. Gahanna: 6
12. Marysville CSD: 6
13. Pickerington LSD: 6
14. Powell: 6
15. Westerville CSD: 6
16. Whitehall: 6

Top 10 Slowest-Selling Locations by # of Days Homes Remain on the Market Before Sale in May 2021
1. Short North: 51
2. Downtown Columbus: 39
3. Johnstown-Monroe LSD: 28
4. Bexley: 25
5. Lancaster CSD: 25
6. Jefferson LSD: 23
7. Obetz: 22
8. Buckeye Valley LSD: 21
9. Dublin: 19
10. Olentangy LSD: 18

Top 10 Locations with the Greatest % Decline of # of Days on the Market Before Sale May 2021 vs May 2020
1. Powell: -91.2%
2. Jonathan Alder LSD: -90.6%
3. Minerva Park: -85.7%
4. Circleville CSD: -84.2%
5. Whitehall: -82.9%
6. London CSD: -80.0%
7. Sunbury: -78.9%
8. Newark CSD: -78.0%
9. Upper Arlington CSD: -76.5%
10. Granville CSD: -75.8%

Top 10 Locations with the Lowest % Decline of # of Days on the Market Before Sale May 2021 vs May 2020
1. Short North: +264.3%
2. Valleyview: +50.0%
3. Bexley: +13.6%
4. Downtown Columbus: +11.4%
5. Lancaster CSD: -3.8%
6. Teays Valley LSD: -11.1%
7. Dublin: -26.9%
8. Reynoldsburg CSD: -29.4%
9. Westerville: -33.3%
10. Pataskala: -38.5%

% Change for the # of Days Homes Remain on the Market Before Sale Across the Metro Overall: 14

The market’s sales pace only increased further in May, with the entire metro’s supply of homes selling in an average of just 2 weeks. Many locations were selling at far faster rates, however.

A handy link is the Columbus Realtors website, which most of this data is derived from.


Housing Market Update March 2021


housing market update March 2021 Columbus, Ohio

The popular monthly series continues with the local housing market update March 2021 report. Let’s drill down into the results.

Note: LSD= Local School District, CSD= City School District. In both cases, school district boundaries differ from city boundaries.

Top 15 Most Expensive Locations By Median Sales Price in March 2021
1. New Albany: $652,000
2. New Albany Plain LSD: $523,500
3. Powell: $519,000
4. Upper Arlington CSD: $476,600
5. German Village: $475,550
6. Grandview Heights: $474,000
7. Dublin: $462,000
8. Olentangy LSD: $443,685
9. Buckeye Valley LSD: $420,000
10. Dublin CSD: $419,000
11. Bexley: $413,000
12. Short North: $399,900
13. Granville LSD: $388,500
14. Big Walnut LSD: $384,900
15. Worthington: $358,000

New Albany continued to dominate the top of the market in terms of median sales price, and it wasn’t even close.

Top 15 Least Expensive Locations by Median Sales Price in March 2021
1. Whitehall: $140,100
2. Newark CSD: $146,000
3. Lancaster CSD: $160,500
4. Hamilton LSD: $166,000
5. Groveport Madison LSD: $185,000
6. Jefferson LSD: $185,000
7. Reynoldsburg CSD: $205,250
8. Columbus CSD: $209,718
9. Circleville CSD: $210,000
10. Columbus: $217,000
11. Obetz: $227,420
12. South-Western CSD: $230,000
13. Johnstown-Monroe LSD: $230,000
14. London CSD: $251,000
15. Teays Valley LSD: $253,092

Whitehall remains the area’s biggest bargain. This inner suburb hasn’t always had the best reputation, but the city has been making efforts to improve both its commercial corridors and residential options. Columbus is relatively cheap compared to most of the metro, yet has by far the largest variety of options and neighborhood types to choose from.

Overall Market Median Sales Price in March 2021: $242,550
The overall market is defined by Columbus Metro Area counties.

Top 15 Locations with the Highest Median Sales Price % Growth Between March 2020 and March 2021
1. London CSD: +52.2%
2. Circleville CSD: +44.3%
3. New Albany Plain LSD: +32.5%
4. German Village: +29.4%
5. Obetz: +26.4%
6. Gahanna Jefferson CSD: +26.0%
7. Grandview Heights: +25.4%
8. Powell: +23.9%
9. Upper Arlington CSD: +23.8%
10. Lancaster CSD: +23.7%
11. Jonathan Alder LSD: +23.6%
12. Grove City: +22.0%
13. Gahanna: +21.9%
14. Teays Valley: +21.5%
15. Pickerington LSD: +20.8%
16. Pickerington: +20.8%

Top 15 Locations with the Lowest Median Sales Price % Growth Between March 2020 and March 2021
1. Johnstown Monroe LSD: -25.0%
2. Downtown Columbus: -14.5%
3. Granville LSD: -13.2%
4. Big Walnut LSD: -10.5%
5. Short North: -10.0%
6. Bexley: -6.1%
7. Minerva Park: -5.4%
8. Worthington: -5.0%
9. Hamilton LSD: -3.8%
10. Hilliard: +0.8%
11. New Albany: +1.7%
12. Newark CSD: +4.3%
13. Dublin CSD: +4.6%
14. Hilliard CSD: +5.5%
15. Dublin: +7.5%

Urban areas and some inner suburbs had either the biggest price declines or smallest increases in March vs. March 2020 as the fallout continued from Covid and protest-related activities. These declines may be seen by potential buyers as a positive from the high prices that otherwise continue, however.

Overall Market Median Sales Price % Change March 2021 vs. March 2020: +16.3%

Top 10 Locations with the Most New Listings in March 2021
1. Columbus: 1,156
2. Columbus CSD: 811
3. South-Western CSD: 187
4. Olentangy LSD: 161
5. Hilliard CSD: 138
6. Westerville CSD: 125
7. Dublin CSD: 125
8. Gahanna Jefferson CSD: 78
9. Dublin: 77
10. Upper Arlington CSD: 76

To no surprise, Columbus remains strongly at the top. There were about 300 more new listings in Columbus in March than in February as warmer weather prompted more sellers to put their homes on the market.

Top 10 Locations with the Fewest New Listings in March 2021
1. Valleyview: 0
2. Lithopolis: 2
3. Minerva Park: 2
4. Jefferson LSD: 8
5. Jonathan Alder: LSD: 11
6. Sunbury: 12
7. Grandview Heights: 12
8. Obetz: 12
9. Whitehall: 12
10. German Village: 13

Total New Listings in the Columbus Metro in March 2021: 2,797
Overall Metro New Listings % Change March 2021 vs March 2020: +3.3%
The small increase overall was pushed by big increases smaller counties like Perry, Pickaway and Union.


Top 10 Fastest-Selling Locations by # of Days Homes Remain on the Market Before Sale in March 2021
1. Canal Winchester CSD: 3
2. Johnstown-Monroe LSD: 4
3. Minerva Park: 6
4. Hilliard: 7
5. Jefferson LSD: 7
6. Gahanna: 8
7. Groveport Madison LSD: 8
8. Whitehall: 9
9. London CSD: 10
10. Jonathan Alder LSD: 11
11. Marysville CSD: 11
12. South-Western CSD: 11

Top 10 Slowest-Selling Locations by # of Days Homes Remain on the Market Before Sale in March 2021
1. Lithopolis: 59
2. Powell: 55
3. Downtown Columbus: 54
4. Short North: 52
5. Big Walnut LSD: 49
6. Lancaster CSD: 39
7. Olentangy LSD: 38
8. Dublin: 37
9. Grandview Heights: 36
10. Buckeye Valley LSD: 34

Top 10 Locations with the Greatest % Decline of # of Days on the Market Before Sale March 2021 vs March 2020
1. Johnstown-Monroe LSD: -92.7%
2. Canal Winchester CSD: -92.5%
3. Minerva Park: -90.2%
4. Jefferson LSD: -89.9%
5. Sunbury: -85.0%
6. Jonathan Alder LSD: -83.8%
7. New Albany: -81.9%
8. New Albany Plain LSD: -75.5%
9. Marysville CSD: -71.8%
10. Whitehall: -71.0%

Top 10 Locations with the Lowest % Decline of # of Days on the Market Before Sale March 2021 vs March 2020
1. Worthington CSD: +50.0%
2. Worthington: +38.5%
3. Powell: +12.2%
4. Lancaster CSD: +2.6%
5. Hilliard CSD: -4.3%
6. Obetz: -5.3%
7. Short North: -10.3%
8. Newark CSD: -14.3%
9. Downtown Columbus: -23.9%
10. Pataskala: -26.1%

% Change for the # of Days Homes Remain on the Market Before Sale Across the Metro Overall:
-24.5%

The market remained hot in March, with faster sales and higher prices than in the previous. Inventory did inch up some as spring arrived, but not nearly enough to counter overall demand. Urban areas are still a bit off their peaks from pre-Covid and protests, but seem to have recovered slightly from some previous months.

The previous housing market report and the Columbus Realtors site offers additional information on the Columbus market.


Housing Market Update January 2021


housing market update January 2021 Columbus, Ohio

The Columbus area housing market update January 2021 report is now available! Let’s be honest, the current housing market is extremely tough to navigate right now. This is true not so much for sellers, but rather buyers who are finding it nearly impossible to find a home they like at a good price in the neighborhood they want. There are relatively few homes available on the market, and those that are tend to get tangled in bidding wars that ultimately jack up the average sales price for the whole area.

The cause of this boils down to one critical problem- supply. There just aren’t enough existing homes to meet demand, nor are there nearly enough new homes being built. NIMBYism, local zoning and more issues are generally preventing increased home density in and around Columbus, keeping many potential homebuyers- and renters- struggling to find a place to live.

I haven’t done a breakdown of the Columbus real estate market in some time. Because of the current situation, I thought it would be a good time to take a fresh look.

The data below is from the January market report, the latest one available.

First, let’s look at those local areas that had the most homes for sale.

# of New Listings By County, January 2021
Franklin: 1,291
Delaware: 187
Licking: 157
Fairfield: 129
Union: 64
Pickaway: 47
Madison: 28
Morrow: 27
Perry: 20
Hocking: 16
Perhaps unsurprisingly, Franklin County has the most new listing by far.

Change of New Listings by County January 2020 vs. January 2021
Morrow: +8.0%
Fairfield: -5.8%
Licking: -6.5%
Franklin: -6.6%
Union: -7.2%
Perry: -13.0%
Madison: -20.0%
Pickaway: -23.0%
Delaware: -31.0%
Hocking: -42.9%
New listings were generally down across all but one metro county, a continuing story even before the pandemic.

Average Sales Price by County in January 2021
Delaware: $430,684
Union: $312,742
Fairfield: $265,821
Pickaway: $256,235
Franklin: $253,852
Licking: $234,116
Morrow: $232,393
Madison: $231,396
Perry: $219,053
Hocking: $208,231
All counties saw the average sale price of homes sold exceed the $200K mark, but Delaware County remains the most expensive place to buy a home in the metro.

Change in Average Sales Price by County January 2020 vs. January 2021
Perry: +53.7%
Pickaway: +36.4%
Fairfield: +25.9
Delaware: +23.5%
Franklin: +13.4%
Union: +12.0%
Madison: +9.6%
Licking: +9.0%
Morrow: +8.9%
Hocking: -7.6%
All but Hocking County saw significant year-over-year sales price increases of homes sold.

Now let’s take a look at individual communities. Which ones were the hottest in January 2021?

Local Communities/Areas by New Listings in January 2021
1. Columbus (Overall): 850
2. Columbus City School District (CSD): 579
3. South-Western CSD: 173
4. Olentangy Local School District (LSD) (Delaware): 95
5. Hilliard CSD: 92
6. Westerville CSD: 86
7. Grove City: 77
8. Dublin CSD: 68
9. Pickerington LSD: 59
10. Groveport Madison LSD (Franklin): 56
11. Worthington CSD: 51
12. Gahanna Jefferson CSD: 50
13. Newark CSD: 42
14. Lancaster CSD: 41
15. Delaware CSD: 40
16. Upper Arlington CSD: 40
17. Pataskala: 37
18. Beechwold/Clintonville: 35
19. Gahanna: 35
20. Westerville: 35
21. Hilliard: 35
22. Blacklick: 34
23. Marysville School District: 33
24. Reynoldsburg CSD: 32
25. Dublin: 31
26. Teays Valley LSD (Pickaway): 30
27. Downtown Columbus: 29
28. Pickerington: 27
29. New Albany Plain LSD: 24
30. Short North: 24
31. Big Walnut LSD (Franklin): 22
32. Powell: 22
33. Canal Winchester CSD: 19
34. London CSD: 15
35. German Village: 15
36. New Albany: 14
37. Hamilton LSD (Franklin): 14
38. Buckeye Valley LSD (Delaware: 13
39. Bexley: 11
40. Worthington: 11
41. Granville CSD: 11
42. Obetz: 8
43. Johnstown-Monroe LSD (Licking): 8
44. Circleville CSD: 7
45. Grandview Heights: 7
46. Sunbury: 7
47. Whitehall: 6
48. Jonathan Alder LSD (Madison): 6
49. Jefferson LSD (Madison: 5
50. Minverva Park: 2
51. Valleyview: 1
52. Lithopolis: 0
It’s pretty clear that the number of new listings falls off dramatically outside of Columbus proper. Only a handful of suburban areas had more than 50.


Average Sales Price January 2021, # of Homes Sold and % Change vs. January 2020
1. New Albany: $788,943: 14: +8.4%
2. New Albany Plain LSD: $669,455: 20: +10.2%
3. German Village $637,550: 10: +2.3%
4. Olentangy LSD $494,911: 96: +23.0%
5. Powell: $493,087: 11: +19.2%
6. Granville CSD: $492,045: 6: +31.3%
7. Dublin: $468,902: 37: +17.5%
8. Upper Arlington CSD: $462,594: 26: -9.2%
9. Bexley: $438,288: 13: -17.6%
10. Grandview Heights: $437,010: 6: +8.5%
11. Buckeye Valley LSD: $403,616: 20: +40.9%
12. Downtown: $384,230: 22: -36.4%
13. Dublin CSD: $378,788: 78: +11.8%
14. Johnstown-Monroe LSD: $375,598: 12: +110.8%
15. Short North: $360,830: 10: -8.7%
16. Jonathan Alder LSD: $340,887: 15: +20.7%
17. Big Walnut LSD: $337,550: 14: -8.8%
18. Gahanna Jefferson CSD: $335,621: 34: +19.7%
19. Blacklick: $325,445: 32: +39.7%
20. Sunbury: $318,980: 5: +39.1%
21. Pickerington LSD: $318,093: 40: +28.6%
22. Worthington: $316,625: 8: +7.0%
23. Teays Valley LSD: $315,316: 21: +52.5%
24. Beechwold/Clintonville: $300,780: 43: +15.4%
25. Hilliard: $297,387: 25: +0.9%
26. Worthington CSD: $294,236: 40: +17.5%
27. Pickerington: $282,044: 18: +13.0%
28. Westerville: $279,126: $279,126: -0.9%
29. Hilliard CSD: $277,377: 92: +5.9%
30. Canal Winchester CSD: $276,299: 17: +21.7%
31. Grove City: $272,378: 47: +17.8%
32. Minerva Park: $269,580: 5: +21.2%
33. Westerville CSD: $265,781: 68: -3.3%
34. Obetz: $260,825: 6: +26.4%
35. Gahanna: $255,650: 16: -2.1%
36. Marysville CSD: $254,363: 32: +17.8%
37. Hamilton LSD: $245,750: 4: +85.8%
38. Delaware CSD: $245,526: 31: +21.8%
39. Pataskala: $237,293: 18: +26.8%
40. Lithopolis: $228,125: 4: -1.4%
41. South-Western CSD: $227,266: 131: +17.9%
42. Columbus: $222,124: 761: +17.0%
43. Columbus CSD: $215,256: 507: +20.2%
44. Jefferson LSD: $210,225: 4: -35.5%
45. Reynoldsburg CSD: $203,965: 34: +9.0%
46. Lancaster CSD: $203,095: 44: +37.5%
47. Groveport Madison LSD: $194,690: 43: +30.3%
48. London CSD: $190,733: 14: +43.8%
49. Circleville CSD: $183,546: 13: +5.3%
50. Whitehall: $165,361: 11: +68.6%
51. Newark CSD: $143,241: 51: +15.9%
52. Valleyview: $120,000: 1: N/A
As stated above, most areas in the metro are priced above $200,000 for a house. Columbus overall is still one of the least expensive options. New Albany is really in a league all its own. It should be noted that many of these average price figures are based on relatively few sales. Because available inventory is so low, the average sales price is being pushed higher. However, it is certainly possible to find homes lower- and in some cases, much lower- than the average price. This is especially true in Columbus.

Finally, let’s look at how long for-sale homes actually stay on the market.

Average # of Days Listings Remain on the Market Until Sale, and % Change January 2020 to January 2021
1. Valleyview: 1: N/A No sales occurred in January 2020.
2. Gahanna: 9: -74.3%
3. Groveport Madison LSD: 9: -69.0%
4. Hamilton LSD: 9: -50.0%
5. Worthington: 9: -72.7%
6. Reynoldsburg CSD: 10: -68.8%
7. Obetz: 12: -71.4%
8. Hilliard: 13: -61.8%
9. Worthington CSD: 13: -56.7%
10. Circleville CSD: 14: -76.3%
11. Lithopolis: 14: -61.1%
12. Marysville CSD: 14: -63.2%
13. Minerva Park: 14: +133.3%
14. Pataskala: 14: -46.2%
15. New Albany: 15: -88.9%
16. New Albany Plain LSD: 15: -83.9%
17. Pickerington: 15: -71.7%
18. South-Western CSD: 15: -34.8%
19. Teays Valley LSD: 15: -58.3%
20. Canal Winchester CSD: 17: -73.0%
21. Whitehall: 17: -46.9%
22. Hilliard CSD: 18: -48.6%
23. Lancaster CSD: 18: -52.6%
24. Westerville CSD: 18: -47.1%
25. Delaware CSD: 19: -51.3%
26. Grove City: 19: -36.7%
27. Beechwold/Clintonville: 20: -53.5%
28. Columbus: 21: -30.0%
29. Westerville: 21: -27.6%
30. Newark CSD: 22: -31.3%
31. Pickerington LSD: 22: -45.0%
32. Dublin: 26: -55.9%
33. Buckeye Valley LSD: 27: -44.9%
34. Columbus CSD: 27: -18.2%
35. Dublin CSD: 27: -41.3%
36. Jefferson LSD: 27: -46.0%
37. London CSD: 27: -32.5%
38. Blacklick: 28: -12.5%
39. Grandview Heights: 28: -37.8%
40. Gahanna Jefferson CSD: 29: -23.7%
41. Johnstown Monroe LSD: 29: -12.1%
42. Sunbury: 29: +222.2%
43. Jonathan Alder LSD: 35: -10.3%
44. Short North: 35: -47.8%
45. Big Walnut LSD: 37: -54.3%
46. Bexley: 44: -18.5%
47. Upper Arlington CSD: 46: -17.9%
48. Olentangy LSD: 49: -16.9%
49. Powell: 52: -8.8%
50. Granville CSD: 54: -15.6%
51. German Village: 56: -38.5%
52. Downtown: 96: +242.9%
Only 2 places in the metro saw an increase, with the big one being Downtown. This was most likely due to a few factors- last year’s protests and the pandemic reducing demand close to Downtown jobs. I would expect it to recover somewhat this year and certainly next year. Overall, though, most places saw significant drops in how long homes lasted on the market. Given that these are averages, we know that there were plenty of instances of homes flying off the market in just a few days.

Furthermore, the actual inventory on the market is 30 days or less. This means that if no more homes became available for sale, all the homes on the market would sell out in less than a month. In many cases, the supply would run out in just a few weeks.

Certainly, all these numbers indicate that Columbus itself is still one of the best options for home buying given its lower costs and greater supply, but even there, homes are selling in just a few weeks on average. There’s really been no better time to sell in a long time, but also no worse time to buy. Hopefully, this data provides at least a little insight into the local market and where one might fight the greatest advantages in finding a home. My recommendation is to use every available resource- from realtors to social media- to aid in the search.

You can find full data reports at Columbus Realtors, and links to Columbus area resources at Columbus Links and Resources

Happy hunting!


Columbus Housing Market October 2013


Columbus Housing Market October 2013

The latest numbers for the Columbus housing market from Columbus Realtors.

LSD=Local school district
CSD=City school district

Top 15 Most Expensive Locations by Median Sales Price in October 2013
1. New Albany: $445,900
2. Upper Arlington CSD: $358,000
3. Downtown: $330,000
4. Powell: $305,000
5. Dublin: $302,125
6. Jefferson LSD: $292,500
7. Olentangy LSD: $288,500
8. Granville CSD: $272,000
9. New Albany Plain LSD: $262,500
10. Worthington: $249,900
11. Buckeye Valley LSD: $246,250
12. Big Walnut LSD: $238,500
13. Beechwold/Clintonville: $230,000
14. Bexley: $225,875
15. German Village: $217,500

Top 15 Least Expensive Locations by Median Sales Price in October 2013
1. Whitehall: $42,500
2. Lancaster CSD: $75,250
3. Hamilton LSD: $83,450
4. Columbus CSD: $84,200
5. Newark CSD: $87,450
6. Groveport Madison LSD: $90,150
7. London CSD: $94,500
8. South-Western CSD: $95,000
9. Columbus: $104,500
10. Circleville CSD: $110,250
11. Blacklick: $134,251
12. Obetz: $134,950
13. Canal Winchester CSD: $135,000
14. Grove City: $135,000
15. Reynoldsburg CSD: $136,200

Overall Metro Median Sales Price in October 2013: $149,302
Median Sales Price Change October 2012-October 2013: -$3,183

Top 15 Locations with the Highest Median Sales Price % Growth Between October 2012-October 2013
1. Hamilton LSD: +85.4%
2. Jefferson LSD: +69.8%
3. Downtown: +63.8%
4. Reynoldsburg CSD: +54.4%
5. Obetz: +51.8%
6. Jonathan Alder LSD: +50.4%
7. Sunbury: +36.5%
8. Beechwold/Clintonville: +28.6%
9. Westerville CSD: +20.2%
10. Minerva Park: +19.4%
11. Marysville CSD: +19.4%
12. Lithopolis: +19.0%
13. Northridge LSD: +17.4%
14. Circleville CSD: +16.7%
15. Granville CSD: +15.6%

Top 15 Locations with the Lowest Median Sales Price % Growth Between October 2012-October 2013
1. German Village: -16.3%
2. Lancaster CSD: -16.3%
4. Buckeye Valley LSD: -14.9%
5. New Albany Plain LSD: -14.6%
6. Canal Winchester CSD: -14.6%
7. Grandview Heights: -14.2%
8. Hilliard: -12.8%
9. South-Western CSD: -11.4%
10. London CSD: -11.3%
11. Dublin CSD: -10.8%
12. Dublin: -10.3%
13. Whitehall: -7.6%
14. Gahanna Jefferson CSD: -5.6%
15. Johnstown Monroe LSD: -3.7%

Overall Metro Median Price % Change October 2012-October 2013: -2.1%

Top 10 Locations with the Most New Listings in October 2013
1. Columbus: 1,107
2. Columbus CSD: 691
3. Westerville CSD: 177
4. South-Western CSD: 169
5. Hilliard CSD: 158
6. Olentangy LSD: 157
7. Dublin CSD: 123
8. Groveport Madison LSD: 91
9. Worthington CSD: 79
10. Dublin: 73

Top 10 Locations with the Fewest New Listings in October 2013
1. Valleyview: 0
2. Lithopolis: 0
3. Minerva Park: 2
4. Jefferson LSD: 5
5. Obetz: 5
6. Sunbury: 5
7. Northridge LSD: 9
8. Jonathan Alder LSD: 9
9. German Village: 9
10. Grandview Heights: 10

Overall Metro New Listings in October 2013: 2,693
New Listings % Change October 2012-October 2013: +5.9%

Top 10 Fastest-Selling Locations by # of Days Homes Remain on the Market Before Sale in October 2013
1. Johnstown Monroe LSD: 30
2. Powell: 31
3. Buckeye Valley LSD: 32
4. Grandview Heights: 39
5. Minerva Park: 42
6. Beechwold/Clintonville: 45
7. Northridge LSD: 45
8. Olentangy LSD: 46
9. Westerville: 46
10. Jonathan Alder LSD: 47

Top 10 Slowest-Selling Locations by # of Days Homes Remain on the Market Before Sale in March 2013
1. Circleville CSD: 118
2. London CSD: 107
3. Lancaster CSD: 106
4. Obetz: 105
5. Hamilton LSD: 96
6. New Albany CSD: 91
7. Granville CSD: 84
8. Jefferson LSD: 82
9. Big Walnut LSD: 81
10. Hilliard: 78
11. Reynoldsburg: CSD: 78

Overall Metro Average # of Days on Market Before Sale: 74.7

Top 10 Locations with the Best Change in # of Days on the Market Before Sale October 2012-October 2013
1. Lithopolis: +522.2%
2. Minerva Park: -77.25
3. Johnstown Monroe LSD: -74.6%
4. Buckeye Valley LSD: -71.7%
5. Jonathan Alder LSD: -69.1%
6. Grandview Heights: -64.2%
7. Powell: -62.7%
8. German Village: -61.2%
9. Northridge LSD: -54.5%
10. Pickerington LSD: -47.0%

Top 10 Locations with the Worst Change in the # of Days on the Market Before Sale October 2012-October 2013
1. Hamilton LSD: +190.9%
2. Obetz: +150.0%
3. Lancaster CSD: +86.0%
4. Sunbury: +50.0%
5. Circleville CSD: +45.7%
6. London CSD: +27.4%
7. New Albany: +14.6%
8. Worthington: +13.7%
9. Granville CSD: +9.1%
10. New Albany CSD: +8.3%

Overall Metro # of Days on Market Before Sale % Change October 2012-October 2013: -24.9%


Columbus Housing Market July 2013


Columbus housing market July 2013

In this edition of the Columbus Housing Market July 2013, we see from Columbus Realtorsthat the housing market has been pretty white hot, and metro area sales set monthly records in July with an increase over 28%. July also featured the 3rd highest sales of any month on record.

I looked at the 21 major areas of Franklin County (11 urban, 10 suburban). Here is what the July market looked like.

Top 10 July Sales Totals
1. Columbus: 1,055
2. Dublin: 95
3. Upper Arlington: 91
4. Clintonville: 85
5. Westerville: 68
6. Grove City: 66
7. Hilliard: 60
8. Reynoldsburg: 46
9. Gahanna: 42
10. Pickerington: 38

Top 10 July Sales Increases Over July 2012
1. Minerva Park: +300.0%
2. German Village: +154.5%
3. Grove City: +83.3%
4. Reynoldsburg: +70.4%
5. Canal Winchester: +60.0%
6. Whitehall: +55.6%
7. Pataskala: +41.2%
8. Clintonville: +37.1%
9. Columbus: +35.8%
10. New Albany: +32.0%

Top 10 Total YTD Sales Through July
1. Columbus: 6,072
2. Dublin: 480
3. Upper Arlington: 447
4. Clintonville: 423
5. Westerville: 375
6. Grove City: 363
7. Hilliard: 338
8. Gahanna: 315
9. Reynoldsburg: 310
10. Pickerington: 203

Top 10 YTD Sales Increases Through over July 2012
1. Whitehall: +42.7%
2. Hilliard: +42.0%
3. Bexley: +38.7%
4. Reynoldsburg: +36.6%
5. Pataskala: +35.9%
6. German Village: +34.7%
7. Pickerington: +34.4%
8. Minerva Park: +31.3%
9. Clintonville: +31.0%
10. Westerville: +29.8%

Average Sales July 2013
Urban: 124.7
Suburban: 50.4
Urban without Columbus: 31.7

Average % Change July 2013 vs. July 2012
Urban: +48.3%
Suburban: +35.0%
Urban without Columbus: +54.0%

Average Sales YTD Through July
Urban: 699.1
Suburban: 283.4
Urban without Columbus: 161.8

Average % Change YTD vs. YTD 2012 (Through July)
Urban: +19.7%
Suburban: +28.2%
Urban without Columbus: +18.8%

Top 10 Average Sales Price
1. New Albany: $563,891
2. Upper Arlington: $389,264
3. Bexley: $370,056
4. Dublin: $350,545
5. Downtown: $329,266
6. German Village: $325,721
7. Worthington: $272,706
8. Grandview Heights: $254,470
9. Hilliard: $240,506
10. Westerville: $209,706

Top 10 Average Sales Price % Increases vs. July 2012
1. Upper Arlington: +22.3%
2. Hilliard: +18.7%
3. Grandview Heights: +13.1%
4. Downtown: +12.5%
5. Pickerington: +12.4%
6. Pataskala: +11.6%
7. Canal Winchester: +11.3%
8. Worthington: +7.5%
9. Dublin: +6.7%
10. Columbus: +6.5%

Top 10 Average Sales Price YTD
1. New Albany: $545,545
2. Upper Arlington: $355,993
3. Bexley: $347,920
4. Dublin: $333,285
5. German Village: $310,179
6. Downtown: $285,807
7. Worthington: $243,009
8. Grandview Heights: $219,100
9. Hilliard: $218,104
10. Gahanna: $202,527

Top 10 Average YTD Sales Price % Change vs. YTD 2012
1. Whitehall: +33.5%
2. Downtown: +18.6%
3. Gahanna: +13.8%
4. Minerva Park: +13.0%
5. Upper Arlington: +12.4%
6. Reynoldsburg: +9.9%
7. New Albany: +9.1%
8. Hilliard: +5.5%
9. Gahanna: 5.0%
10. Canal Winchester: +4.9%

Average Price July 2013
Urban: $230,605
Suburban: $236,871
Urban without Columbus: $239,388

Average Price % Change vs. July 2012
Urban: +1.8%
Suburban: +6.3%
Urban without Columbus: +1.3%

Average Price YTD
Urban: $214,207
Suburban: $223,511
Urban without Columbus: $223,053

Average Price % Change YTD vs. YTD 2012
Urban: +6.3%
Suburban: +5.0%
Urban without Columbus: +6.6%

Top 10 Fastest Selling Markets July 2013 (based on # of Days listings sell)
1. Grandview Heights: 9
2. Obetz: 9
3. Hilliard: 25
4. Worthington: 26
5. Upper Arlington: 29
6. Bexley: 31
7. Westerville: 38
8. Reynoldsburg: 40
9. New Albany: 42
10. Clintonville: 44

Top 10 Fastest Selling Markets YTD
1. Worthington: 36
2. Grandview Heights: 47
3. Upper Arlington: 47
4. Clintonville: 56
5. Westerville: 56
6. Hilliard: 58
7. Dublin: 59
8. New Albany: 60
9. Gahanna: 62
10. Pataskala: 62

Average # of Days before Sale, July 2013
Urban: 49.8
Suburban: 48.7
Urban without Columbus: 48.8

Average # of Days before Sale, YTD
Urban: 64.6
Suburban: 62.3
Urban without Columbus: 64.4

Top 10 Lowest Housing Supplies (based on # of months to sell all listings), July 2013
1. Worthington: 1.9
2. Grandview Heights: 2.4
3. Upper Arlington: 2.4
4. Clintonville: 2.5
5. Hilliard: 2.7
6. Westerville: 2.8
7. Dublin: 3.1
8. Bexley: 3.2
9. Gahanna: 3.6
10. Downtown: 4.0

Average # of Months to Sell All Listings
Urban: 3.7
Suburban: 4.2
Urban without Columbus: 3.6

Average % Change of Single-Family Home Sales, July 2013 vs. July 2012
Urban: +55.0%
Suburban: +33.4%
Urban without Columbus: +58.0%

Average % Change of Condo Sales, July 2013 vs. July 2012
Urban: +78.4%
Suburban: +89.0%
Urban without Columbus: +82.3%

Average % Change of Single-Family Home Sales YTD vs. YTD 2012
Urban: +14.4%
Suburban: +28.5%
Urban without Columbus: +13.0%

Average % Change of Condo Sales YTD vs. YTD 2012
Urban: +42.8%
Suburban: +32.7%
Urban without Columbus: +44.0%

Seems like most areas are doing fairly well, including the urban core. Of course, these number do not measure rentals, which is what is really booming right now in the residential scene.