Housing Market Update January 2021


housing market update January 2021 Columbus, Ohio

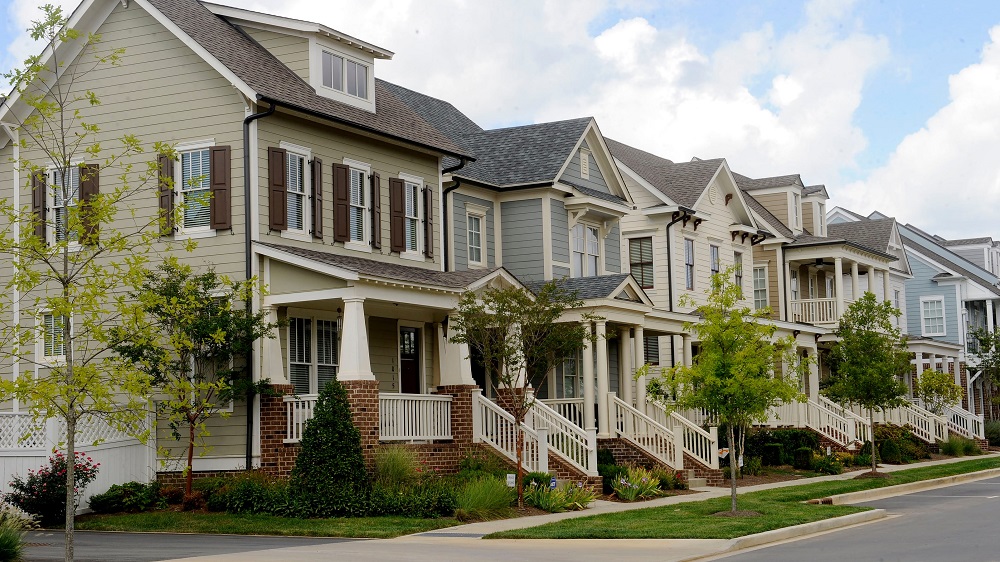
The Columbus area housing market update January 2021 report is now available! Let’s be honest, the current housing market is extremely tough to navigate right now. This is true not so much for sellers, but rather buyers who are finding it nearly impossible to find a home they like at a good price in the neighborhood they want. There are relatively few homes available on the market, and those that are tend to get tangled in bidding wars that ultimately jack up the average sales price for the whole area.

The cause of this boils down to one critical problem- supply. There just aren’t enough existing homes to meet demand, nor are there nearly enough new homes being built. NIMBYism, local zoning and more issues are generally preventing increased home density in and around Columbus, keeping many potential homebuyers- and renters- struggling to find a place to live.

I haven’t done a breakdown of the Columbus real estate market in some time. Because of the current situation, I thought it would be a good time to take a fresh look.

The data below is from the January market report, the latest one available.

First, let’s look at those local areas that had the most homes for sale.

# of New Listings By County, January 2021
Franklin: 1,291
Delaware: 187
Licking: 157
Fairfield: 129
Union: 64
Pickaway: 47
Madison: 28
Morrow: 27
Perry: 20
Hocking: 16
Perhaps unsurprisingly, Franklin County has the most new listing by far.

Change of New Listings by County January 2020 vs. January 2021
Morrow: +8.0%
Fairfield: -5.8%
Licking: -6.5%
Franklin: -6.6%
Union: -7.2%
Perry: -13.0%
Madison: -20.0%
Pickaway: -23.0%
Delaware: -31.0%
Hocking: -42.9%
New listings were generally down across all but one metro county, a continuing story even before the pandemic.

Average Sales Price by County in January 2021
Delaware: $430,684
Union: $312,742
Fairfield: $265,821
Pickaway: $256,235
Franklin: $253,852
Licking: $234,116
Morrow: $232,393
Madison: $231,396
Perry: $219,053
Hocking: $208,231
All counties saw the average sale price of homes sold exceed the $200K mark, but Delaware County remains the most expensive place to buy a home in the metro.

Change in Average Sales Price by County January 2020 vs. January 2021
Perry: +53.7%
Pickaway: +36.4%
Fairfield: +25.9
Delaware: +23.5%
Franklin: +13.4%
Union: +12.0%
Madison: +9.6%
Licking: +9.0%
Morrow: +8.9%
Hocking: -7.6%
All but Hocking County saw significant year-over-year sales price increases of homes sold.

Now let’s take a look at individual communities. Which ones were the hottest in January 2021?

Local Communities/Areas by New Listings in January 2021
1. Columbus (Overall): 850
2. Columbus City School District (CSD): 579
3. South-Western CSD: 173
4. Olentangy Local School District (LSD) (Delaware): 95
5. Hilliard CSD: 92
6. Westerville CSD: 86
7. Grove City: 77
8. Dublin CSD: 68
9. Pickerington LSD: 59
10. Groveport Madison LSD (Franklin): 56
11. Worthington CSD: 51
12. Gahanna Jefferson CSD: 50
13. Newark CSD: 42
14. Lancaster CSD: 41
15. Delaware CSD: 40
16. Upper Arlington CSD: 40
17. Pataskala: 37
18. Beechwold/Clintonville: 35
19. Gahanna: 35
20. Westerville: 35
21. Hilliard: 35
22. Blacklick: 34
23. Marysville School District: 33
24. Reynoldsburg CSD: 32
25. Dublin: 31
26. Teays Valley LSD (Pickaway): 30
27. Downtown Columbus: 29
28. Pickerington: 27
29. New Albany Plain LSD: 24
30. Short North: 24
31. Big Walnut LSD (Franklin): 22
32. Powell: 22
33. Canal Winchester CSD: 19
34. London CSD: 15
35. German Village: 15
36. New Albany: 14
37. Hamilton LSD (Franklin): 14
38. Buckeye Valley LSD (Delaware: 13
39. Bexley: 11
40. Worthington: 11
41. Granville CSD: 11
42. Obetz: 8
43. Johnstown-Monroe LSD (Licking): 8
44. Circleville CSD: 7
45. Grandview Heights: 7
46. Sunbury: 7
47. Whitehall: 6
48. Jonathan Alder LSD (Madison): 6
49. Jefferson LSD (Madison: 5
50. Minverva Park: 2
51. Valleyview: 1
52. Lithopolis: 0
It’s pretty clear that the number of new listings falls off dramatically outside of Columbus proper. Only a handful of suburban areas had more than 50.


Average Sales Price January 2021, # of Homes Sold and % Change vs. January 2020
1. New Albany: $788,943: 14: +8.4%
2. New Albany Plain LSD: $669,455: 20: +10.2%
3. German Village $637,550: 10: +2.3%
4. Olentangy LSD $494,911: 96: +23.0%
5. Powell: $493,087: 11: +19.2%
6. Granville CSD: $492,045: 6: +31.3%
7. Dublin: $468,902: 37: +17.5%
8. Upper Arlington CSD: $462,594: 26: -9.2%
9. Bexley: $438,288: 13: -17.6%
10. Grandview Heights: $437,010: 6: +8.5%
11. Buckeye Valley LSD: $403,616: 20: +40.9%
12. Downtown: $384,230: 22: -36.4%
13. Dublin CSD: $378,788: 78: +11.8%
14. Johnstown-Monroe LSD: $375,598: 12: +110.8%
15. Short North: $360,830: 10: -8.7%
16. Jonathan Alder LSD: $340,887: 15: +20.7%
17. Big Walnut LSD: $337,550: 14: -8.8%
18. Gahanna Jefferson CSD: $335,621: 34: +19.7%
19. Blacklick: $325,445: 32: +39.7%
20. Sunbury: $318,980: 5: +39.1%
21. Pickerington LSD: $318,093: 40: +28.6%
22. Worthington: $316,625: 8: +7.0%
23. Teays Valley LSD: $315,316: 21: +52.5%
24. Beechwold/Clintonville: $300,780: 43: +15.4%
25. Hilliard: $297,387: 25: +0.9%
26. Worthington CSD: $294,236: 40: +17.5%
27. Pickerington: $282,044: 18: +13.0%
28. Westerville: $279,126: $279,126: -0.9%
29. Hilliard CSD: $277,377: 92: +5.9%
30. Canal Winchester CSD: $276,299: 17: +21.7%
31. Grove City: $272,378: 47: +17.8%
32. Minerva Park: $269,580: 5: +21.2%
33. Westerville CSD: $265,781: 68: -3.3%
34. Obetz: $260,825: 6: +26.4%
35. Gahanna: $255,650: 16: -2.1%
36. Marysville CSD: $254,363: 32: +17.8%
37. Hamilton LSD: $245,750: 4: +85.8%
38. Delaware CSD: $245,526: 31: +21.8%
39. Pataskala: $237,293: 18: +26.8%
40. Lithopolis: $228,125: 4: -1.4%
41. South-Western CSD: $227,266: 131: +17.9%
42. Columbus: $222,124: 761: +17.0%
43. Columbus CSD: $215,256: 507: +20.2%
44. Jefferson LSD: $210,225: 4: -35.5%
45. Reynoldsburg CSD: $203,965: 34: +9.0%
46. Lancaster CSD: $203,095: 44: +37.5%
47. Groveport Madison LSD: $194,690: 43: +30.3%
48. London CSD: $190,733: 14: +43.8%
49. Circleville CSD: $183,546: 13: +5.3%
50. Whitehall: $165,361: 11: +68.6%
51. Newark CSD: $143,241: 51: +15.9%
52. Valleyview: $120,000: 1: N/A
As stated above, most areas in the metro are priced above $200,000 for a house. Columbus overall is still one of the least expensive options. New Albany is really in a league all its own. It should be noted that many of these average price figures are based on relatively few sales. Because available inventory is so low, the average sales price is being pushed higher. However, it is certainly possible to find homes lower- and in some cases, much lower- than the average price. This is especially true in Columbus.

Finally, let’s look at how long for-sale homes actually stay on the market.

Average # of Days Listings Remain on the Market Until Sale, and % Change January 2020 to January 2021
1. Valleyview: 1: N/A No sales occurred in January 2020.
2. Gahanna: 9: -74.3%
3. Groveport Madison LSD: 9: -69.0%
4. Hamilton LSD: 9: -50.0%
5. Worthington: 9: -72.7%
6. Reynoldsburg CSD: 10: -68.8%
7. Obetz: 12: -71.4%
8. Hilliard: 13: -61.8%
9. Worthington CSD: 13: -56.7%
10. Circleville CSD: 14: -76.3%
11. Lithopolis: 14: -61.1%
12. Marysville CSD: 14: -63.2%
13. Minerva Park: 14: +133.3%
14. Pataskala: 14: -46.2%
15. New Albany: 15: -88.9%
16. New Albany Plain LSD: 15: -83.9%
17. Pickerington: 15: -71.7%
18. South-Western CSD: 15: -34.8%
19. Teays Valley LSD: 15: -58.3%
20. Canal Winchester CSD: 17: -73.0%
21. Whitehall: 17: -46.9%
22. Hilliard CSD: 18: -48.6%
23. Lancaster CSD: 18: -52.6%
24. Westerville CSD: 18: -47.1%
25. Delaware CSD: 19: -51.3%
26. Grove City: 19: -36.7%
27. Beechwold/Clintonville: 20: -53.5%
28. Columbus: 21: -30.0%
29. Westerville: 21: -27.6%
30. Newark CSD: 22: -31.3%
31. Pickerington LSD: 22: -45.0%
32. Dublin: 26: -55.9%
33. Buckeye Valley LSD: 27: -44.9%
34. Columbus CSD: 27: -18.2%
35. Dublin CSD: 27: -41.3%
36. Jefferson LSD: 27: -46.0%
37. London CSD: 27: -32.5%
38. Blacklick: 28: -12.5%
39. Grandview Heights: 28: -37.8%
40. Gahanna Jefferson CSD: 29: -23.7%
41. Johnstown Monroe LSD: 29: -12.1%
42. Sunbury: 29: +222.2%
43. Jonathan Alder LSD: 35: -10.3%
44. Short North: 35: -47.8%
45. Big Walnut LSD: 37: -54.3%
46. Bexley: 44: -18.5%
47. Upper Arlington CSD: 46: -17.9%
48. Olentangy LSD: 49: -16.9%
49. Powell: 52: -8.8%
50. Granville CSD: 54: -15.6%
51. German Village: 56: -38.5%
52. Downtown: 96: +242.9%
Only 2 places in the metro saw an increase, with the big one being Downtown. This was most likely due to a few factors- last year’s protests and the pandemic reducing demand close to Downtown jobs. I would expect it to recover somewhat this year and certainly next year. Overall, though, most places saw significant drops in how long homes lasted on the market. Given that these are averages, we know that there were plenty of instances of homes flying off the market in just a few days.

Furthermore, the actual inventory on the market is 30 days or less. This means that if no more homes became available for sale, all the homes on the market would sell out in less than a month. In many cases, the supply would run out in just a few weeks.

Certainly, all these numbers indicate that Columbus itself is still one of the best options for home buying given its lower costs and greater supply, but even there, homes are selling in just a few weeks on average. There’s really been no better time to sell in a long time, but also no worse time to buy. Hopefully, this data provides at least a little insight into the local market and where one might fight the greatest advantages in finding a home. My recommendation is to use every available resource- from realtors to social media- to aid in the search.

You can find full data reports at Columbus Realtors, and links to Columbus area resources at Columbus Links and Resources

Happy hunting!


Columbus Housing Market April 2013


Columbus housing market April 2013 Columbus, Ohio

The Columbus Board of Realtors released home sales data for April and YTD recently. Their area covers an area a bit larger than the Columbus metro, so I tried to stick with just those areas within it. I also tried to avoid capturing essentially the same area (school district vs city boundary). There are a few exceptions where I wanted to highlight specific areas or neighborhoods of Columbus.

LSD=Local school district
CSD=City school district

Top 10 Home Sales % Change since April 2012
1. Bexley city: +137.5%
2. Sunbury city: +125.0%
3. Delaware LSD: +82.4%
4. Lancaster CSD: +74.2%
5. Hilliard city: +66.7%
6. Marysville CSD: +64.3%
7. Pataskala city: +57.1%
8. London CSD: +50.0%
9. Upper Arlington CSD: +48.9%
10. South-Western CSD: +47.8%

Top 10 Home Sales % Change 2013 Year to Date
1. Sunbury city: +78.6%
2. Lithopolis city: +66.7%
3. Bexley city: +50.0%
4. Gahanna city: +46.1%
5. Hilliard city: +45.5%
6. Delaware CSD: +44.3%
7. Westerville city: +40.3%
8. Whitehall city: +37.5%
9. Marysville CSD: +36.7%
10. Lancaster CSD: +36.0%

Bottom 10 Home Sales % Change since April 2012
1. Powell city: -55.6%
2. Minerva Park city: -50.0%
3. Whitehall city: -42.9%
4. German Village: -36.4%
5. Downtown: -29.6%
6. Obetz city: -20.0%
7. New Albany city: -14.3%
8. Worthington city: -12.5%
9. Grandview Heights city: -11.1%
10. Circleville CSD: -11.1%

Bottom 10 Home Sales % Change 2013 Year to Date
1. Obetz city: -61.9%
2. Granville CSD: -31.3%
3. Worthington city: -11.3%
4. New Albany city: -5.8%
5. Grandview Heights city: -3.7%
6. Valleyview city: 0.0%
7. Powell city: +3.7%
8. Canal Winchester CSD: +3.9%
9. Newark CSD: +10.1%
10. Johnstown CSD: +11.5%

So it looks like, so far… in the urban core, Bexley, Upper Arlington and Whitehall are all having a good sales year, while Worthington and Grandview Heights are not. Downtown had a bad April, but is doing well for the year. Same with German Village. Suburbs performing well include Delaware, Hilliard and Sunbury. Those performing badly include New Albany and Powell.

Top 10 Turnover (Average # of Days on the Market before Sold) in April 2013
1. Valleyview city: 0 Days
2. Plain City CSD: 25 Days
3. Sunbury city: 27 Days
4. German Village: 29 Days
4. Obetz city: 29 Days
4. Worthington city: 29 Days
5. Powell city: 43 Days
6. Upper Arlington CSD: 47 Days
7. Beechwold/Clintonville: 49 Days
8. Gahanna city: 52 Days
8. Pataskala city: 52 Days
9. Lithopolis city: 54 Days
10. Grandview Heights city: 56 Days

Bottom 10 Turnover for April 2013
1. Circleville CSD: 164 Days
2. London CSD: 131 Days
3. Newark CSD: 123 Days
4. Minerva Park city: 116 Days
5. Downtown: 105 Days
6. Marysville CSD: 102 Days
7. Lancaster CSD: 98 Days
8. Delaware CSD: 92 Days
9. Blacklick: 88 Days
10. Bexley city: 80 Days

Top 10 Turnover 2013 Year to Date
1. Worthington city: 42 Days
2. Plain City CSD: 46 Days
3. Obetz city: 48 Days
4. Upper Arlington CSD: 60 Days
5. Pickerington city: 65 Days
6. Pataskala city: 67 Days
6. Whitehall city: 67 Days
7. Beechwold/Clintonville: 68 Days
7. Grandview Heights city: 68 Days
7. Minerva Park city: 68 Days
8. Groveport LSD: 69 Days
8. Reynoldsburg LSD: 69 Days
8. South Western CSD: 69 Days
9. German Village: 70 Days
9. Powell city: 70 Days
9. Westerville city: 70 Days
9. Worthington city: 70 Days
10. Columbus city: 72 Days

Bottom 10 Turnover 2013 Year to Date
1. Valleyview city: 151 Days
2. Circleville CSD: 148 Days
3. Newark CSD: 117 Days
4. London CSD: 115 Days
5. Bexley city: 97 Days
6. Lancaster CSD: 96 Days
7. Delaware CSD: 90 Days
7. Hilliard city: 90 Days
7. New Albany city: 90 Days
8. Johnstown LSD: 89 Days
9. Downtown: 87 Days
9. Lithopolis city: 87 Days
9. Marysville CSD: 87 Days
10. West Jefferson LSD: 86 Days

# of Months Total On-Market Housing Supply Would Last if No Other Homes Became Available, April 2013- Top 10
1. Valleyview city: 1.6 Months
2. Worthington city: 1.8 Months
3. Grandview Heights city: 2.0 Months
4. Upper Arlington CSD: 2.3 Months
5. Sunbury city: 2.5 Months
6. Hilliard city: 2.7 Months
7. Beechwold/Clintonville: 2.8 Months
8. Powell city: 2.9 Months
8. Westerville city: 2.9 Months
9. Gahanna city: 3.1 Months
10. Johnstown LSD: 3.2 Months

And Bottom 10
1. Granville CSD: 9.2 Months
2. London CSD: 8.7 Months
3. Circleville CSD: 8.6 Months
4. Newark CSD: 7.4 Months
5. Pataskala city: 5.9 Months
6. Lancaster CSD: 5.8 Months
7. Obetz city: 5.0 Months
8. South Western CSD: 4.8 Months
9. Canal Winchester CSD, Marysville CSD, New Albany city, Reynoldsburg CSD: 4.6 Months
10. Columbus city, Grove City city: 4.5 Months

With the supply numbers, generally anything around 5 months is considered a healthy supply. Well over and the market is saturated, well under it’s undersupplied. For the record, Downtown’s supply is 4.1 months.

Top 10 Average Sales Price % Change Year to Date
1. Valleyview city: +52.3%
2. Circleville CSD: +29.8%
3. Johnstown LSD: +26.7%
4. Minerva Park city: +23.7%
5. Gahanna city: +22.6%
6. Marysville CSD: +22.3%
7. Downtown: +19.9%
8. Lancaster CSD: +17.6%
9. Reynoldsburg CSD: +14.0%
10. Bexley city: +11.3%

Bottom 10
1. Grandview Heights city: -26.1%
2. Pataskala city: -22.3%
3. Obetz city: -15.6%
4. Granville CSD: -10.9%
5. Sunbury city: -10.8%
6. Blacklick: -10.5%
7. German Village: -5.3%
8. New Albany city: -3.5%
9. Westerville city: -3.2%
10. Plain City LSD: -1.9%

If you don’t see a market listed you’re curious about, check out the April 2013 Market Report may have what you’re looking for.


Housing Market Update March 2013


housing market update March 2013

This Columbus housing market update for March 2013 includes an expansion of data, specifically the time it takes for homes to sell on the current market.

Note: LSD= Local School District, CSD= City School District. In both cases, school district boundaries differ from city boundaries.

Top 15 Most Expensive Locations By Median Sales Price in March 2013
1. New Albany: $471,000
2. Dublin: $330,000
3. Powell: $317,000
4. New Albany Plain LSD: $316,000
5. Upper Arlington CSD: $302,450
6. Olentangy LSD: $291,250
7. Granville CSD: $282,050
8. Downtown: $269,000
9. German Village: $267,250
10. Dublin CSD: $266,500
11. Hilliard: $250,000
12. Big Walnut LSD: $245,000
13. Buckeye Valley LSD: $243,000
14. Johnstown Monroe LSD: $207,250
15. Bexley: $205,000

Top 15 Least Expensive Locations by Median Sales Price in March 2013
1. Whitehall: $45,250
2. Obetz: $56,450
3. Groveport Madison LSD: $63,625
4. Hamilton LSD: $66,750
5. Columbus CSD: $85,000
6. Lancaster CSD: $89,550
7. Newark CSD: $89,900
8. South-Western CSD: $100,000
9. Columbus: $103,250
10. Sunbury: $106,900
11. Reynoldsburg CSD: $115,000
12. Jefferson LSD: $122,000
13. Blacklick: $123,500
14. London CSD: $128,000
15. Grandview Heights: $136,000

Whitehall was the cheapest market yet again, though its median prices have been going up slowly.

Overall Market Median Sales Price in March 2013: $139,028

Top 15 Locations with the Highest Median Sales Price % Growth Between March 2012 and March 2013
1. Minerva Park: +223.8%
2. Jonathan Alder LSD: +99.0%
3. Circleville CSD: +63.3%
4. Buckeye Valley LSD: +59.3%
5. Johnstown Monroe LSD: +53.5%
6. Reynoldsburg CSD: +47.4%
7. Hilliard: +47.1%
8. Downtown: +34.6%
9. Big Walnut LSD: +31.5%
10. Westerville CSD: +28.3%
11. Powell: +28.1%
12. Gahanna: +22.0%
13. Olentangy LSD: +18.4%
14. Marysville CSd: +14.8%
15. Worthington: +13.9%

Downtown continued to do well, but otherwise few places inside 270 did.

Top 15 Locations with the Lowest Median Sales Price % Growth Between March 2012 and March 2013
1. Grandview Heights: -43.7%
2. Sunbury: -42.6%
3. Obetz: -29.3%
4. Whitehall: -24.3%
5. Bexley: -21.1%
6. Lithopolis: -20.1%
7. Hamilton LSD: -15.8%
8. Blacklick: -12.0%
9. Pataskala: -9.2%
10. Delaware CSD: -5.3%
11. Gahanna Jefferson CSD: -5.1%
12. Beechwold/Clintonville: -4.1%
13. South-Western CSD: -2.9%
14. London CSD: -1.9%
15. Columbus CSD: -1.0%

Overall Market Median Sales Price % Change March 2012 vs. March 2013: +9.9%

Top 10 Locations with the Most New Listings in March 2013
1. Columbus: 1,309
2. Columbus CSD: 811
3. South-Western CSD: 221
4. Olentangy LSD: 197
5. Hilliard CSD: 195
6. Westerville CSD: 185
7. Dublin CSD: 140
8. Pickerington LSD: 100
9. Worthington CSD: 97
10. Dublin: 93

Top 10 Locations with the Fewest New Listings in March 2013
1. Valleyview: 1
2. Lithopolis: 2
3. Minerva Park: 4
4. Jefferson LSD: 6
5. Johnstown Monroe LSD: 8
6. Jonathan Alder LSD: 9
7. Obetz: 10
8. Hamilton LSD: 13
9. Grandview Heights: 14
10. Sunbury: 17
11. Circleville CSD: 17

Total New Listings in the Columbus Metro in March 2013: 3,222
Overall Metro New Listings % Change March 2012-March 2013: +0.2%

Prices were up almost 10% year over year for the month despite a small increase in overall supply.

Top 10 Fastest-Selling Locations by # of Days Homes Remain on the Market Before Sale in March 2013
1. Minerva Park: 3
2. Worthington: 29
3. Granville CSD: 35
4. Jonathan Alder LSD: 36
5. Upper Arlington CSD: 51
6. Downtown: 54
7. Pickerington: 54
8. Pickerington LSD: 60
9. Dublin CSD: 61
10. Grandview Heights: 63
11. Groveport Madison LSD: 63
12. Reynoldsburg CSD: 63
13. South-Western CSD: 63
14. Grove City: 65
15. Powell: 65

Top 10 Slowest-Selling Locations by # of Days Homes Remain on the Market Before Sale in March 2013
1. Bexley: 188
2. Circleville CSD: 168
3. Sunbury: 163
4. Lancaster CSD: 140
5. Big Walnut LSD: 129
6. Hilliard: 125
7. Lithopolis: 121
8. Newark CSD: 120
9. Obetz: 119
10. Gahanna: 117

The Columbus Realtors provides market condition reports going back many years.


Housing Market Update January 2013


housing market update January 2013

Columbus housing market update January 2013

We’re starting a new year in this edition of the Columbus Housing Market Update, with new January 2013 data now available!

Note: LSD= Local School District, CSD= City School District. In both cases, school district boundaries differ from city boundaries.

Top 15 Most Expensive Locations By Median Sales Price in January 2013
1. New Albany: $447,500
2. Powell: $342,500
3. Upper Arlington CSD: $320,000
4. New Albany Plain LSD: $314,400
5. Dublin: $284,00
6. Bexley: $269,950
7. Olentangy LSD: $250,101
8. German Village: $241,618
9. Worthington: $228,938
10. Grandview Heights: $223,000
11. Downtown: $210,000
12. Granville CSD: $207,000
13. Dublin CSD: $190,450
14. Big Walnut LSD: $187,000
15. Marysville CSD: $182,000

New Albany continued to be the most expensive market.

Top 15 Least Expensive Locations by Median Sales Price in January 2013
1. Whitehall: $29,750
2. Hamilton LSD: $54,500
3. Columbus CSD: $68,500
4. Groveport Madison LSD: $70,000
5. Lancaster CSD: $71,250
6. Valleyview: $79,850
7. Newark CSD: $84,500
8. Reynoldsburg CSD: $94,500
9. Columbus: $95,000
10. Jefferson LSD: $95,000
11. South-Western CSD: $103,000
12. Circleville CSD: $109,000
13. Canal Winchester CSD: $112,000
14. Pataskala: $120,000
15. London CSD: 122,000

Whitehall was by far the cheapest market to buy into this month.

Overall Market Median Sales Price in January 2013: $120,885

Top 15 Locations with the Highest Median Sales Price % Growth Between January 2012 and January 2013
1. Newark CSD: +83.3%
2. Valleyview: +76.5%
3. Lithopolis: +71.1%
4. Circleville CSD: +61.4%
5. Groveport Madison LSD: +60.9%
6. Marysville CSD: +38.8%
7. London CSD: +34.8%
8. New Albany: +29.7%
9. Columbus CSD: +28.0%
10. Grandview Heights: +27.4%
11. Columbus: +26.7%
12. Upper Arlington CSD: +24.3%
13. Downtown: +19.3%
14. Sunbury: +18.4%
15. South-Western CSD: +16.1%

Downtown and Columbus overall made the top markets for appreciation in the past year.

Top 15 Locations with the Lowest Median Sales Price % Growth Between January 2012 and January 2013
1. Granville CSD: -50.7%
2. Jonathan Alder LSD: -33.0%
3. Westerville: -29.2%
4. Dublin CSD: -23.3%
5. Hamilton LSD: -21.6%
6. Jefferson LSD: -20.8%
7. Big Walnut LSD: -19.7%
8. Bexley: -17.6%
9. Gahanna: -17.0%
10. Johnstown Monroe LSD: -16.2%
11. Westerville CSD: -14.8%
12. Worthington CSD: -12.5%
13. German Village: -10.5%
14. Grove City: -6.4%
15. Whitehall: -4.9%

Overall Market Median Sales Price % Change January 2012 vs. January 2013: +8.6%

Top 10 Locations with the Most New Listings in January 2013
1. Columbus: 957
2. Columbus CSD: 605
3. South-Western CSD: 210
4. Olentangy LSD: 146
5. Hilliard CSD: 126
6. Westerville CSD: 109
7. Dublin CSD: 94
8. Pickerington LSD: 81
9. Grove City: 66
10. Groveport Madison LSD: 65

Top 10 Locations with the Fewest New Listings in January 2013
1. Valleyview: 1
2. Minerva Park: 1
3. Lithopolis: 2
4. Jefferson LSD: 3
5. Obetz: 6
6. Jonathan Alder LSD: 8
7. Grandview Heights: 9
8. Sunbury: 10
9. Johnstown Monroe LSD: 10
10. Hamilton LSD: 12
11. Whitehall: 15

Total New Listings in the Columbus Metro in January 2013: 2,388
Overall Metro New Listings % Change January 2012-January 2013: -3.7%

This month, prices increased as overall supply slipped.

For more information on the local market, go here: Columbus Realtors


Housing Market Update December 2012


housing market update December 2012

In a first of its kind, this is the Columbus housing market update for December 2012. In it, the local housing market will be detailed by categories such as most expensive market, market listing rankings and more.

Note: LSD= Local School District, CSD= City School District. In both cases, school district boundaries differ from city boundaries.

Top 15 Most Expensive Locations By Median Sales Price in December 2012
1. New Albany: $535,000
2. New Albany Plain LSD: $397,450
3. German Village: $376,000
4. Grandview Heights: $362,500
5. Powell: $354,950
6. Dublin: $343,600
7. Granville CSD: $330,000
8. Bexley: $325,000
9. Upper Arlington CSD: $319,500
10. Olentangy LSD: $315,000
11. Big Walnut LSD: $306,250
12. Dublin CSD: $271,500
13. Worthington: $$270,000
14. Buckeye Valley LSD: $259,000
15. Sunbury: $253,000

New Albany was by far the most expensive local market around Columbus.

Top 15 Least Expensive Locations by Median Sales Price in December 2012
1. Obetz: $80,100
2. Hamilton LSD: $80,100
3. Whitehall: $85,950
4. Newark CSD: $86,900
5. Lancaster CSD: $103,000
6. Jefferson LSD: $123,000
7. London CSD: $124,000
8. Groveport Madison LSD: $125,900
9. Reynoldsburg CSD: $125,950
10. Columbus CSD: $129,900
11. South-Western CSD: $131,000
12. Columbus: $140,026
13. Jonathan Alder LSD: $150,000
14. Minerva Park: $159,500
15. Grove City: $160,950

Southern and eastern suburbs tend to perform best on this list, as well as Columbus itself.

Overall Market Median Sales Price in December 2012: $158,645

Top 15 Locations with the Highest Median Sales Price % Growth Between December 2011 and December 2012
1. Whitehall: +69.5%
2. Circleville CSD: +64.9%
3. Sunbury: +63.0%
4. Jefferson LSD: +53.5%
5. Big Walnut LSD: +44.1%
6. Canal Winchester CSD: +40.9%
7. Westerville: +29.8%
8. Westerville CSD: +27.3%
9. Powell: +25.4%
10. Pataskala: +24.0%
11. Olentangy LSD: +23.5%
12. Gahanna Jefferson CSD: +21.8%
13. Grandview Heights: +21.2%
14. Granville CSD: +20.0%
15. Pickerington: +17.7%

Top 15 Locations with the Lowest Median Sales Price % Growth Between December 2011 and December 2012
1. London CSD: -53.5%
2. Obetz: -38.3%
3. Hamilton LSD: -27.1%
4. Jonathan Alder LSD: -25.2%
5. Buckeye Valley LSD: -23.0%
6. Reynoldsburg CSD: -18.7%
7. Hilliard: -17.7%
8. Lancaster CSD: -17.6%
9. Grove City: -15.3%
10. Dublin CSD: -12.8%
11. Johnstown Monroe LSD: -10.8%
12. Upper Arlington CSD: -8.5%
13. Newark CSD: -8.1%
14. Dublin: -7.1%
15. South-Western CSD: -6.4%

Overall Market Median Sales Price % Change December 2011 vs. December 2012: -0.3%

Top 10 Locations with the Most New Listings in December 2012
1. Columbus: 829
2. Columbus CSD: 544
3. South-Western CSD: 136
4. Olentangy LSD: 122
5. Westerville CSD: 100
6. Hilliard CSD: 94
7. Dublin CSD: 89
8. Worthington CSD: 66
9. Dublin: 64
10. Pickerington LSD: 60

Top 10 Locations with the Fewest New Listings in December 2012
1. Valleyview: 0
2. Lithopolis: 1
3. Sunbury: 2
4. Minerva Park: 2
5. Obetz: 3
6. Johnstown Monroe LSD: 5
7. Jefferson LSD: 8
8. German Village: 8
9. Hamilton LSD: 8
10. Whitehall: 11
11. Granville CSD: 12

Total New Listings in the Columbus Metro in December 2012: 2,002
Overall Metro New Listings % Change December 2011-December 2012: +10.5%

Overall, prices are slightly down as supply is currently outstripping demand.

For more information on the local market, go here: Columbus Realtors