Why Columbus Doesn’t Have Rail Part 1


Why Columbus doesn't have rail part 1

Rail in some form existed in Columbus from the 1850s through the mid-1970s. For generations, rail travel was the way to go. It was the connector of distances, the driver of local and state economies. On the local scale, it brought folks to and from their city’s downtown areas for shopping and employment, and the trolley, interurban and other rail systems were as prolific as the horse and buggy before them. So what happened? In this Why Columbus Doesn’t Have Rail Part 1, we will review all of the history of rail travel within the city.

Most people today are aware of the Union Station that existed on High Street where the Convention Center is now, but there were actually 2 more depots that proceeded it.
Columbus got it’s first real taste of rail travel in 1851, when the Columbus Union Depot opened, a year after the city’s first railroad, the Columbus & Xenia, entered the city. It was followed by the Cleveland, Columbus & Cincinnati Railroad in 1851. Both railroads wanted their depots to be as close to the downtown area as possible, as this was the center of the city’s population and commercial activity. At the time, the city was significantly smaller than it is now. Today, Chestnut and Naughten Streets are within the heart of Downtown, but in the early 1850s, there was almost no development north of these streets, so the two railroads collaborated and purchased a plot of land at the northeastern corner of the North High Street and Naughten intersection, about where the Hyatt Regency is today. This would be the location of their new terminal, the Columbus Union Depot.

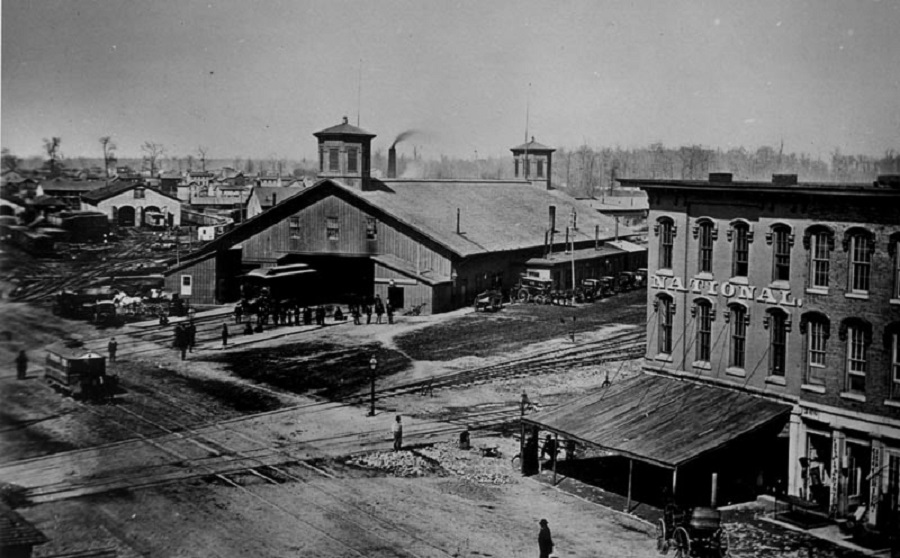
The first Union Station that operated between 1851-1875.

This was the first depot in the city and resembled a barn, in some ways similar to the first North Market building that would go up nearby. It was built to handle 3 railroads but by the early 1870s was handling the traffic of 5, well exceeding capacity. Beyond the inadequate size, the depot’s trains dangerously and regularly blocked traffic on High Street, much to the anger of many residents. The push for a new depot began.

Plans were approved in 1871 for the new depot and it was completed and opened in February 1875, with the old depot torn down and many of the old tracks relocated/rerouted to the much larger depot, now located further east of the old depot location, just north of Naughten. Not only was it much larger, but much grander in design. No longer a giant, single story barn, it was instead a 3-story red brick structure and had many architectural features that the previous depot lacked. Tracks still crossed High, but a 160-ft tunnel underneath helped to relieve congestion. For years, this new setup solved many of the previous problems, but a steady increase in train traffic (there were over 120 daily trains by the early 1890s), as well as pedestrian and horse and buggy traffic getting too and from the depot began to cause major problems in the area once more. A new depot was once again needed.

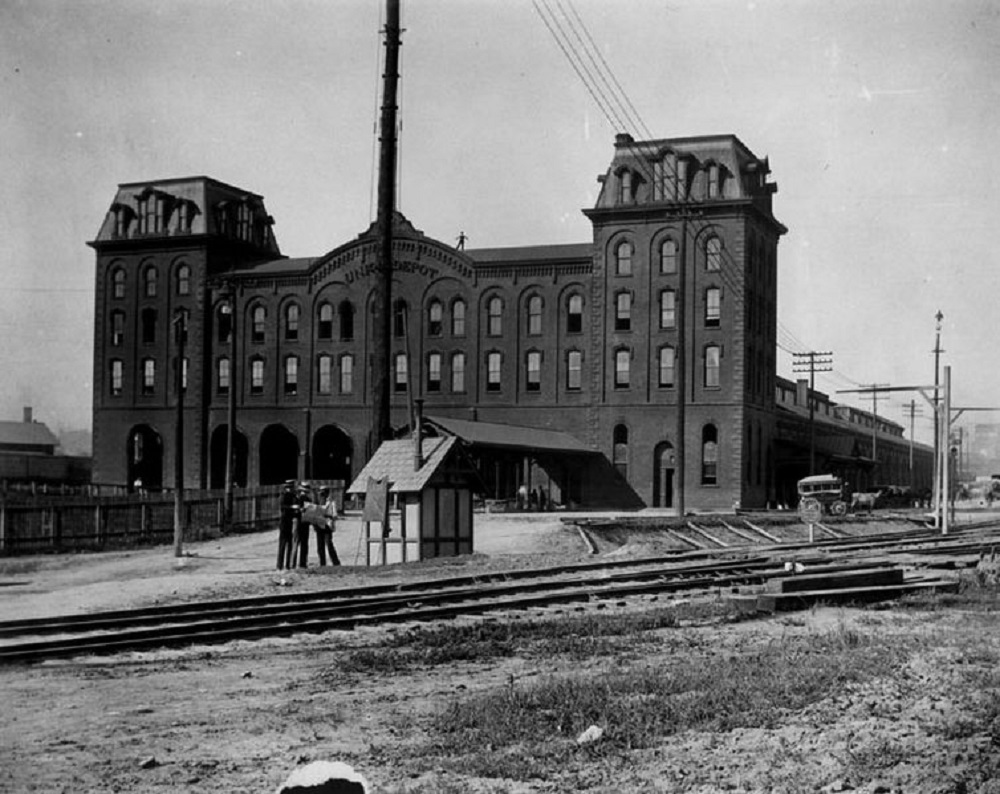
Union Station 1875-1897.


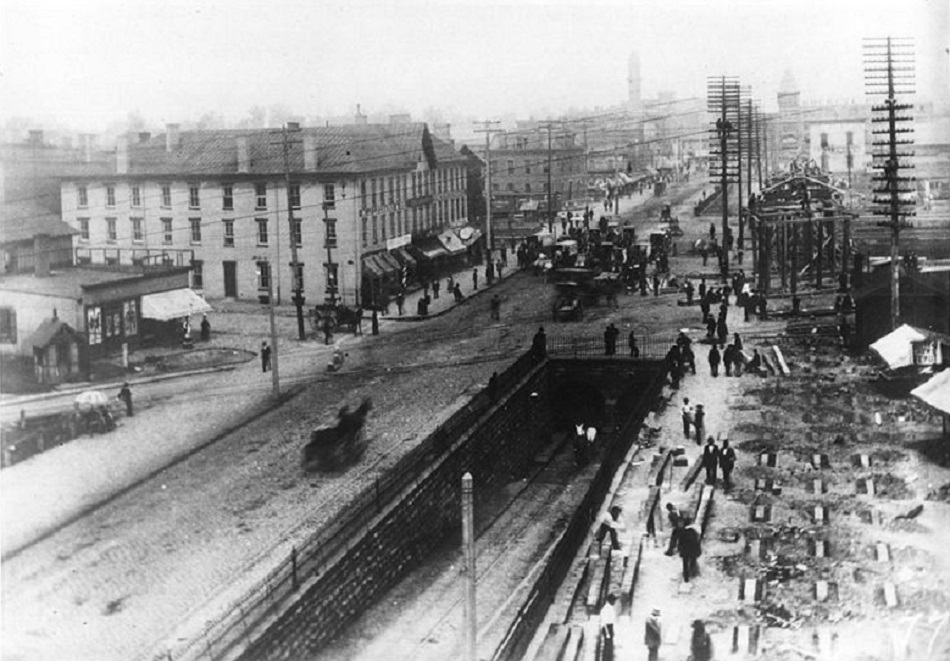
The High Street tunnel that connected the 2nd depot, around 1888.


The third and most recognizable depot was completed in 1897: Union Station. It was, by far, the largest and most elaborately designed depot of the three, with 45-ft ceilings, a grand concourse and ornate plaster details. Much of the glamour was lost in a 1920′s remodeling, however, and falling numbers of daily trains gradually eroded maintenance levels. Union Station continued to serve passengers for nearly 50 more years, until the last passenger train passed through Union Station on April 28, 1977, ending over 125 years of passenger rail in the city. Demolition of Union Station had begun almost 7 months earlier, in an underhanded tactic to make way for a proposed convention center. The depot, particularly the arcade section along High Street, had been put on the National Register of Historic Places in 1974, and preservationists had won an injunction to stop demolition. However, a coalition led by Battelle rushed to demolish the building anyway, and by the time preservationists could act, most of it had already been lost. A single archway was all that remained, and today it sits on the northern corner of McPherson Commons park in the Arena District, a lonely testament to what was lost. The rest of the station was demolished by the fall of 1979. Ironically, the best evidence of how preservation attitudes have changed is just a bit further north with the I-670 retail cap. It is designed to resemble the Union Station arcade.

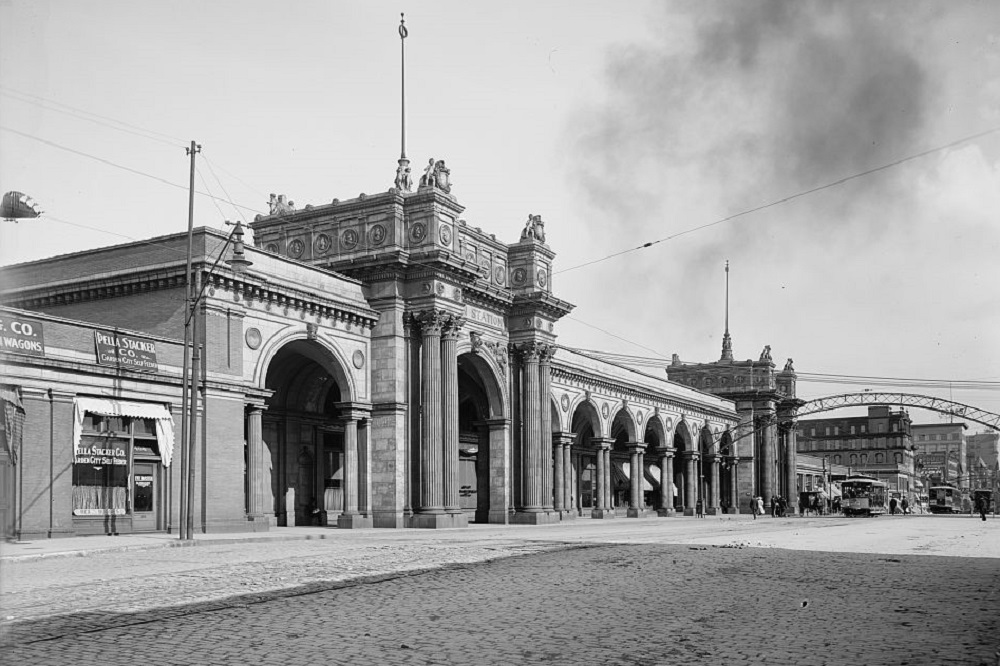
Union Station in 1910. It existed from 1897-1977.

Beyond heavy passenger rail, Columbus also had a streetcar system. The Columbus Street Railroad Company was formed in 1854, but the first streetcar did not come about until June 1863, when a horse-powered car arrived on High Street. By the 1890s, more than a dozen street rail companies were in the city and had almost 35 miles of tracks. Most of these were also horse-drawn until the early 1890s, when electrified lines proved far more efficient, making horse-drawn lines obsolete.

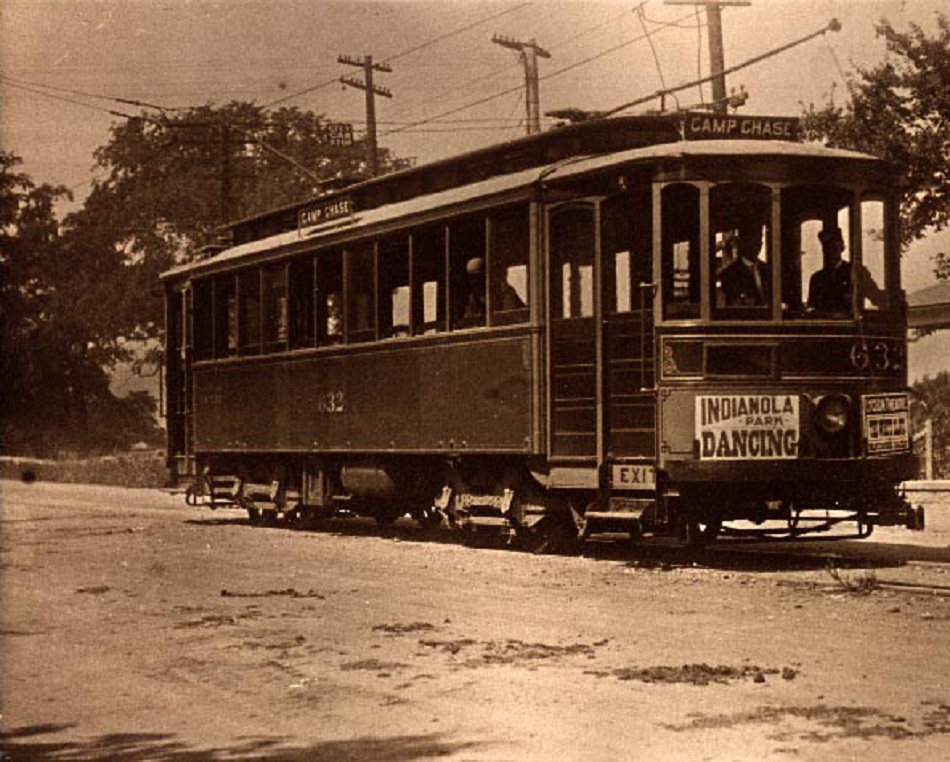
The Camp Chase streetcar.

Electric lines and passenger totals continued to grow over the next few decades and, by the mid 1910s, annual passenger tickets exceeded 65 million, equating to almost one trip per day for every man, woman and child living in Columbus at the time. By the 1920s, streetcar lines had spread to almost all of the urban core neighborhoods and inner ring suburbs, but passenger totals were already falling as the automobile increased in popularity. In the 1930s, an attempt was made to adapt to this changing transit environment and the fixed-track streetcars began to be replaced with trolley buses, with the last streetcar decommissioned in 1948. They too, however, only lasted until 1965, when they were replaced with the standard diesel bus.

In Part 2, I’ll examine what happened and why rail has, to this date, not returned to the city.

And for more information on the history of other Columbus transportation forms, visit the following links.
Road and Highway History
Air and Bus Transportation History
Canal and Other Transportation History


The February 9-10, 2010 Snowstorm


February 2010’s second snowstorm came just 3 days after the month’s first major event. This second low pressure system tracked from Louisville, Kentucky and then up along I-71 to Cleveland. Even though the track was through the heart of the state, the majority of the precipitation in most areas was snowfall. This storm followed so closely on the heels of the February 5th storm that the cold air that first storm had pulled into Ohio was still in place on the 9th. This allowed for snow despite the far north track. While the February 9-10, 2010 snowstorm wasn’t the largest of the month, it helped establish it as one of the snowiest winter months in history.

Snow began in Columbus in the early morning hours of the 9th and continued into the 10th. Snowfall rates reached their peak in the late morning hours of the 9th, falling at 1/2″ per hour at times, but never quite reached the intensities of Storm #1. While some parts of the state had 7-8″, the Columbus area had 5-6″, about half of what it got in Storm #1. Still, cleanup from the first storm was still ongoing, and this latest snowfall severely complicated the process. Traffic and airport delays were common, and many schools were cancelled. Snow depths in Franklin County reached 10-16″ after the storm.
the February 9-10, 2010 snowstorm Columbus, Ohio

Use the Weather History archive to further your search through local weather history, and the Wilmington National Weather Service for the current status of weather in the area.


Columbus Area Zip Codes and Their Economies


A lot of requests for zip code data come into this site, so I thought it might be a good idea to provide some.

First, we have a map for the Columbus area that includes the % of of employees in a particular zip code from 2000-2010.
Columbus area zip codes and their economies

From this map, the urban areas of Columbus seem to have lost the most % of their employees the last decade, along with the far suburban and rural areas. The biggest growth was in the areas along and just outside of 270. This is an interesting map as it implies that the nearest suburban areas are attracting the most jobs, but that these suburbs are are both pulling from the inner core, but also from much further out.

The second map is for average employee income by zip code.

What this map seems to show is that, while jobs may be moving to the I-270 suburbs, pay for those jobs is decidedly mixed across the city. Downtown, for example, averaged some of the highest incomes in the city. Other strong areas include parts of Westerville, New Albany and Dublin. Most of the High Street corridor was fairly strong as well. The lowest incomes were almost entirely in rural and far suburban areas.

Finally, the % change of average income from 2000-2010.

This map is also a mixed bag. Most of the area saw wage growth, but where it occurred the strongest was definitely all over the map. Some suburbs had good and bad, and so did the urban core areas.

So what’s all this mean? Well, certainly it means that the total # of jobs as far as growth shifted to the 270 suburbs the last decade, but at the same time, those jobs that remained in the core areas still grew in income. So it appears that the city is becoming richer about on par with the suburbs, at least the last 10 years. The question becomes, what happens the next decade? If urban trends continue the way they have the past few years (which these maps don’t really take into account), it is entirely possible that some of the job growth will move back inward towards the urban core.

To continue with local and national economic data, the US’ Bureau of Economic Analysis gives the option to look at cities, metro areas and other levels. Zip Code Maps gives population and demographic data in an interactive format.


The February 5-6, 2010 Snowstorm


The winter of 2009-2010 will go down as one of the best ever (if you like winter, that is). The biggest reason for that is February 2010 and its cascade of significant winter storms that placed the month as one of the snowiest of all time. The February 5-6, 2010 snowstorm event was one of the capping events of the month and winter as a whole.

The first event started in the morning on February 5th. Forecasts in the days leading up to this event were mixed. Models were showing a lot of precipitation, but also a strong push of upper-level warm air into Ohio. How far north this warm layer reached was the point of contention. In most years, the WTOD, or the “Warm Tongue of Death” as some Ohio weather enthusiasts like to refer to it, is a constant threat each and every winter. When a storm is moving north or northeast south of the state, they tend to pull warm air north, and the Appalachian Mountains act like a funnel directing this warm air straight into Ohio. During winter events, it presents itself as a layer of warm air above the surface, often turning snow to ice, sleet or just plain rain, even if the surface itself is relatively cold. It’s a constant source of frustration for winter weather lovers. It was this phenomenon that was predicted to strike again and the dividing line, as it so often is, was predicted to be along I-70/I-71. North of there, mostly or all snow was predicted, while south was more mix, ice and rain. The I-70 corridor, including Columbus, was to be the northern extent of this mixing, limiting snowfall accumulations. Still, even with the mix predicted, a solid 4″-6″ was predicted, which is a decent event by itself and typically the largest snow event of any given winter.

Precipitation began as snow across southern counties by dawn and spread north, reaching the Columbus area between 9AM and 9:30AM. It started out as flurries, but the flakes were already fairly large. Within 15 minutes, the flurries had turned to very heavy, wet snow. Flakes were as large as quarters at times and stayed large, accumulating quickly despite the above freezing temperatures. Visibility quickly dropped to a half mile or less at times, and traffic quickly snarled with accidents as plows could not keep up with the pace of the inch-per-hour snowfall rates. Between 4PM and 5PM, there was a respite as snowfall lightened and there was a mix of sleet and ice pellets, but all snow resumed once heavier precipitation moved in, concluding the only and very short period of mixing I-70 had. Snow continued through the night of the 5th and into the 6th, finally ending before noon.

Snowfall totals were impressive, especially along and north of I-70, where little mixing took place, but also in pockets to the southeast of Columbus, like Lancaster. For Columbus, the 9.9″ that fell was good enough to be a top 15 largest snowstorm for the city. It would not, however, be the largest snowfall of the month.

Some snow totals across Ohio from February 5-6, 2010
Greenville: 14.8″
Lancaster: 13.0″
Akron: 12.1″
Bellefontaine: 12.0″
Urbana: 12.0″
Westerville: 11.4″
Dayton: 11.1″
Springfield: 11.0″
Columbus: 9.9″
Youngstown: 8.4″
Delaware: 8.0″
Cleveland: 5.9″
Cincinnati: 4.5″
Circleville: 3.0″
Toledo: 3.0″

The February 5-6, 2010 snowstorm Columbus, Ohio

Snow totals for the NWS Wilmington area.

This event was the only the beginning of what would be a trio of consecutive snowstorms that would strike the area over the course of 11 days, including the February 9-10, 2010 Snowstorm, which occurred just a few days later.

The Wilmington National Weather Service, meanwhile, is a great source if you want to know the current weather in the area.


Housing Market Update January 2013


housing market update January 2013

Columbus housing market update January 2013

We’re starting a new year in this edition of the Columbus Housing Market Update, with new January 2013 data now available!

Note: LSD= Local School District, CSD= City School District. In both cases, school district boundaries differ from city boundaries.

Top 15 Most Expensive Locations By Median Sales Price in January 2013
1. New Albany: $447,500
2. Powell: $342,500
3. Upper Arlington CSD: $320,000
4. New Albany Plain LSD: $314,400
5. Dublin: $284,00
6. Bexley: $269,950
7. Olentangy LSD: $250,101
8. German Village: $241,618
9. Worthington: $228,938
10. Grandview Heights: $223,000
11. Downtown: $210,000
12. Granville CSD: $207,000
13. Dublin CSD: $190,450
14. Big Walnut LSD: $187,000
15. Marysville CSD: $182,000

New Albany continued to be the most expensive market.

Top 15 Least Expensive Locations by Median Sales Price in January 2013
1. Whitehall: $29,750
2. Hamilton LSD: $54,500
3. Columbus CSD: $68,500
4. Groveport Madison LSD: $70,000
5. Lancaster CSD: $71,250
6. Valleyview: $79,850
7. Newark CSD: $84,500
8. Reynoldsburg CSD: $94,500
9. Columbus: $95,000
10. Jefferson LSD: $95,000
11. South-Western CSD: $103,000
12. Circleville CSD: $109,000
13. Canal Winchester CSD: $112,000
14. Pataskala: $120,000
15. London CSD: 122,000

Whitehall was by far the cheapest market to buy into this month.

Overall Market Median Sales Price in January 2013: $120,885

Top 15 Locations with the Highest Median Sales Price % Growth Between January 2012 and January 2013
1. Newark CSD: +83.3%
2. Valleyview: +76.5%
3. Lithopolis: +71.1%
4. Circleville CSD: +61.4%
5. Groveport Madison LSD: +60.9%
6. Marysville CSD: +38.8%
7. London CSD: +34.8%
8. New Albany: +29.7%
9. Columbus CSD: +28.0%
10. Grandview Heights: +27.4%
11. Columbus: +26.7%
12. Upper Arlington CSD: +24.3%
13. Downtown: +19.3%
14. Sunbury: +18.4%
15. South-Western CSD: +16.1%

Downtown and Columbus overall made the top markets for appreciation in the past year.

Top 15 Locations with the Lowest Median Sales Price % Growth Between January 2012 and January 2013
1. Granville CSD: -50.7%
2. Jonathan Alder LSD: -33.0%
3. Westerville: -29.2%
4. Dublin CSD: -23.3%
5. Hamilton LSD: -21.6%
6. Jefferson LSD: -20.8%
7. Big Walnut LSD: -19.7%
8. Bexley: -17.6%
9. Gahanna: -17.0%
10. Johnstown Monroe LSD: -16.2%
11. Westerville CSD: -14.8%
12. Worthington CSD: -12.5%
13. German Village: -10.5%
14. Grove City: -6.4%
15. Whitehall: -4.9%

Overall Market Median Sales Price % Change January 2012 vs. January 2013: +8.6%

Top 10 Locations with the Most New Listings in January 2013
1. Columbus: 957
2. Columbus CSD: 605
3. South-Western CSD: 210
4. Olentangy LSD: 146
5. Hilliard CSD: 126
6. Westerville CSD: 109
7. Dublin CSD: 94
8. Pickerington LSD: 81
9. Grove City: 66
10. Groveport Madison LSD: 65

Top 10 Locations with the Fewest New Listings in January 2013
1. Valleyview: 1
2. Minerva Park: 1
3. Lithopolis: 2
4. Jefferson LSD: 3
5. Obetz: 6
6. Jonathan Alder LSD: 8
7. Grandview Heights: 9
8. Sunbury: 10
9. Johnstown Monroe LSD: 10
10. Hamilton LSD: 12
11. Whitehall: 15

Total New Listings in the Columbus Metro in January 2013: 2,388
Overall Metro New Listings % Change January 2012-January 2013: -3.7%

This month, prices increased as overall supply slipped.

For more information on the local market, go here: Columbus Realtors