In recent years, Columbus has lost multiple historic buildings, but not all of them were for new development. Instead, they were largely the victims of neglect and indifference, with both owners and the City itself acting as their executioners. The most recent building collapse is a City failure, but it is just one more in a long, depressing list. Let’s take a look at just some of these cases, and how bias against poorer or less-White neighborhoods may be part of the problem.
Charles Building
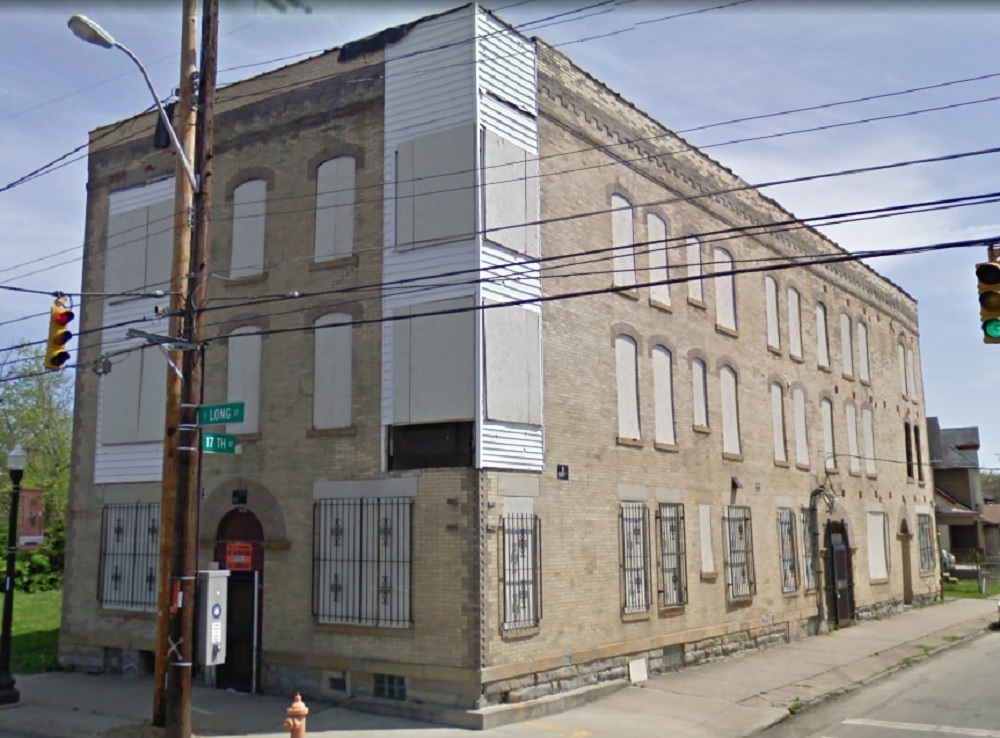
The Charles Building in 2009.
905 E. Long Street
Built: 1910s
Demolished: 2010
The apartment building was first owned by Dr. William Method, a prominent figure who was often called the “dean of Negro physicians” at the time. Method was responsible for helping to build the hospital across the street, known as Alpha Hospital, which primarily served Black residents who struggled to get adequate medical care otherwise. The apartment building was named after Method’s only son, Charles.
Method didn’t own the building for very long and was in the hands of another owner by 1920. The building belonged to one owner from 1938-1966, and was largely maintained during this period. In 1970, it passed to yet new owners, and that seems to have been when the problems started. At the time, disinvestment in the Near East Side had become a powerful force in and of itself. After 70-71 had split the neighborhood off from Downtown in 1962, the population collapsed and most of the people who remained were lower-income minorities, a demographic that wasn’t exactly being prioritized in the mid-20th Century. Coinciding with the Urban Renewal period, these neighborhoods were devastated both by the lack of investment, but also by the City demolishing large swaths of what they had determined to be undesirable areas.
Part of that lack of investment was allowing many of the older buildings that didn’t immediately meet the wrecking ball to decline in condition through lax, and sometimes virtually nonexistent inspections and maintenance.
The building was old by the 1970s, but continued to be a solidly-built structure. Over the following decades, however, neglect eventually caused the building to become abandoned, and the City took over ownership of it in 2004. The City did not maintain it after that, though, and it remained abandoned and in increasingly poor shape as the years went on. In the late 2000s, a plan was finally formed to renovate it and turn it into affordable housing by the Affordable Housing Trust for Columbus & Franklin County. However, city architects argued that it would cost more to renovate the building than to tear it down and build new ($2.1 Million vs. $1.5 Million), and city leaders were concerned the federal government wouldn’t provide the funds to make up the difference, leaving Columbus on the hook for the remaining $600,000. So, the renovation plans were given up and the decision was made to demolish it.
A part of the story familiar to most of the demolitions listed here, neighborhood residents were less than happy about another part of their history being lost due to outright neglect and the hand-wringing of officials using cost as an excuse. Regardless, the building was torn down by the end of 2010. An affordable housing project was built on the site in 2012, and given the name “The Charles” as a somewhat pandering move to the site’s history.
Ironically, the new Charles building cost $2.2 million to construct, which meant that the demolition and new building ended up costing more than just renovating the old one in the first place. Curious. Worse, the new building provided only 10 units, fewer than the original building could have.
Centenary United Methodist Church
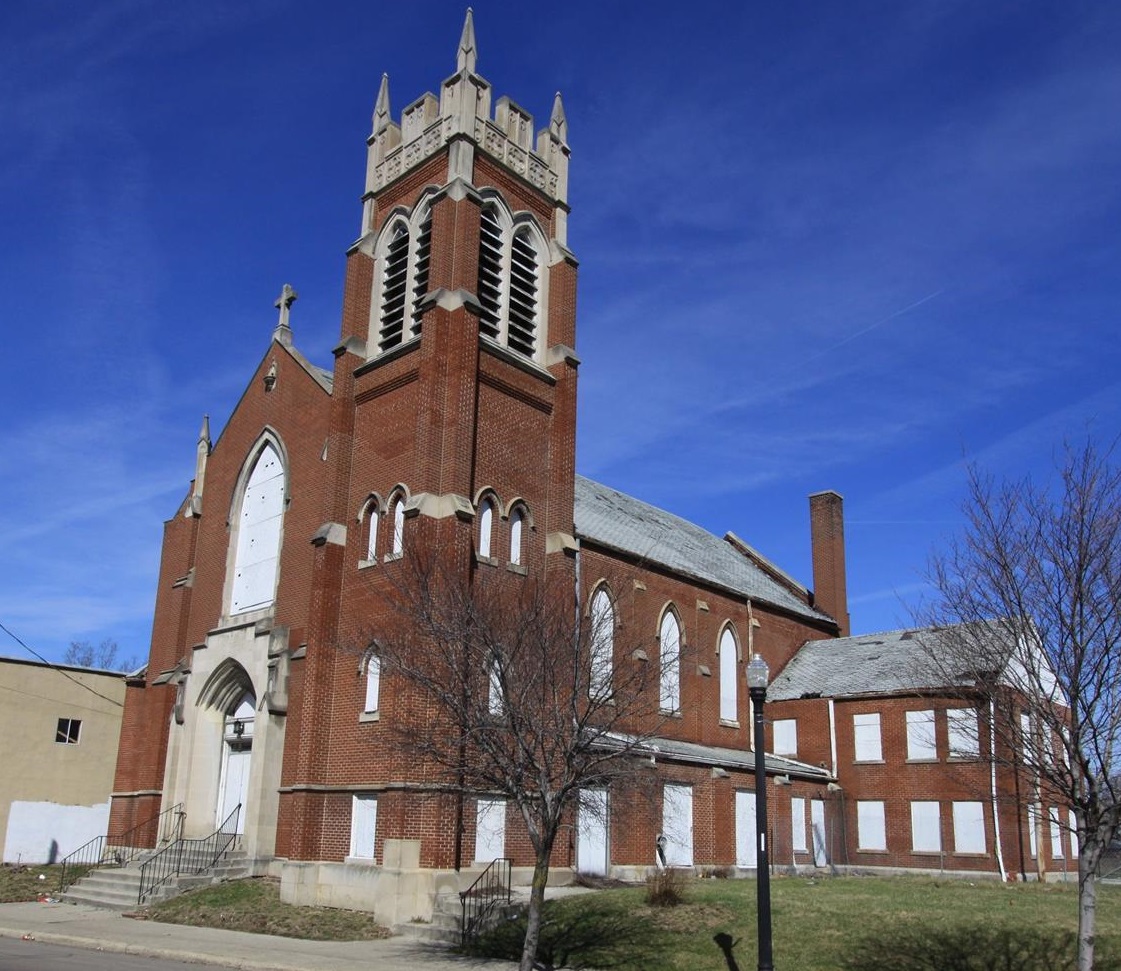
The church in March, 2010.
928 E. Long Street
Built: 1928
Demolished: May, 2010
In 2002, then Columbus Mayor Michael Coleman was pushing hard for revitalizing the King-Lincoln neighborhood, with 25 buildings throughout the neighborhood being designated as “major community assets”. The old Centenary United Methodist Church, the home of a long-time predominantly Black congregation, was one of those buildings. The following year, that existing congregation vacated the building and it was sold to Second Baptist Church of Columbus. Second Baptist didn’t seem to have any real plans for the building, as in 2009, it prepared to sell it to another church called Yeshua is Lord Ministries, which wanted to renovate the structure for a community center.
By 2003, the building was already 75 years old and had started to show its age. Deferred maintenance by the long-time owner had left parts of the structure, particularly the brick facade, vulnerable. Second Baptist had spent no money maintaining the structure, either, between 2003 and 2009.
The sale to Yeshua got as far as Second Baptist signing a sale contract, but for reasons that aren’t clear, the deal fell through. It’s also unclear whether Second Baptist sought other buyers after that or just decided to tear it down. In April, 2010, a city engineer’s report called the building “unsafe” due to loose brick, a few of which had fallen off the building. The City ordered the church stabilized or torn down, and Second Baptist chose the latter, with a vague plan to redevelop the site after.
Columbus Landmarks Foundation briefly got involved to either raise money to save it or find a new buyer, but they just didn’t have any time to do so. Only a month after the report, the church was demolished. To date, Second Baptist still owns the site, but it continues to be vacant more than a decade later.
In some ways, this story is more complicated than with the Charles Building, but there are familiar themes here too. The building lacked the necessary maintenance by its owners, and the City lacked the oversight necessary to make sure it was maintained before it became a public safety issue. By the time any of it was addressed, the timeline pushed to do so did not give interested parties the time necessary to save it. Furthermore, we have a common case of historic buildings being demolished with no real plans in place to replace them with anything. Churches have been a surprising force in this type of historic destruction, not just with church buildings themselves, but with surrounding blocks, often either for newer buildings or parking lots.
Commercial Building
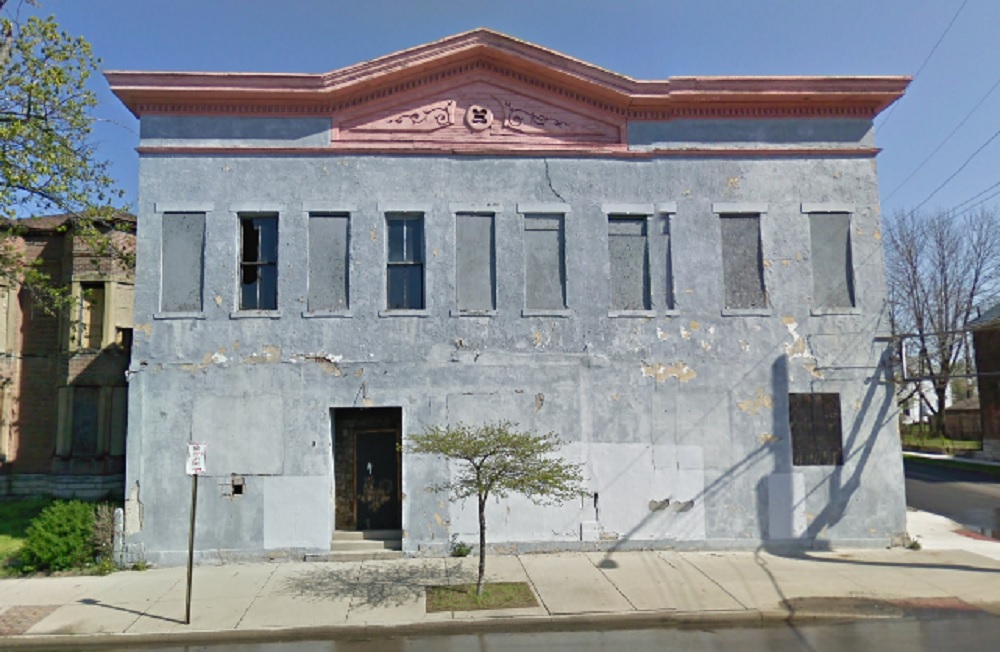
The building in 2009.
1072 E. Long Street
Built: Unknown, prior to 1891
Demolished: 2010
While it never seems to have had an official name, this commercial building was long an important fixture on Long Street. While articles say it was built around 1910, historic maps clearly show it being at the site as early as 1891, so it was far older than suggested. In the 1940s and 1950s, for example, it functioned as the Burns Memorial Funeral Home, a family-owned business that served the local Black community. It also served as apartments, retail space, the Crosby Funeral Home and in the early 1970s, as a Franklin County registrar to buy plates and licenses. Records after the 1970s are few, and it seems the building may have been fallen into disuse by the 1980s, coinciding with the general decline of the Near East Side. Its path to demolition is an interesting one, as it seems the City was determined to tear it down.
In November, 2009, the building went to a Sheriff’s auction, where Columbus bought it with plans to turn over the site to the Columbus Housing Partnership. At the time, though, CHP had no actual plans for it. A few weeks later and after an inspection, the City inspectors issued an emergency order that claimed the building was in such a state of decay that it could “collapse at any time”. The order gave Columbus 30 days to either fix the building or tear it down.
After the emergency order was issued, the Bronzeville Neighborhood Association, among other neighborhood groups, requested the chance to get a second opinion on the building’s condition and if there was a possibility of saving it. The Columbus Department of Development, which took ownership of the building after the auction, claimed that there was simply no time to wait for that as the building was a significant risk.
It is very strange, then, that the City did not act within the ordered 30-day timeframe. Indeed, 4 months would go by and nothing would be done with the structure, far longer than would’ve been required to honor the request of neighborhood groups for a second opinion on condition. On March 1, 2010, The Bronzeville Neighborhood Association offered Columbus $500 for the building, an amount more than the Director of the Columbus Department of Development thought the building was worth. The same day, the BNA was given until March 5th to come up with a “viable” plan to buy and renovate the building.
So to recap, city inspectors had claimed the building was in imminent danger of collapse and gave the Department of Development 30 days to either renovate or demolish. The DOD then told neighborhood groups that 30 days was just not enough time for them to get a second opinion and put together a proposal. 4 months pass with no action from Columbus, neighborhood groups put an offer for more than the building is considered to be worth, but the DOD gives them just 5 days to come up with a new proposal, something they could’ve been working on the previous 4 months as the City did nothing. It sure seems like the City wasn’t acting in good faith.
On the March 5th deadline, the City rejected the $500 offer by saying that it didn’t come with any assurances that the neighborhood groups would raise the necessary funds to renovate the structure. Just a week later, the building came down. At the time, it was one of the oldest buildings remaining on Long Street.
Charles Seefried Building

Seefried building in 2021.
555 W. Town Street
Built: 1884
Demolished: Soon
While this mixed-use building has yet to meet the wrecking ball, it seems to be only a matter of time. Charles Seefried’s life seems to not show up much in the historical record. In an 1889 directory, he is listed as a “blacksmith helper” and living at 179 1/2 N. High Street, but it’s unclear if this is the same Seefried whose name adorns the building. Either way, Seefried seems to have passed away on October 29, 1888 at age 43. The building housed apartments on upper floors with commercial space on the ground for for just about all of its existence. A general store called Couts & Downing is listed in the building as early as 1907 and were still there when WWII broke out. A bar called the Red Star Grill was there for at least a decade in the 1960s and 1970s. The exact year when the building was abandoned is unclear, but it seems the most likely period was the 1980s. Between 1979 and 2012, the building was sold at least 6 times to different owners, most of whom did almost nothing in terms of maintenance. There were minor repairs done in the mid-1990s and in 2002, but they were not the kind of repairs that would halt the deterioration. In 2016, it seems the most recent owner at least applied for a permit to replace the roof, but it’s unclear if that was done. A few years later, in March, 2019, the building was declared unsafe, with similar declarations coming into 2020, with repeated 90-day orders to stabilize or tear the building down.
Finally, in March of this year, it was reported the the owner had decided to tear it down, citing structural issues that rendered the building “too far gone”. No permits for the demolition have yet been issued, so there is a very tiny chance that the building will somehow make it, but that seems very unlikely.
And now we finally come to the latest loss.
Mixed-Use Building
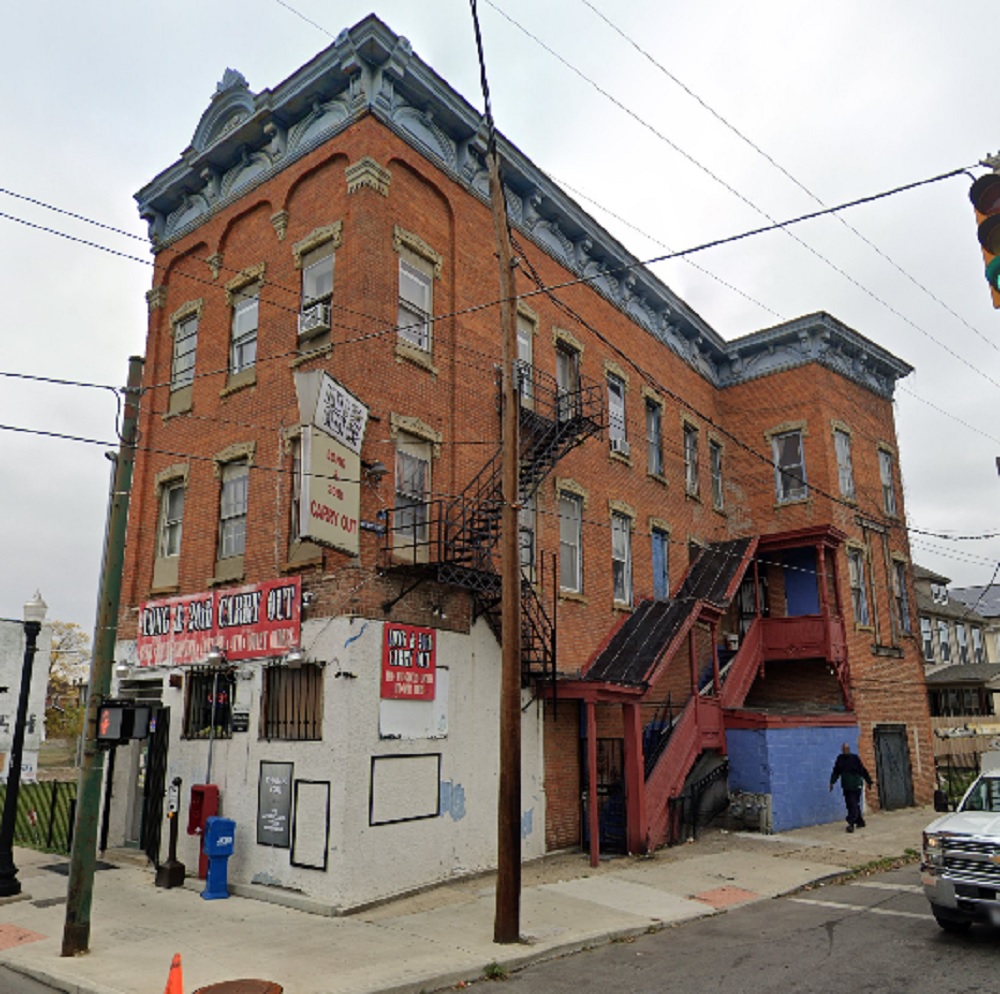
1032 E. Long in 2021.
1032 E. Long Street
Built: 1880s
Demolished: July, 2022
This was likely one of the oldest remaining commercial buildings on East Long Street, a very rare survivor after 70 years of demolitions in the neighborhood. How it survived so long when so many others did not is probably more luck than anything, but it still managed to meet the same fate of neglect that all these others- and so many more- did.
On July 18, 2022, part of the back half of the building completely collapsed.
In public records, there are no listed permits for any improvements or renovations, so this likely occurred simply due to neglect. After 140 years, all that deferred maintenance left the building vulnerable until it literally couldn’t stand anymore. Going back more than a decade, the only code violations I could find had to do with trash, weeds, graffiti and signage. Had there been any inspections of the building at all over the past 5 owners in the last 20 years?
Why is Columbus allowing so much of its history to rot away to the point of collapse? These buildings had history and each one arguably added more to their neighborhoods architecturally than anything being built today. Each loss is a tragedy and should serve as reason enough for change.
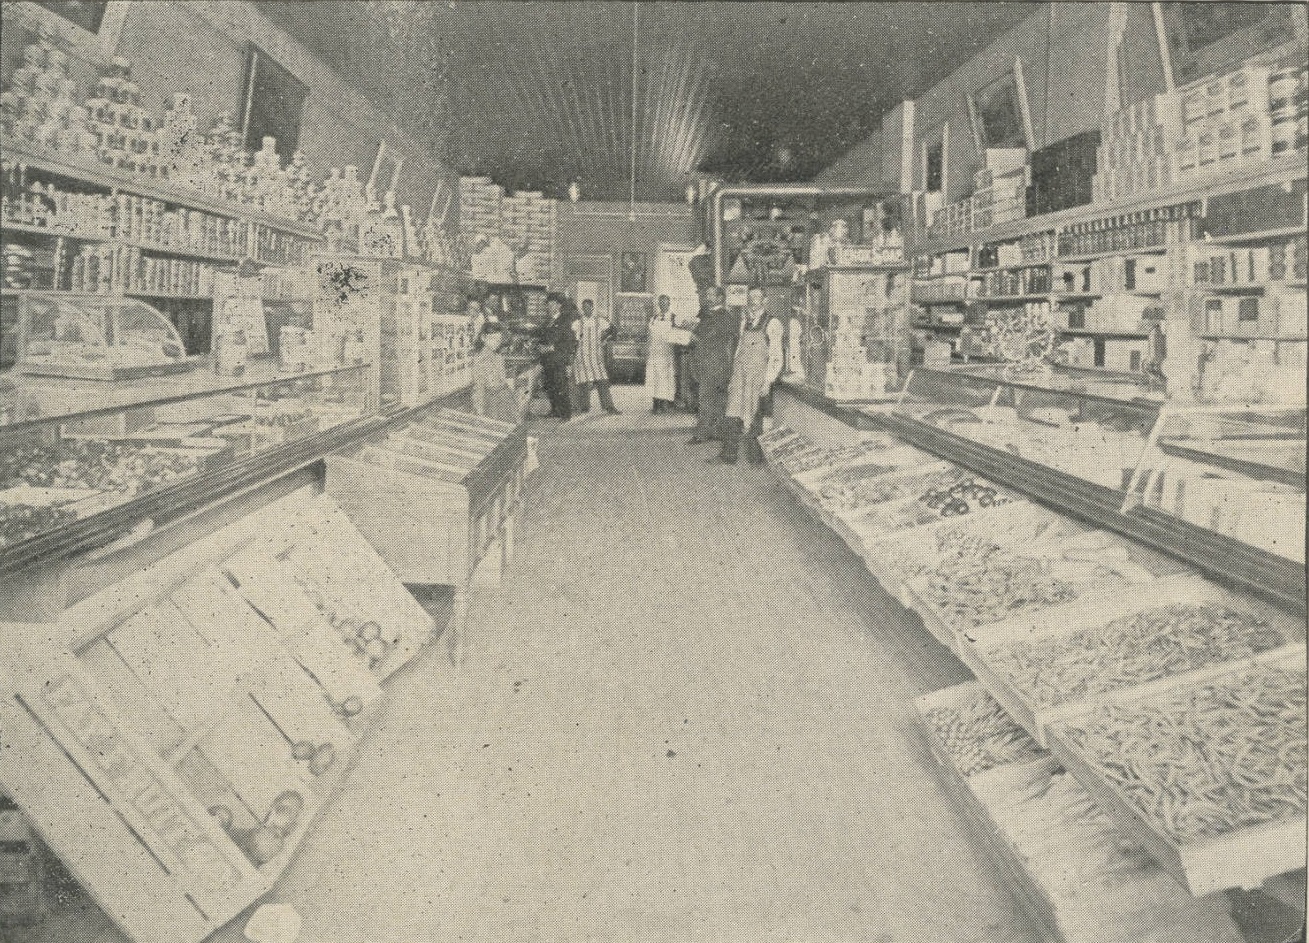
The interior of L. Hicken Staple and Fancy Groceries inside 1032 E. Long Street in 1898.