Columbus Drowning in Rain


Columbus drowning in rain

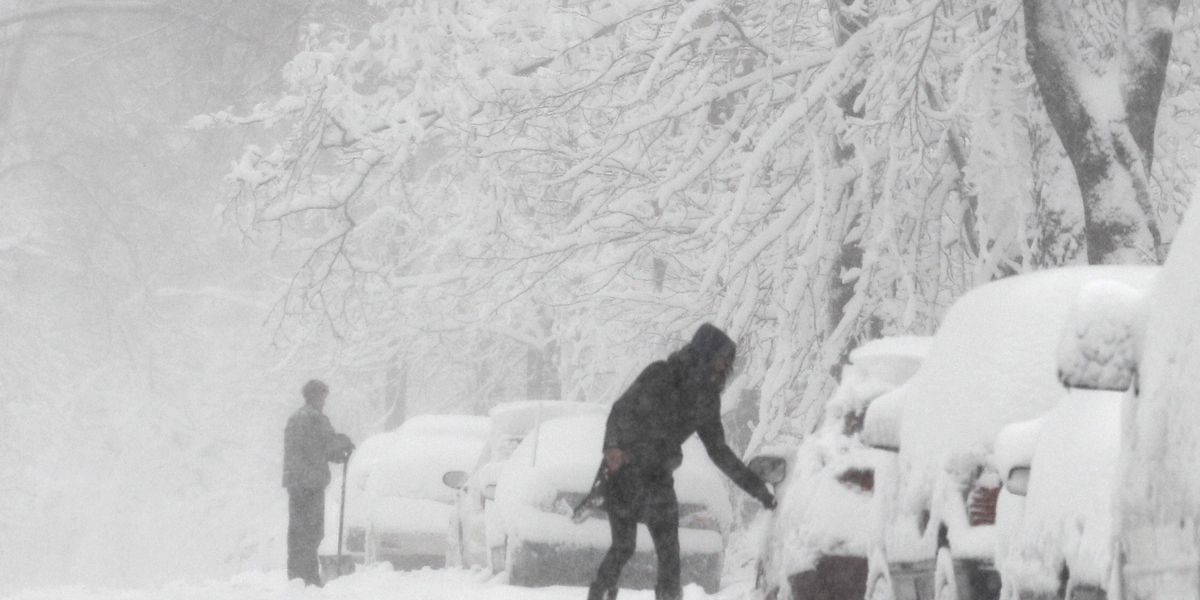
If it seems like the last few years have been particularly wet, you’d be right. Columbus, other Ohio cities and many areas in the Midwest have been seeing record rainfall of late. Yesterday alone, June 19th, Columbus had a daily record 2.65″ of rain, flooding many streets across Franklin County, including I-71 in at least 2 places. Is it indicative of a fluke pattern or a local result of climate change? Let’s look at the numbers and trends more closely.

First of all, let’s look at the 20 wettest years on record through June 19th.
1. 1882: 32.50″
2. 1890: 30.12″
3. 2019: 27.08″
4. 1964: 25.78″
5. 2011: 25.68″
6. 1893: 25.50″
7. 2004: 25.49″
8. 1996: 24.94″
9. 1949: 24.52″
10. 1945: 24.49″
11. 1913: 24.45″
12. 1883: 24.18″
13. 2018: 23.98″
14. 2008: 23.62″
15. 1950: 23.60″
16. 1990: 23.56″
17. 1981: 23.49″
18. 1898: 22.94″
19. 1927: 22.92″
20. 1937: 22.69″

So far, 2019 has had the 3rd highest rain total to date since 1879.

Here are the top 20 wettest full years.
1. 2018: 55.18″
2. 2011: 54.96″
3. 1990: 53.16″
4. 1882: 51.30″
5. 1890: 50.73″
6. 2004: 49.27″
7. 2003: 49.03″
8. 1883: 48.88″
9. 1881: 46.99″
10. 2017: 46.61″
11. 1973: 46.25″
12. 1948: 45.69″
13. 1972: 45.60″
14. 1996: 45.56″
15. 2008: 45.44″
16. 1995: 45.30″
17. 2015: 45.00″
18. 1950: 44.96″
19. 1880: 44.68″
20. 1949: 44.47″

4 years this decade have been among the top 20 wettest years since 1879. Only the 1880’s can match that record, though both the 2000s and 2010s have been wetter, as shown below.


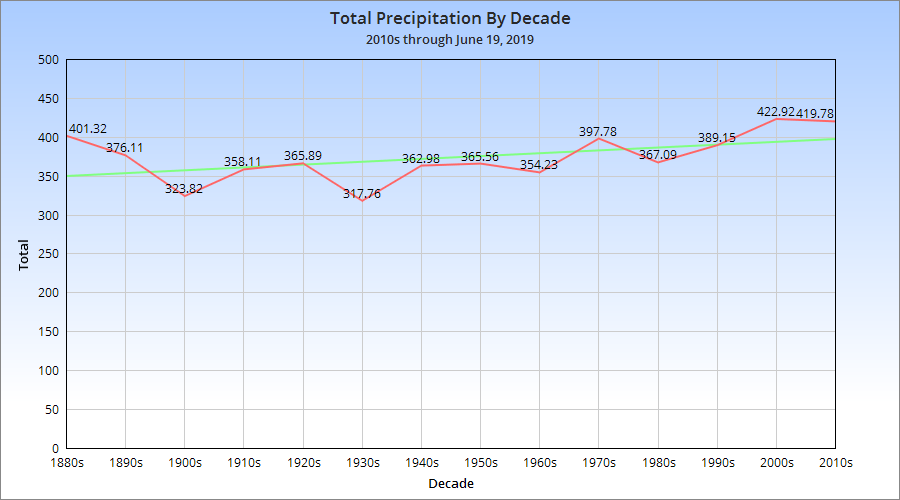
The chart shows that the 2000s were the wettest decade on record, with the 2010s looking to surpass even that total with more than 6 months left to go in 2019. Furthermore, the trend line is clearly up, meaning that Columbus has been getting gradually wetter over the last 140 years, indicating that something else is going on rather than just a random wet period.
Columbus isn’t the only place in the Midwest seeing high levels of rain. There has been widespread, damaging flooding going on across many states, especially this year. Check out some of the articles on this below:
Cincinnati: https://www.journal-news.com/news/local/butler-county-struggling-with-near-record-rainfall-this-unbelievable/270FdqJqMzImu7YSBtYTHM/
Lake Michigan: https://www.msn.com/en-us/weather/topstories/lake-michigan-water-levels-on-pace-to-reach-record-high-in-june-skirt-records-into-fall/ar-AAD1BWz
Iowa: https://www.usatoday.com/story/news/2019/06/14/iowa-climate-change-agriculture-flood-rain-farming-environment-weather-precipitation-temperature/1433128001/
Pennsylvania: https://www.pennlive.com/news/2019/06/for-pa-farmers-year-of-record-rain-often-a-big-nuisance.html
West Virginia: https://www.herald-dispatch.com/news/huntington-charleston-on-pace-to-break-annual-rainfall-average/article_1fd2b7a8-db64-5074-b017-ab700ff243ec.html
Midwest Farming: https://www.bloomberg.com/news/articles/2019-06-14/it-s-not-just-corn-u-s-farmers-may-forgo-near-record-soy-acres?srnd=premium
Mississippi River: https://finance.yahoo.com/news/mississippi-floodings-impact-freight-economy-142712910.html

Ironically, few individual months in recent years have featured record precipitation. In the last 10 years, only 1 month- July 2017- appears in the top 25 wettest months. It’s just been more of a constant wet pattern, where most months now have above to well-above normal precipitation.
While climate change can’t account for individual events or specific record rainfalls, the patterns are obvious enough to show that the climate in Columbus and in many other parts of the country is changing over time. This means that we should come to expect more of this in the years to come.

Google Map Links


Columbus Development Maps

2010-2013 Development
2014-2019 Development
2020-2025 Development
All these pages are basically just map versions of the development pages. However, the maps are organized by year and include before and after photos of the development sites.

Columbus Fantasy Transit Map

2019 Transit Map
The transit map for the Columbus Metro Area is just one example of many existing fantasy maps for Central Ohio. This one includes routes for light rail, BRT (Bus Rapid Transit) and interurban rail to neighboring counties.

The Redevelopment of Westland Mall
Mall Site
Westland Mall and the larger surrounding area is in desperate need of a revamp. Recently, a proposal to make the site into a “Weston” development in the potential style of Easton has emerged. I made this map several years ago as a basic blueprint for how the entire area could be rebuilt into a much more urban, walkable, vibrant corridor.

Ohio Severe Weather Report Maps by Decade

1950-1959 Severe Reports
1960-1960 Severe Reports
1970-1979 Severe Reports
2010-2019 Severe Reports
The 1950s and 1960s maps are the only ones completed so far.

Columbus Area Bike Lanes, Multi-use Paths and Sidewalk Infrastructure

Bike Infrastructure
This map attempts to include all the existing bike and multi-use infrastructure in the area, along with general pedestrian infrastructure. The map will is not fully updated yet through 2019.

Downtown Columbus Parking Infrastructure

Parking Lots and Garages
This map, last updated in 2015, documents all existing parking garages and surfaces lots throughout Downtown.

Weekly Update 6/3-6/9


The weekly update for June 3-6 continues to show progress on the site’s restoration. This included the following:
-The Completed Development page received extensive additions for the years 2015-2019.
-The January Weather records page was fully restored and includes 2019 data.
-The Columbus Tornado History page got a large addition.
-A few new graphs were added to the Columbus City Demographics page.
-Columbus Transportation History received multiple entries.
-Odds and ends were added to several other pages across the site.

Winter 2018-2019 Review


Winter 2018-2019 Review Columbus, Ohio

The Winter 2018-2019 Review reveals the season was another one of extremes, with record highs and near record lows, snowy months and snowless months. The only real consistency was how wet it was.

Temperature and snowfall ranking data goes back to the winter of 1878-1879. Snow depth ranking data goes back to 1940. Rankings are accurate through the 2018-2019 winter.

December-February Only
Average High: 41.4 22nd Warmest
Average Low: 26.4 21st Warmest
Mean: 33.8 24th Warmest
Precipitation: 12.15″ 8th Wettest
Snowfall: 23.3″ 35th Snowiest
Average Daily Snow Depth: 0.5″
32 or Below Highs: 22 16th Fewest
32 or Below Lows: 66 14th Fewest
Measurable Precipitation Days: 43 10th Most
Measurable Snowfall Days: 22 15th Most
Deepest Snow Depth: 4″ on January 13th and 20th, February 1st and 2nd
Days with 1″+ Snow Depth: 17 14th Fewest

Entire Cold Season- October-April
Average High: 49.7 27th Warmest
Average Low: 33.3 25th Warmest
Mean: 41.5 23rd Warmest
Precipitation: 29.33″ 3rd Wettest
Snowfall: 27.4″ 44th Snowiest
Average Snow Depth: 0.2″
32 or Below Highs: 27 17th Fewest
32 or Below Lows: 106 25th Fewest
Measurable Precipitation Days: 91 14th Most
Measurable Snowfall Days: 29 16th Most
Deepest Snow Depth: 4″ on January 13th and 20th, February 1st and 2nd
Days with 1″+ Snow Depth: 20 13th Fewest

Average High By Month
October 2018: 65.7 43rd Warmest
November 2018: 45.2 8th Coldest
December 2018: 44.1 21st Warmest
January 2019: 36.6 48th Coldest
February 2019: 43.4 25th Warmest
March 2019: 47.5 36th Coldest
April 2019: 65.4 21st Warmest

Average Low By Month
October 2018: 47.2 25th Warmest
November 2018: 33.2 28th Coldest
December 2018: 30.6 15th Warmest
January 2019: 22.2 47th Warmest
February 2019: 26.3 33rd Warmest
March 2019: 28.7 27th Coldest
April 2019: 44.6 12th Warmest

Mean By Month
October 2018: 56.5 28th Warmest
November 2018: 39.2 14th Coldest
December 2018: 37.3 18th Warmest
January 2019: 29.4 51st Coldest
February 2019: 34.8 30th Warmest
March 2019: 38.1 34th Coldest
April 2019: 55.0 14th Warmest

Precipitation By Month
October 2018: 2.60″ 43rd Wettest
November 2018: 5.70″ 4th Wettest
December 2018: 3.57″ 30th Wettest
January 2019: 3.09″ 47th Wettest
February 2019: 5.49″ 6th Wettest
March 2019: 5.33″ 15th Wettest
April 2019: 3.55″ 54th Wettest

Snowfall By Month
October 2018: 0.0″
November 2018: 2.1″
December 2018: 0.4″
January 2019: 11.3″
February 2019: 11.6″
March 2019: 2.0″
April 201: 0.0″

Average Daily Snow Depth By Month
October 2018: 0.0″
November 2018: Trace
December 2018: 0.0″
January 2019: 1″
February 2019: 0.5″
March 2019: 0.1″
April 2019: 0.0″

Maximum High By Month
October: 88 on the 6th and 8th
November: 61 on the 1st
December: 66 on the 2nd
January: 62 on the 8th
February: 62 on the 7th
March: 75 on the 14th
April: 82 on the 11th

Maximum High Records
-The 62 on February 7th was a record for the date, beating the old record of 61 set in 1925.

Minimum High By Month
October: 49 on the 21st
November: 30 on the 28th
December: 28 on the 8th
January: 11 on the 31st
February: 22 on the 1st
March: 20 on the 5th
April: 43 on the 1st

Minimum High Records
-The 33 on November 14th tied the record set in 2014.
-The 20 on March 5th tied the record set in 1890.

Maximum Low By Month
October: 69 on the 2nd and 9th
November: 50 on the 5th
December: 46 on the 15th
January: 41 on the 8th
February: 43 on the 6th
March: 51 on the 14th and 29th
April: 64 on the 18th

Maximum Low Records
-The 69 on October 2nd was a record for the date, beating the old record of 68 set in 1881 and 1884.
-The 68 on October 8th tied the record for the date set in 1879.
-The 69 on October 9th tied the record for the date set in 1879.
-The 68 on October 10th was a record for the date, beating the old record of 66 set in 1879.
-The 43 on February 6th was a record for the date, beating the old record of 42 set in 1991.
-The 64 on April 18th was a record for the date, beating the old record of 63 set in 1941.

Minimum Low By Month
October: 32 on the 22nd and 25th
November: 22 on the 10th and 11th
December: 16 on the 10th
January: -4 on the 30th and 31st
February: 9 on the 2nd
March: 7 on the 5th
April: 24 on the 1st

Highest Daily Precipitation By Month
October: 0.63″ on the 31st
November: 1.80″ on the 1st
December: 1.01″ on the 31st
January: 0.81″ on the 19th
February: 1.22″ on the 20th
March: 1.97″ on the 30th
April: 0.77″ on the 19th

Precipitation Records
-The 1.80″ on November 2nd was a record for the date, beating the old record of 1.45″ set in 1984.
-The 1.01″ on December 31st was a record for the date, beating the old record of 0.89″ set in 1887.
-The 0.91″ on February 12th was a record for the date, beating the old record of 0.77″ in 1930.
-The 1.97″ on March 30th was a record for the date, beating the old record of 1.47″ set in 1987.

Highest Daily Snowfall By Month
October: 0.0″
November: 1.3″ on the 15th
December: 0.2″ on the 5th
January: 4″ on the 12th
February: 4.2″ on the 1st
March: 1.9″ on the 3rd
April: 0.0″

Deepest Snow Depth By Month
October: 0″
November: 1″
December: 0″
January: 4″ on the 13th and 20th
February: 4″ on the 1st and 2nd
March: 2″ on the 1st
April: 0″

Overall, the winter of 2018-2019, while having a few cold spells, was largely warmer than normal. It was also wet and had snowfall near normal.

For more winter season records and local weather information, visit Winter Season Records or
Wilmington National Weather Service.


The Biggest Snowstorms of All Time


The biggest snowstorms of all time Columbus, Ohio

East Broad Street after a snowstorm in March, 1906.

In light of yesterday’s strange storm that challenged local forecasters, I thought it might be time to look at the biggest snowstorms of all time in Columbus, or at least since records began in 1878. I looked up the total snowfall over different periods of time.

Top 20 Largest Single Snowstorms of Any Duration
1. 3/7-3/8/2008: 20.5″
2. 2/14-2/17/2003: 15.5″
3. 2/16-2/19/1910: 15.3″
4. 11/23-11/29/1950: 15.2″
5. 1/6-1/7/1910: 12.7″
6. 4/3-4/5/1987: 12.6″
7. 1/7-1/9/1884, 2/11-2/12/1910: 10.6″
8. 2/15-2/16/2010, 2/4-2/5/2014: 10.4″
9. 3/19-3/20/1906, 1/13-1/14/1917: 10.0″
10. 2/7-2/8/1971, 1/16-1/17/1978, 2/5-2/6/2010: 9.9″
11. 1/6-1/7/1996: 9.8″
12. 1/13-1/15/1968, 2/27-2/28/1984: 9.5″
13. 2/13-2/14/1914: 9.3″
14. 3/5-3/6/1962: 9.2″
15. 12/19-12/20/1960: 8.8″
16. 1/14-1/15/1918: 8.5″
17. 2/25-2/26/1934: 8.4″
18. 1/31-2/1/1881, 2/25-2/26/2014: 8.3″
19. 3/11-3/12/1906: 8.2″
20. 12/3-12/4/1957: 8.1″

Top 12 Largest 1-Day Snowfalls
1. 3/8/2008: 15.5″
2. 4/4/1987: 12.3″
3. 1/6/1910: 11.9″
4. 2/15/2010: 9.7″
5. 3/19/1906: 9.6″
6. 2/5/2010: 9.0″
7. 2/8/1971, 2/16/2003: 8.9″
8. 1/7/1996: 8.8″
9. 3/5/1962: 8.6″
10. 1/8/1884: 8.5″
11. 2/16/1910: 8.2″
12. 12/3/1957: 7.9″

Top 12 Largest 2-Day Snowfalls
1. 3/7-3/8/2008: 20.5″
2. 3/8-3/9/2008: 15.5″
3. 2/16-2/17/1910: 15.0″
4. 1/6-1/7/1910: 12.7″
5. 4/4-4/5/1987: 12.5″
6. 4/3-4/4/1987: 12.4″
7. 2/15-2/16/2003: 12.0″
8. 1/5-1/6/1910: 11.9″
9. 2/16-2/17/2003: 10.8″
10. 2/11-2/12/1910, 2/4-2/5/2014: 10.6″
11. 2/15-2/16/2010: 10.4″
12. 1/8-1/9/1884: 10.2″

Top 12 Largest 3-Day Snowfalls
1. 3/6-3/8/2008, 3/7-3/9/2008: 20.5″
2. 3/8-3/10/2008: 15.5″
3. 2/16-2/18/1910: 15.3″
4. 2/15-2/17/1910: 15.0″
5. 2/15-2/17/2003: 13.9″
6. 2/14-2/16/2003: 13.6″
7. 1/5-1/7/1910, 1/6-1/8/1910: 12.7″
8. 4/3-4/5/1987: 12.6″
9. 4/4-4/6/1987: 12.5″
10. 4/2-4/4/1987: 12.4″
11. 1/4-1/6/1910, 1/7-1/9/1996: 11.9″
12. 11/25-11/27/1950: 11.5″

Players struggle during the infamous Ohio State-Michigan Snow Bowl game on November 27, 1950.


Top 12 5-Day Snowfalls
1. 3/4-3/8/2008, 3/5-3/9/2008: 21.2″
2. 3/6-3/10/2008, 3/7-3/11/2008: 20.5″
3. 1/16-1/20/1978: 17.6″
4. 3/31-4/4/1987: 16.4″
5. 2/15-2/19/2003: 15.9″
6. 4/2-4/6/1886: 15.7″
7. 2/13-2/17/2003, 2/14-2/18/2003, 3/8-3/12/2008: 15.5″
8. 2/14-2/18/1910, 2/15-2/19/1910, 2/16-2/20/1910: 15.3″
9. 2/13-2/17/1910: 15.0″
10. 4/3-4/7/1886, 2/12-2/16/1910, 2/5-2/9/2010: 14.3″
11. 1/17-1/21/1978: 14.2″
12. 2/12-2/16/2003: 14.0″

Top 12 Largest 7-Day Snowfalls
1. 2/11-2/17/1910: 25.6″
2. 2/12-2/18/1910: 21.4″
3. 3/2-3/8/2008, 3/3-3/9/2008, 3/4-3/10/2008, 3/5-3/11/2008: 21.2″
4. 3/6-3/12/2008, 3/7-3/13/2008: 20.5″
5. 1/14-1/20/1978: 19.0″
6. 2/10-2/16/1910: 18.8″
7. 3/30-4/5/1987: 18.3″
8. 3/29-4/4/1987: 18.1
9. 1/15-1/21/1978, 1/16-1/22/1978: 17.8″
10. 2/13-2/19/2003, 2/14-2/20/2003: 17.5″
11. 2/10-2/16/2003: 17.0″
12. 4/1-4/7/1886, 4/2-4/8/1886: 16.9″

Top 12 10-Day Snowfalls
1. 2/9-2/18/1910: 28.4″
2. 2/8-2/17/1910: 28.1″
3. 2/10-2/19/1910, 2/11-2/20/1910: 25.9″
4. 3/11-3/20/1906: 23.5″
5. 3/10-3/19/1906: 23.1″
6. 2/28-3/8/2008, 2/29-3/9/2008: 21.7″
7. 2/12-2/21/1910: 21.4″
8. 2/7-2/16/1910: 21.3″
9. 3/1-3/10/2008, 3/2-3/11/2008, 3/3-3/12/2008, 3/4-3/13/2008, 3/5-3/14/2008: 21.2″
10. 2/10-2/19/2003: 20.9″
11. 1/12-1/21/1978, 1/2-1/11/1996: 20.8″
12. 1/11-1/20/1978: 20.6″

Top 12 Largest 15-Day Snowfalls
1. 2/8-2/22/1910, 2/9-2/23/1910: 28.8″
2. 2/3-2/17/1910: 28.5″
3. 2/4-2/18/1910, 2/5-2/19/1910, 2/6-2/20/1910, 2/7-2/21/1910: 28.4″
4. 2/10-2/24/1910, 2/11-2/25/1910: 26.3″
5. 2/2-2/16/2010: 25.8″
6. 1/7-1/21/1978, 1/8-1/22/1978: 25.7″
7. 1/6-1/20/1978, 2/3-2/17/2010, 2/4-2/18/2010, 2/5-2/19/2010: 25.5″
8. 1/12-1/26/1978: 25.2″
9. 2/1-2/15/2010: 25.1″
10. 3/10-3/24/1906, 3/11-3/25/1906, 1/13-1/27/1978: 24.8″
11. 1/14-1/28/1978, 2/10-2/24/2003: 24.5″
12. 3/6-3/20/1906, 3/7-3/21/1906: 23.8″

Top 12 Largest 30-Day Snowfalls
1. 1/20-2/18/1910, 1/21-2/19/1910: 37.9″
2. 1/19-2/17/1910: 37.6″
3. 1/22-2/20/1910: 35.3″
4. 1/2-1/31/1978, 1/3-2/1/1978, 1/4-2/2/1978, 1/5-2/3/1978: 34.0″
5. 1/8-2/6/1978: 33.8″
6. 1/1-1/30/1978, 1/7-2/5/1978: 33.6″
7. 12/30/1977-1/28/1978, 12/31/1977-1/29/1978: 33.4″
8. 12/29/1977-1/27/1978: 32.8″
9. 12/28/1977-1/26/1978: 32.5″
10. 1/6-2/4/1978: 32.0″
11. 2/8-3/8/2008: 31.8″
12. 1/24-2/22/1910, 1/25-2/23/1910, 1/26-2/24/1910, 1/27-2/25/1910, 1/28-2/26/1910, 1/29-2/27/1910, 1/30-2/28/1910, 1/26-2/24/2003: 30.7″

Certain years show up on all the lists, including 1906, 1910, 1978, 2003, 2008 and 2010. These winters all had periods of extreme snowfall and are considered “historic”.
Check out more winter and other local weather data with the following links.
Winter Storms
Winter Season Records
Annual Weather Records
Wilmington National Weather Service