In the 2nd post related to the recently-released Censusdemographic data, I’ll look at Columbus city diversity and how it’s been changing since 2005, as well as how it compares to other regional and national peers.
Rank by City of Total White, non-Hispanic Population by Year
2005————————————–2010————————————-2015
1. Chicago, IL: 819,215————1. Chicago: 853,910—————1. Chicago: 879,318
2. Indianapolis, IN: 491,044——2. Indianapolis: 482,195———–2. Columbus: 491,602
3. Columbus: 442,958————-3. Columbus: 470,971————-3. Indianapolis: 479,376
4. Portland, OR: 382,033———-4. Portland: 417,876—————4. Portland: 449,552
5. San Antonio, TX: 356,420—–5. Austin: 384,065——————5. Austin: 444,638
6. Austin, TX: 347,013————-6. San Antonio: 351,420———-6. Nashville: 365,542
7. Nashville, TN: 314,518——–7. Nashville: 339,030————–7. San Antonio: 364,707
8. Charlotte, NC: 302,789——-8. Charlotte: 331,357—————8. Charlotte: 356,507
9. Virginia Beach, VA: 290,891–9. Virginia Beach: 282,812——9. Omaha: 293,631
10. San Jose, CA: 281,822—–10. Las Vegas: 280,604——-10. Virginia Beach: 281,686
11. Las Vegas, NV: 281,679—-11. Omaha: 277,606————–11. Las Vegas: 278,444
12. Omaha, NE: 267,685——–12. San Jose: 265,311————12. San Jose: 268,948
13. Kansas City, MO: 249,123—13. Kansas City: 247,473——13. Kansas City: 261,360
14. Milwaukee, WI: 219,891——14. Minneapolis: 242,848——14. Minneapolis: 243,709
15. Minneapolis, MN: 216,975—-15. Milwaukee: 221,514——-15. Milwaukee: 216,755
16. Toledo: 183,746—————–16. Pittsburgh: 203,622——–16. Pittsburgh: 192,187
17. Pittsburgh, PA: 180,725——-17. Toledo: 177,341————17. Toledo: 164,305
18. Sacramento, CA: 160,599—-18. Sacramento: 165,610—–18. Sacramento: 155,784
19. Cleveland: 147,359————19. Cincinnati: 143,120——–19. Cincinnati: 147,360
20. St. Louis, MO: 143,590——–20. Cleveland: 137,977——–20. St. Louis: 138,178
21. Cincinnati: 138,486————-21. St. Louis: 134,146———-21. Cleveland: 133,998
22. Akron: 128,976——————22. Akron: 120,800————22. Grand Rapids: 119,128
23. Grand Rapids, MI: 113,791—23. Grand Rapids: 104,636—-23. Akron: 117,587
24. Orlando, FL: 92,326————24. Orlando: 96,867————24. Orlando: 102,822
25. Detroit, MI: 77,163————–25. Dayton: 72,663————-25. Dayton: 75,539
26. Dayton: 67,581——————26. Providence: 64,284——-26. Detroit: 64,511
27. Providence, RI: 64,223——–27. Detroit: 55,298————-27. Providence: 61,492
Columbus moved from 3rd to 2nd over the 10-year period for total White, non-Hispanic population.
Rank by City of Total Black, non-Hispanic Population by Year
2005—————————————–2010———————————2015
1. Chicago: 938,097—————–1. Chicago: 895,294———–1. Chicago: 834,048
2. Detroit: 683,999——————–2. Detroit: 587,707————-2. Detroit: 536,527
3. Milwaukee: 222,040————–3. Charlotte: 251,274———-3. Charlotte: 282,456
4. Cleveland: 221,797—————4. Milwaukee: 230,473——–4. Indianapolis: 234,338
5. Charlotte: 205,216—————-5. Indianapolis: 226,314——-5. Columbus: 233,320
6. Indianapolis: 193,948————6. Columbus: 216,486———6. Milwaukee: 231,304
7. Columbus: 179,197—————7. Cleveland: 208,528———7. Cleveland: 194,350
8. St. Louis: 168,768—————-8. Nashville: 171,104———–8. Nashville: 178,293
9. Nashville: 148,051—————-9. St. Louis: 157,382———–9. St. Louis: 146,925
10. Kansas City: 131,694———-10. Kansas City: 138,461—–10. Kansas City: 140,515
11. Cincinnati: 131,010————-11. Cincinnati: 131,909——–11. Cincinnati: 125,621
12. Pittsburgh: 81,758————–12. Virginia Beach: 79,583—-12. San Antonio: 98,876
13. Virginia Beach: 80,004——–13. San Antonio: 79,307——13. Virginia Beach: 85,867
14. Orlando: 73,736—————–14. Toledo: 75,033————-14. Minneapolis: 78,861
15. Toledo: 72,190——————-15. Pittsburgh: 71,539——–15. Toledo: 76,173
16. Sacramento: 71,452————16. Orlando: 70,988————16. Pittsburgh: 73,012
17. San Antonio: 70,723————17. Minneapolis: 63,749——17. Las Vegas: 68,777
18. Dayton: 60,196——————-18. Sacramento: 61,976——18. Austin: 68,061
19. Akron: 59,810——————–19. Austin: 61,833————–19. Sacramento: 63,477
20. Las Vegas: 59,780————–20. Dayton: 61,402————-20. Orlando: 61,955
21. Austin: 59,583——————-21. Akron: 60,653—————-21. Akron: 58,716
22. Minneapolis: 57,499————22. Las Vegas: 60,187———22. Omaha: 57,546
23. Omaha: 50,333——————23. Omaha: 55,086————-23. Dayton: 51,896
24. Grand Rapids: 40,408———24. Grand Rapids: 41,848—–24. Portland: 35,362
25. Portland: 30,828—————25. Portland: 37,355————-25. Grand Rapids: 32,423
26. San Jose: 27,446————–26. San Jose: 29,831———–26. San Jose: 30,068
27. Providence: 18,794————27. Providence: 19,265——–27. Providence: 21,484
Columbus moved up from 7th to 5th in total Black, non-Hispanic during the period.
Rank by City of Total Asian, non-Hispanic Population by Year
2005————————————-2010——————————————2015
1. San Jose: 269,186————–1. San Jose: 303,227—————–1. San Jose: 355,777
2. Chicago: 127,686—————-2. Chicago: 148,280——————2. Chicago: 166,771
3. Sacramento: 80,307————3. Sacramento: 84,556————-3. Sacramento: 88,422
4. Portland: 36,278—————–4. Austin: 46,575———————-4. Austin: 69,696
5. Austin: 35,239——————–5. Portland: 43,185——————-5. Charlotte: 50,142
6. Columbus: 27,125—————6. Las Vegas: 37,406—————-6. Portland: 49,811
7. Las Vegas: 25,077————–7. Charlotte: 37,181——————7. Columbus: 42,933
8. Charlotte: 23,356—————-8. Columbus: 35,468—————-8. San Antonio: 41,988
9. Virginia Beach: 22,501———9. San Antonio: 29,200————-9. Las Vegas: 41,782
10. San Antonio: 20,492———10. Virginia Beach: 27,303—–10. Virginia Beach: 28,358
11. Minneapolis: 20,189———-11. Milwaukee: 22,670————11. Minneapolis: 26,958
12. Milwaukee: 19,596————12. Minneapolis: 21,426———–12. Indianapolis: 25,264
13. Nashville: 16,943—————13. Indianapolis: 17,137———-13. Milwaukee: 22,497
14. Indianapolis: 12,312———–14. Nashville: 17,045————–14. Nashville: 20,577
15. Providence: 10,751————15. Pittsburgh: 12,036————-15. Pittsburgh: 18,067
16. Pittsburgh: 10,727————–16. Providence: 11,497———–16. Omaha: 15,243
17. Kansas City: 10,674———-17. Kansas City: 10,263———–17. Kansas City: 13,552
18. Detroit: 9,577——————-18. St. Louis: 8,717—————–18. Providence: 10,842
19. St. Louis: 7,046—————–19. Omaha: 8,397——————19. St. Louis: 8,920
20. Omaha: 6,971——————20. Orlando: 7,870——————20. Detroit: 8,790
21. Cincinnati: 6,874—————21. Detroit: 6,549——————–21. Akron: 8,006
22. Cleveland: 6,289————–22. Cincinnati: 5,938—————–22. Orlando: 7,949
23. Orlando: 5,528—————–23. Cleveland: 5,392—————–23. Cleveland: 7,874
24. Toledo: 4,150——————-24. Akron: 4,567———————-24. Cincinnati: 6,259
25. Akron: 3,497——————–25. Grand Rapids: 3,695———–25. Toledo: 5,008
26. Grand Rapids: 2,847———26. Toledo: 3,125——————-26. Grand Rapids: 4,451
27. Dayton: 1,827——————27. Dayton: 1,231——————-27. Dayton: 1,548
Columbus fell from 6th to 7th in Asian, non-Hispanic population.
Rank by City of Total Hispanic Population by Year
2005——————————————–2010————————————2015
1. Chicago: 778,234—————1. San Antonio: 853,654———-1. San Antonio: 937,607
2. San Antonio: 735,458———–2. Chicago: 763,968—————2. Chicago: 787,725
3. San Jose: 279,420————–3. San Jose: 318,389————–3. San Jose: 331,232
4. Austin: 223,361——————4. Austin: 288,130——————4. Austin: 327,680
5. Las Vegas: 153,813————5. Las Vegas: 181,923————-5. Las Vegas: 204,913
6. Sacramento: 111,559———6. Sacramento: 124,461———–6. Sacramento: 150,153
7. Milwaukee: 80,945————-7. Milwaukee: 104,619————-7. Charlotte: 113,731
8. Providence: 60,008————-8. Charlotte: 96,246—————-8. Milwaukee: 110,335
9. Charlotte: 58,466—————9. Indianapolis: 78,467————-9. Orlando: 89,306
10. Indianapolis: 47,764———10. Providence: 76,645————10. Indianapolis: 83,426
11. Detroit: 46,993—————–11. Nashville: 61,212————–11. Providence: 77,968
12. Orlando: 43,978—————12. Portland: 58,986—————12. Nashville: 67,526
13. Portland: 43,324—————13. Orlando: 56,061—————13. Omaha: 63,516
14. Omaha: 39,674—————–14. Omaha: 53,661—————14. Portland: 61,064
15. Nashville: 37,463—————15. Kansas City: 49,800———15. Detroit: 53,980
16. Minneapolis: 37,017———–16. Detroit: 45,580—————-16. Columbus: 46,855
17. Kansas City: 35,995———–17. Columbus: 43,276————17. Kansas City: 46,037
18. Grand Rapids: 32,368———18. Cleveland: 36,067———-18. Cleveland: 40,603
19. Cleveland: 32,085————–19. Minneapolis: 34,504——-19. Minneapolis: 39,981
20. Columbus: 24,607———–20. Grand Rapids: 30,659——20. Virginia Beach: 36,309
21. Virginia Beach: 20,803——–21. Virginia Beach: 29,206—-21. Grand Rapids: 31,282
22. Toledo: 18,404——————22. Toledo: 21,346————–22. Toledo: 23,614
23. St. Louis: 8,268—————–23. St. Louis: 11,207————-23. St. Louis: 12,261
24. Pittsburgh: 5,018—————24. Cincinnati: 8,710————-24. Pittsburgh: 9,266
25. Cincinnati: 3,855—————25. Pittsburgh: 7,282————-25. Cincinnati: 9,121
26. Akron: 3,485——————–26. Akron: 3,990——————-26. Dayton: 4,945
27. Dayton: 1,693——————-27. Dayton: 3,180—————–27. Akron: 3,684
Columbus moved up from 20th to 16th in the total Hispanic population.
Rank by City of Total Other, non-Hispanic Population by Year
2005——————————————-2010———————————————–2015
1. Chicago: 38,694—————1. Chicago: 37,379————————–1. Chicago: 54,694
2. San Jose: 29,456————2. San Jose: 32,439————————2. San Jose: 40,894
3. Sacramento: 21,370———-3. Sacramento: 30,900——————-3. Portland: 36,398
4. Portland: 21,164————–4. Portland: 28,027————————4. Columbus: 34,357
5. Indianapolis: 20,242———-5. Las Vegas: 24,521—————–5. Sacramento: 32,909
6. Columbus: 20,096————-6. Columbus: 23,738——————6. Las Vegas: 29,853
7. San Antonio: 19,130———-7. San Antonio: 20,778—————7. San Antonio: 26,646
8. Minneapolis: 18,580———-8. Minneapolis: 20,753—————-8. Indianapolis: 26,019
9. Detroit: 18,324—————–9. Virginia Beach: 20,268————-9. Charlotte: 24,285
10. Las Vegas: 18,304———-10. Indianapolis: 20,086————–10. Nashville: 22,658
11. Virginia Beach: 16,685—-11. Charlotte: 18,360——————11. Austin: 21,765
12. Milwaukee: 14,476———-12. Detroit: 16,776——————–12. Minneapolis: 21,426
13. Kansas City: 13,399——–13. Milwaukee: 16,311———–13. Virginia Beach: 20,525
14. Austin: 13,261—————-14. Omaha: 15,519—————-14. Milwaukee: 19,263
15. Charlotte: 11,771————-15. Austin: 14,915—————–15. Omaha: 13,951
16. Omaha: 8,552—————–16. Kansas City: 14,668———-16. Kansas City: 13,897
17. Toledo: 7,447——————17. Nashville: 14,227————-17. Detroit: 13,316
18. Cincinnati: 7,315————–18. Pittsburgh: 12,080————18. Pittsburgh: 11,853
19. Cleveland: 7,004————–19. Toledo: 10,134—————-19. Cleveland: 11,234
20. Providence: 6,488————-20. Akron: 9,020——————20. Toledo: 10,678
21. Pittsburgh: 6,138————–21. Cleveland: 8,276—————21. Cincinnati: 10,176
22. St. Louis: 6,058—————-22. St. Louis: 7,704—————22. Akron: 9,560
23. Orlando: 5,731—————–23. Grand Rapids: 7,376——-23. St. Louis: 9,401
24. Nashville: 5,687—————24. Orlando: 7,251————–24. Orlando: 8,885
25. Akron: 4,431——————–25. Cincinnati: 7,230———–25. Grand Rapids: 7,815
26. Grand Rapids: 4,154———26. Providence: 6,471———-26. Providence: 7,418
27. Dayton: 1,382——————27. Dayton: 3,025—————27. Dayton: 6,669
Finally, Columbus moved up from 6th to 4th in the total of Other, non-Hispanic population. Overall, Columbus ranks fairly well in totals vs. its peers, as one might expect given that it is one of the largest cities in the grouping. However, to truly find out how it compares with these other cities, you have to look at percentages, which tells how much of the city’s populationis made up of each group.

Columbus had the 8th highest White, non-Hispanic % of total population of the city in 2015.
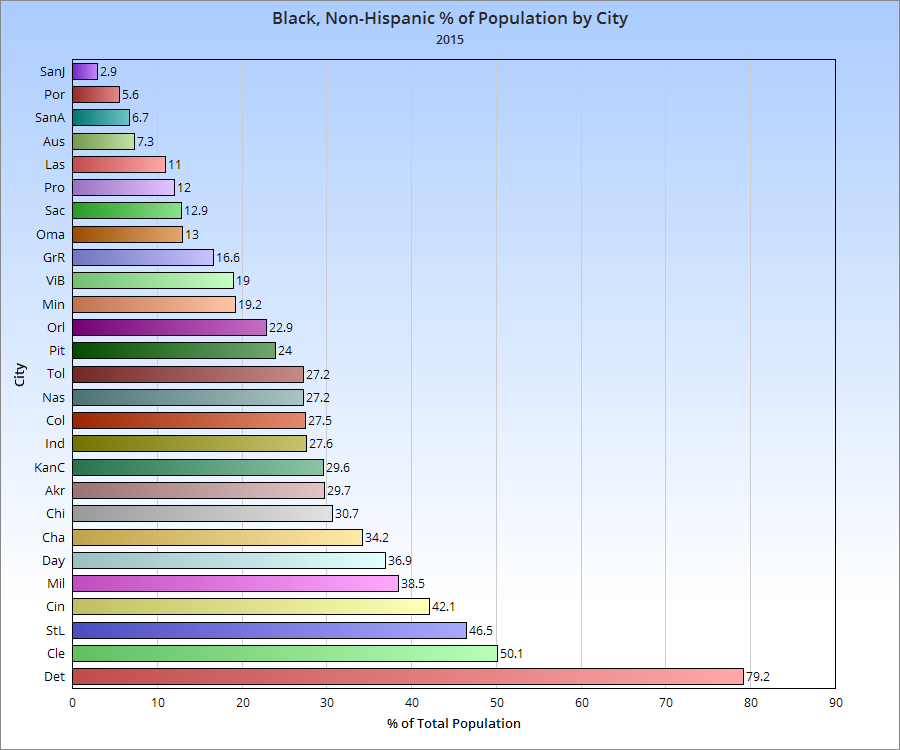
Columbus had the 12th highest Black, non-Hispanic % of total population.
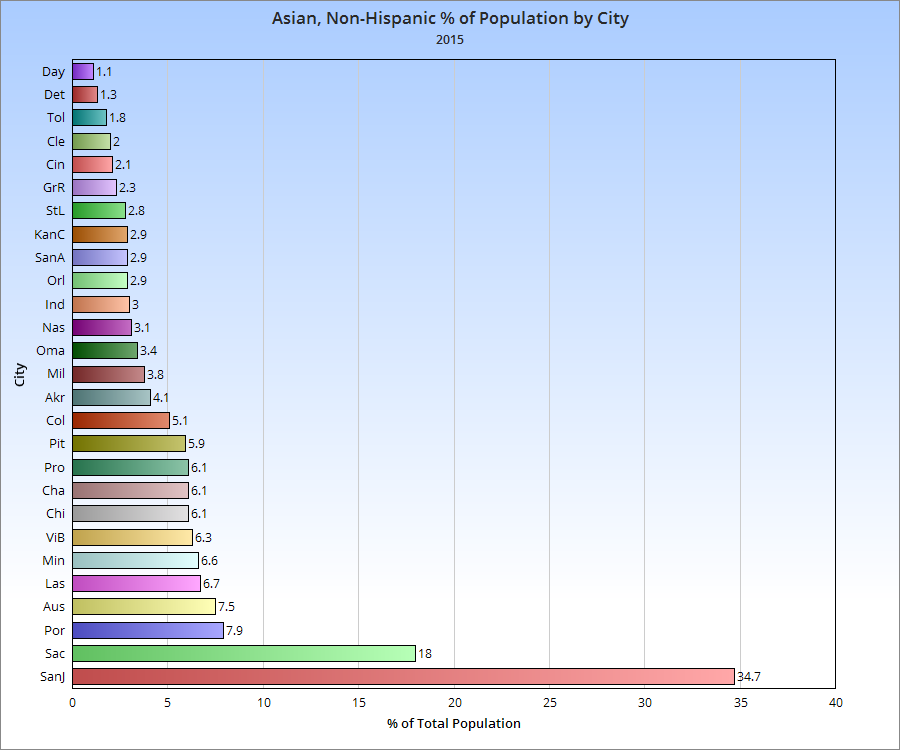
Columbus also had the 12th highest Asian, non-Hispanic % of total population.
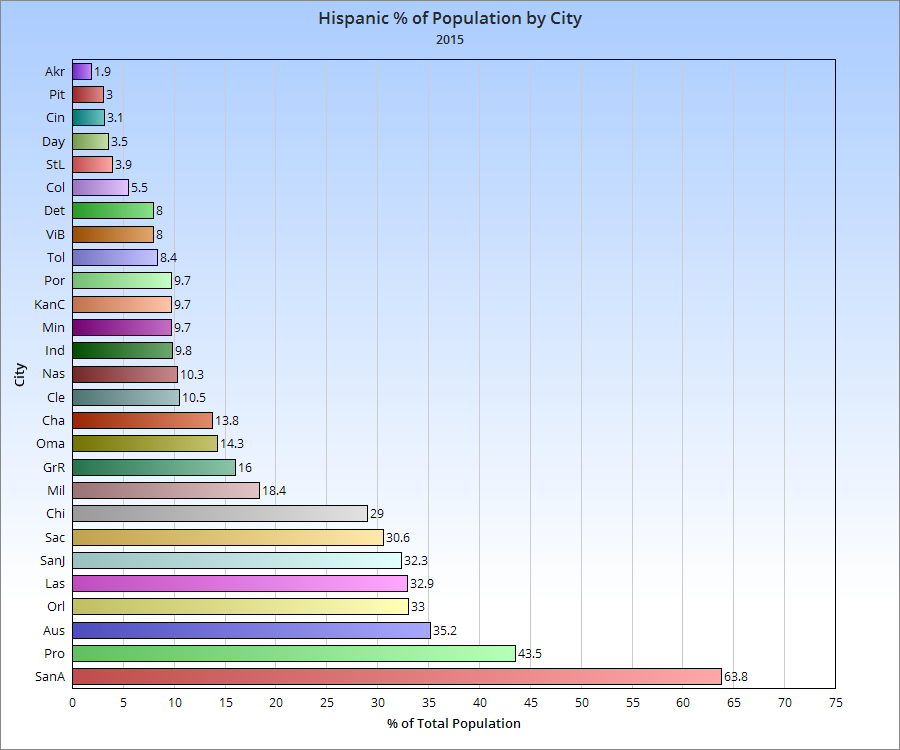
Columbus ranks poorly with Hispanics in the group, having only the 22nd highest % of population.
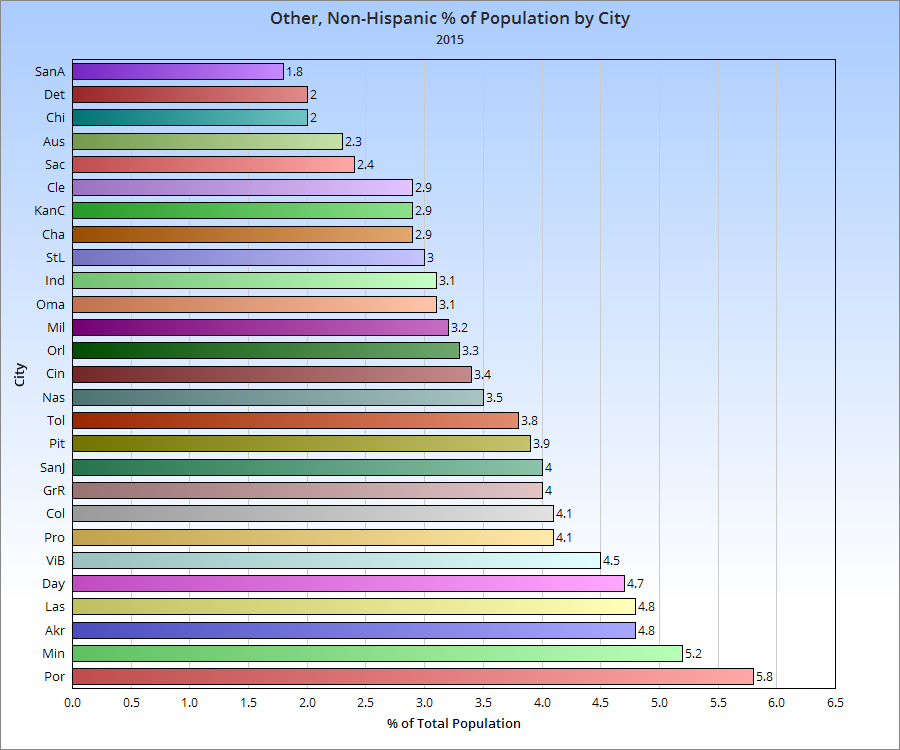
Finally, Columbus ranks 8th again in Other, non-Hispanic % of population.
So what’s the final ranking for where Columbus is with diversity compared to its peers? To find out, I assigned points based on ranked position in each 5 racial categories. The final total determined where the cities ranked overall.
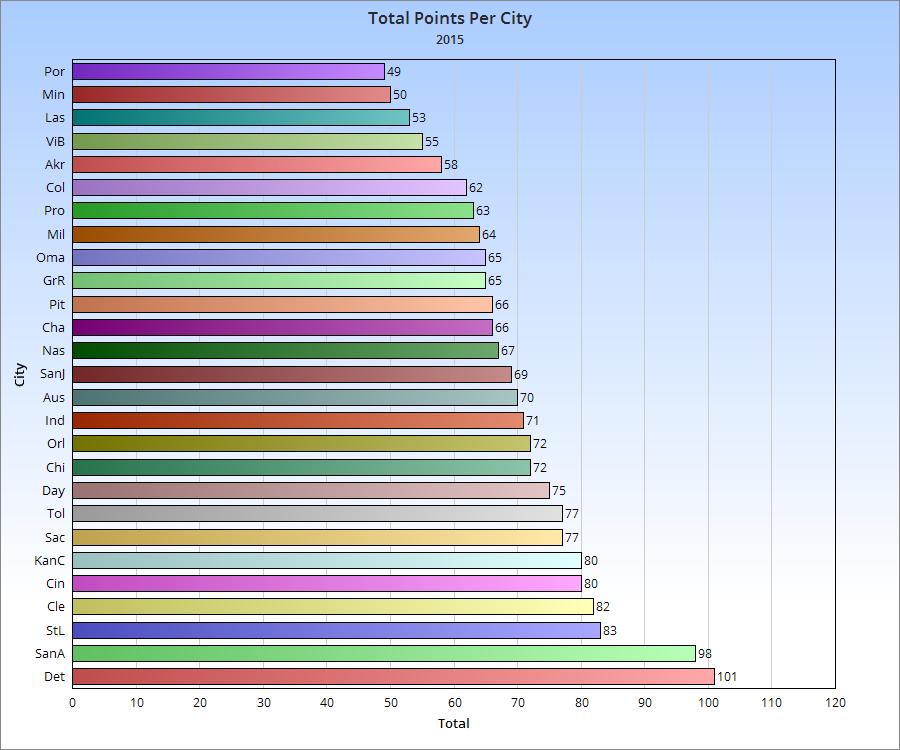
So based on this, Columbus is the 6th most racially diverse city of the 27 cities measured. This is no doubt surprising, but not so much when you get to the numbers.
*Note: Normally, Youngstown would be included, but the data was not available.