Peer and Columbus Metro Population Densities


Metro population densities

Over the years, I’ve learned that Columbus has a very suburban reputation, meaning that it is perceived to have very low density throughout, especially because it aggressively annexed suburban areas into the city limits decades ago. With those claims, I wondered what the metro population densities would be if Columbus’ area size was scaled down to others, with the goal of finding out if it really deserves the suburban reputation. Bare with me, because there is a lot to look at.

First, I used Columbus’ 18 peer metros (population 1.5-2.5 million) per the Census, as well as the 14 largest Midwest metros. Since there was some overlap in the 2 groups, it made for a total group comparison of 27. So a fairly sizeable group. Next, I used the mile marker population, which in the City Hall census analysis is made up of circles going out from the center. So it’s just a matter of finding the area of each circle and dividing the population into that. What’s left is the density by area.

Density at Mile Marker 1, with an Area of 3.14 Square Miles.
2000———————————-2010

1. Chicago: 42,492.4______________________ 1. Chicago:57,870.7
2. Minneapolis: 36,801.6__________________ 2. Minneapolis: 39,339.5
3. Providence, RI: 36,476.1_______________ 3. Providence, RI: 36,693.0
4. San Jose, CA: 31,854.8_________________ 4. San Jose, CA: 33,438.9
5. Las Vegas: 27,618.8____________________ 5. Milwaukee: 27,471.7
6. Milwaukee: 26,755.1____________________ 6. Portland, OR: 25,987.6
7. Grand Rapids, MI: 25,748.1_____________ 7. Las Vegas: 25,069.1
8. Pittsburgh: 25,570.7___________________ 8. Grand Rapids, MI: 24,080.6
9. Cincinnati: 22,728.0___________________ 9. Pittsburgh: 23,464.3
10. Portland, OR: 21,256.1________________ 10. Austin, TX: 23,149.4
11. Toledo: 20,973.6______________________ 11. Cincinnati: 20,781.5
12. Austin, TX: 20,301.9__________________ 12. San Antonio, TX: 18,596.8
13. San Antonio, TX: 20,156.7_____________ 13. Omaha: 17,905.7
14. Akron: 19,946.2_______________________ 14. Toledo: 17,751.3
15. Omaha: 17,922.6_______________________ 15. Akron: 17,106.7
16. Dayton: 16,311.5______________________ 16. Columbus: 15,817.5
17. Columbus: 16,151.6____________________ 17. Nashville: 15,529.3
18. Indianapolis: 15,865.6________________ 18. Sacramento, CA: 15,512.7
19. Nashville: 15,554.4___________________ 19. Charlotte, NC: 14,873.9
20. Sacramento, CA: 15,385.7______________ 20. Indianapolis: 14,356.4

Density at Mile Marker 2, with an Area of 12.57 Square Miles.
2000————————————–2010
1. Chicago: 22,808.1______________________ 1. Chicago: 25,339.9
2. San Jose, CA: 18,854.7_________________ 2. San Jose, CA: 19,696.3
3. Minneapolis: 17,936.8__________________ 3. Minneapolis: 18,212.2
4. Milwaukee: 16,799.9____________________ 4. Milwaukee: 16,609.1
5. Providence, RI: 16,134.9_______________ 5. Providence, RI: 16,457.6
6. Las Vegas: 16,016.4____________________ 6. Las Vegas: 15,331.4
7. Pittsburgh: 13,232.7___________________ 7. Austin, TX: 12,524.4
8. San Antonio, TX: 12,427.0______________ 8. Pittsburgh: 12,123.2
9. Cincinnati: 12,250.1___________________ 9. Portland, OR: 11,881.0
10. Austin, TX: 12,152.8__________________ 10. San Antonio, TX: 11,690.5
11. Columbus: 11,203.7____________________ 11. Sacramento, CA: 11,324.8
12. Akron: 10,999.9_______________________ 12. Cincinnati: 10,997.2
13. Grand Rapids, MI: 10,884.2____________ 13. Columbus: 10,726.0
14. Sacramento, CA: 10,606.1______________ 14. Grand Rapids, MI: 10,146.0
15. Dayton: 9,756.8_______________________ 15. Akron: 9,737.1
16. Indianapolis: 9,383.0_________________ 16. Omaha: 8,993.2
17. Omaha: 8,960.7________________________ 17. Indianapolis: 8,147.3
18. Toledo: 8,816.9_______________________ 18. Dayton: 8,100.0
19. Orlando: 8,212.5______________________ 19. Charlotte: 8,086.8
20. Charlotte: 8,095.5____________________ 20. Nashville: 7,777.6

Density at Mile Marker 3, with an Area of 28.27 Square Miles
2000————————————2010

1. Chicago: 17,528.7_____________________ 1. Chicago: 18,003.2
2. San Jose, CA: 13,883.0________________ 2. San Jose, CA: 14,549.2
3. Las Vegas: 11,646.0___________________ 3. Las Vegas: 11,576.2
4. Minneapolis: 11,494.2_________________ 4. Minneapolis: 11,503.3
5. Milwaukee: 11,448.9___________________ 5. Milwaukee: 11,288.0
6. Providence: 11,173.7__________________ 6. Providence, RI: 11,240.2
7. Pittsburgh: 10,594.4__________________ 7. Pittsburgh: 9,738.7
8. San Antonio. TX: 9,234.3______________ 8. Portland, OR: 8,973.6
9. Portland, OR: 8,257.0_________________ 9. San Antonio, TX: 8,846.8
10. Cincinnati: 8,141.9__________________ 10. Columbus: 7,834.0
11. Columbus: 8,134.9____________________ 11. Sacramento, CA: 7,668.7
12. Sacramento, CA: 7,261.5______________ 12. Austin, TX: 7,534.0
13. Austin, TX: 7,232.3__________________ 13. Cincinnati: 7,273.6
14. Akron: 6,925.4_______________________ 14. Grand Rapids, MI: 6,540.0
15. Grand Rapids, MI: 6,852.0____________ 15. Akron: 6,284.9
16. Indianapolis: 6,727.9________________ 16. Orlando: 6,055.1
17. Toledo: 6,651.5______________________ 17. Omaha: 5,968.3
18. Dayton: 6,382.8______________________ 18. Toledo: 5,982.1
19. St. Louis: 6,093.7___________________ 19. Indianapolis: 5,879.9
20. Kansas City: 6,025.1_________________ 20. St. Louis: 5,663.8

Density at Mile Marker 4, with an Area of 50.27 Square Miles
2000———————————2010

1. Chicago: 15,447.2____________________ 1. Chicago: 15,205.9
2. San Jose, CA: 12,209.3_______________ 2. San Jose, CA: 12,629.6
3. Las Vegas: 9,788.0___________________ 3. Las Vegas: 10,022.2
4. Minneapolis: 8,874.4_________________ 4. Minneapolis: 8,921.8
5. Milwaukee: 8,823.8___________________ 5. Milwaukee: 8,725.5
6. Providence, RI: 8,454.3______________ 6. Providence, RI: 8,483.8
7. Pittsburgh: 8,216.0__________________ 7. Portland, OR: 7,785.5
8. Portland, OR: 7,282.9________________ 8. Pittsburgh: 7,602.6
9. San Antonio, TX: 7,208.6_____________ 9. San Antonio, TX: 6,995.5
10. Cincinnati: 6,922.8_________________ 10. Cincinnati: 6,279.4
11. Columbus: 6,449.3___________________ 11. Columbus: 6,257.4
12. Sacramento, CA: 5,744.7_____________ 12. Sacramento, CA: 6,138.5
13. Austin, TX: 5,541.5_________________ 13. Austin, TX: 5,847.2
14. St. Louis: 5,447.5__________________ 14. Omaha: 5,047.2
15. Cleveland: 5,356.2__________________ 15. St. Louis: 5,001.6
16. Indianapolis: 5,348.8_______________ 16. Grand Rapids, MI: 4,922.9
17. Detroit: 5,163.1____________________ 17. Orlando: 4,911.7
18. Omaha: 5,019.8______________________ 18. Indianapolis: 4,793.5
19. Akron: 4,900.7______________________ 19. Akron: 4,532.0
20. Dayton: 4,889.3_____________________ 20. Cleveland: 4,521.8

Density at Mile Marker 5, with an Area of 78.54 Square Miles
Note that this area size is about the current city size of Cincinnati and Cleveland.
2000————————————2010
1. Chicago: 14,213.6___________________ 1. Chicago: 13,591.0
2. San Jose, CA: 10,464.0______________ 2. San Jose, CA: 11,037.1
3. Las Vegas: 8,521.9__________________ 3. Las Vegas: 9,062.8
4. Minneapolis: 7,443.0________________ 4. Minneapolis: 7,455.9
5. Milwaukee: 7,081.2__________________ 5. Milwaukee: 7,029.1
6. Pittsburgh: 7,009.9_________________ 6. Pittsburgh: 6,492.7
7. San Antonio, TX: 6,326.6____________ 7. Portland, OR: 6,442.3
8. Providence, RI: 6,048.3_____________ 8. San Antonio, TX: 6,223.4
9. Portland, OR: 5,950.1_______________ 9. Providence, RI: 6,055.8
10. Cincinnati: 5,588.9________________ 10. Sacramento, CA: 5,664.2
11. Cleveland: 5,494.6_________________ 11. Orlando: 5,274.1
12. Columbus: 5,252.9__________________ 12. Columbus: 5,152.1
13. Sacramento, CA: 5,104.0____________ 13. Cincinnati: 5,096.2
14. Orlando: 4,993.7___________________ 14. Austin, TX: 4,993.7
15. Austin, TX: 4,786.5________________ 15. Cleveland: 4,602.4
16. Detroit: 4,748.7___________________ 16. St. Louis: 4,285.4
17. St. Louis: 4,731.5_________________ 17. Indianapolis: 4,086.1
18. Indianapolis: 4,447.7______________ 18. Omaha: 3,962.2
19. Akron: 4,025.9_____________________ 19. Grand Rapids, MI: 3,887.3
20. Grand Rapids, MI: 3,990.6__________ 20. Akron: 3,778.8

So if Columbus was the same size as Cincinnati and Cleveland, it would be the most dense city of the 3. And it’s generally in the top half of the grouping in its most urban areas.

But what about further out, past the urban core?

Density at Mile Marker 10, with an Area of 314.16 Square Miles.
This area size is much larger than the city limits of Columbus, but it gives an idea of the larger area’s density and not just within the city limits.
2000———————————–2010
1. Chicago: 9,344.3______________________ 1. Chicago: 8,795.0
2. San Jose, CA: 4,563.2_________________ 2. San Jose, CA: 4,809.8
3. Minneapolis: 4,183.2__________________ 3. Las Vegas: 4,794.2
4. Detroit: 4,117.4______________________ 4. Portland, OR: 4,230.3
5. Las Vegas: 3,877.3____________________ 5. Minneapolis: 4,178.3
6. Portland: 3,780.8_____________________ 6. San Antonio, TX: 3,454.9
7. Cleveland: 3,308.4____________________ 7. Detroit: 3,354.7
8. Pittsburgh: 3,279.8___________________ 8. Columbus: 3,163.9
9. San Antonio, TX: 3,217.8______________ 9. Pittsburgh: 3,080.4
10. Milwaukee: 3,013.7___________________ 10. Orlando: 3,055.0
11. Columbus: 2,973.3____________________ 11. Sacramento, CA: 3,016.4
12. St. Louis: 2,937.6___________________ 12. Milwaukee: 3,006.2
13. Cincinnati: 2,873.4__________________ 13. Cleveland: 2,923.7
14. Orlando: 2,783.9_____________________ 14. Indianapolis: 2,772.6
15. Sacramento, CA: 2,736.7______________ 15. St. Louis: 2,751.3
16. Indianapolis: 2,652.6________________ 16. Cincinnati: 2,746.8
17. Kansas City: 2,599.0_________________ 17. Kansas City: 2,538.3
18. Providence, RI: 2,360.0______________ 18. Austin, TX: 2,439.6
19. Austin, TX: 2,111.3__________________ 19. Providence, RI: 2,375.1
20. Dayton: 1,920.7______________________ 20. Charlotte, NC: 2,332.7

So what does all this tell us? That while Columbus is not the most dense city of its peer group, or within the Midwest group, it probably does not wholly deserve its low-density, suburban reputation. Most of the measurements are in the top half of the grouping for density, yes, but it is clearly the most weak in the urban core closest to Downtown, as that ranking is the lowest for it. The Mile 0 population, for example, is down near the very bottom, and that is a good reason why densities are not as high as they should/could be. Currently, Downtown and surrounding neighborhoods are seeing a residential development boom, so that will help, but the city needs to think a lot bigger if it wants that stereotype to truly go away. The recent abandonment of the Convention Center mixed-use project is not a good way to go about that goal… and it should be a goal.

2013 City Population Estimates


2013 city population estimates

Today, the Census released new population figures for cities and incorporated places. I looked at all those places within the Columbus metro area and came up with the following stats on 2013 city population estimates.

Top 25 Largest Places in the Columbus Metro, July 1, 2013
1. Columbus: 822,553
2. Newark: 47,777
3. Dublin: 43,607
4. Lancaster: 39,325
5. Westerville: 37,530
6. Grove City: 37,490
7. Reynoldsburg: 36,526
8. Delaware: 36,459
9. Upper Arlington: 34,420
10. Gahanna: 34,051
11. Hilliard: 31,012
12. Marysville: 22,396
13. Pickerington: 19,085
14. Whitehall: 18,503
15. Pataskala: 15,160
16. Worthington: 13,837
17. Bexley: 13,455
18. Circleville: 13,444
19. Powell: 12,237
20. Heath: 10,45
21. London: 9,978
22. New Albany: 8,820
23. Canal Winchester: 7,543
24. Logan: 7,146
25. Grandview Heights: 6,943

Top 25 Largest Total Change 2012-2013
1. Columbus: +12,450
2. Dublin: +710
3. Grove City: +637
4. Delaware: +534
5. Lancaster: +422
6. Hilliard: +421
7. Pickerington: +375
8. Westerville: +321
9. Marysville: +284
10. New Albany: +282
11. Powell: +258
12. Gahanna: +215
13. Upper Arlington: +183
14. Reynoldsburg: +172
15. Bexley: +163
16. Canal Winchester: +143
17. Sunbury: +109
18. London: +107
19. Pataskala: +98
20. Groveport: +88
21. Whitehall: +87
22. Worthington: +69
23. Hanover: +67
24. Heath: +63
25. Lithopolis/Obetz/West Jefferson: +35

Top 25 Largest Total Change 2010-2013
1. Columbus: +35,520
2. Hilliard: +2,577
3. Grove City: +1,915
4. Dublin: +1,856
5. Delaware: +1,706
6. Westerville: +1,410
7. New Albany: +1,096
8. Gahanna: +806
9. Pickerington: +794
10. Powell: +737
11. Upper Arlington: +649
12. Reynoldsburg: +633
13. Lancaster: +545
14. Canal Winchester: +442
15. Whitehall: +441
16. Grandview Heights: +407
17. Bexley: +388
18. Sunbury: +326
19. Marysville: +302
20. Groveport: +269
21. Worthington: +262
22. Newark: +204
23. Johnstown: +200
24. Pataskala: +198
25. Heath: +142

Top 25 Largest % Changes 2012-2013
1. Hanover: +6.74%
2. New Albany: +3.30%
3. Lithopolis: +2.93%
4. Sunbury: +2.37%
5. Powell: +2.15%
6. Shawnee Hills: +2.12%
7. Pickerington: +2.00%
8. Canal Winchester: +1.93%
9. Grove City: +1.73%
10. Dublin: +1.66%
11. Groveport: +1.59%
12. Columbus: +1.54%
13. Delaware: +1.49%
14. Hilliard: +1.38%
15. Marysville: +1.28%
16. Bexley: +1.23%
17. Lancaster and London: +1.08%
18. Midway: +0.93%
19. Harrisburg: +0.92%
20. Westerville: +0.86%
21. Brice: +0.85%
22. Kirkersville and Obetz: +0.76%
23. Milford Center: +0.75%
24. Pataskala: +0.65%
25. Gahanna and Hemlock: +0.64%

Top 25 Largest % Changes 2010-2013
1. Hanover: +15.20%
2. New Albany: +14.19%
3. Lithopolis: +11.21%
4. Hilliard: +9.06%
5. Sunbury: +7.43%
6. Powell: +6.41%
7. Grandview Heights: +6.23%
8. Canal Winchester: +6.22%
9. Shawnee Hills: +6.17%
10. Grove City: +5.38%
11. Groveport: +5.02%
12. Delaware: +4.91%
13. Columbus: +4.51%
14. Dublin: +4.45%
15. Brice: +4.39%
16. Pickerington: +4.34%
17. Johnstown: +4.32%
18. Westerville: +3.90%
19. New Holland: +3.25%
20. Bexley: +2.97%
21. Harrisburg: +2.91%
22. Obetz: +2.74%
23. Riverlea: +2.57%
24. Lockbourne: +2.53%
25. Galena: +2.45%

Trends
Average Annual Growth 2000-2010 vs. 2010-2013 for the Top 25 Largest Places
2000-2010————2010-2013——–% Change

1. Upper Arlington: +9 +216 +2,300%
2. Bexley: -15 +129 +960.0%
3. Grandview Heights: -16 +136 +950.0%
4. Westerville: +80 +470 +487.50%
5. Circleville: -17 +43 +352.94%
6. Gahanna: +61 +269 +340.98%
7. Worthington: -55 +87 +258.18%
8. Whitehall: -114 +147 +228.95%
9. Hilliard: +400 +859 +114.75%
10. Columbus: +7,556 +11,840 +56.70%
11. New Albany: +400 +365 -8.75%
12. Grove City: +850 +638 -24.94%
13. Delaware: +951 +569 -40.17%
14. Dublin: +1,036 +619 -40.25%
15. Canal Winchester: +262 +147 -43.89%
16. Reynoldsburg: +382 +211 -44.76%
17. Lancaster: +345 +182 -47.25%
18. Newark: +129 +68 -47.29%
19. Powell: +525 +246 -53.14%
20. Pickerington: +850 +265 -68.82%
21. Heath: +178 +47 -73.60%
22. London: +113 +25 -77.88%
23. Marysville: +615 +107 -82.60%
24. Pataskala: +471 +66 -85.99%
25. Logan: +45 -2 -104.44%

So by the trends, it definitely appears that most suburbs have slowed, while Columbus and its inner suburbs increased. This seems like a pretty good indication of the ongoing urban movement to me.


King-Lincoln Neighborhood Profile


King-Lincoln neighborhood profile Columbus, Ohio

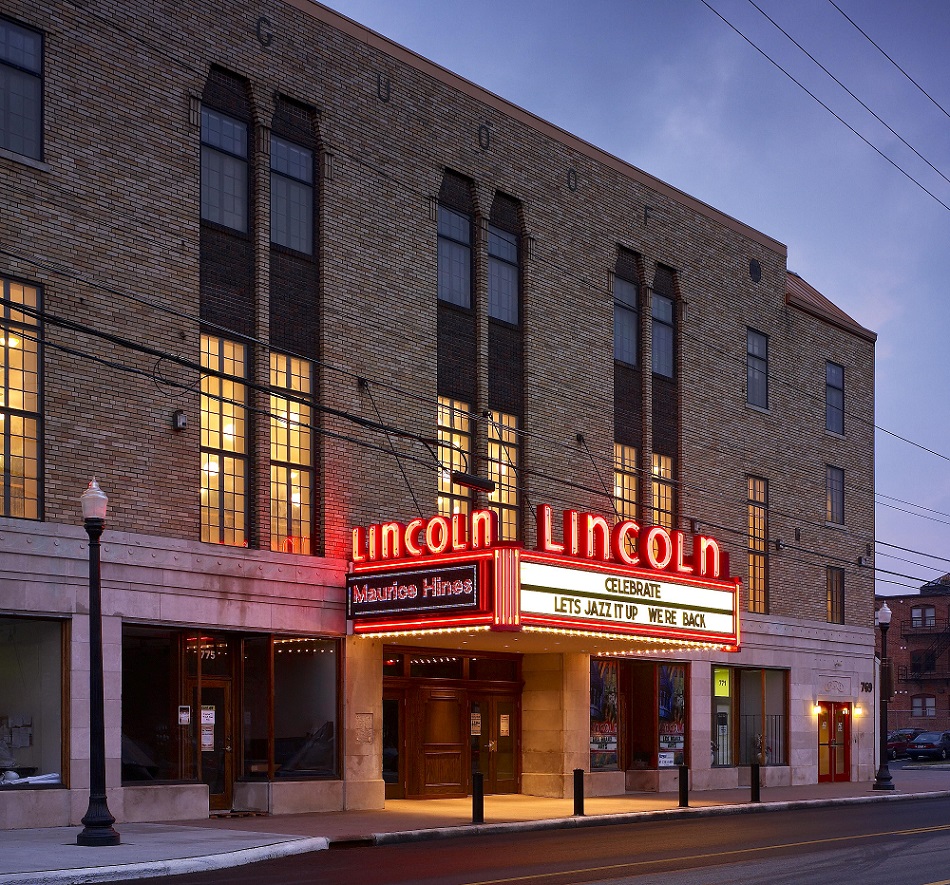
The Lincoln Theater.

This week is Demographics week. First up, ACD’s second neighborhood profile, featuring the King-Lincoln District, Columbus’ historically African American cultural heart.

I was going to write a history for the area, but this video tells it better than I ever could.

History aside, what I can do is provide a more detailed demographic picture from the past, present and possible future of the neighborhood.

Population
1930: 17,970
1940: 18,282
1950: 20,527
1960: 17,746
1970: 11,627
1980: 9,291
1990: 8,456
2000: 8,025
2010: 6,439

Population peaked around 1950, but during the 1950s began its long-term decline. Some might say this was a product of White Flight, but in this case, the neighborhood was already almost entirely non-White. The White Flight movement was more than just about racial demographic changes in neighborhoods, it was a factor of urban neglect. Just like in the rest of urban Columbus, King-Lincoln lost its urban appeal due to infrastructure deterioration, lack of city-focused leadership, decline of schools and increasing crime rates (among other things). One of the biggest blows to the area, just like what occurred with Olde Towne East to its south, was the construction of I-71 in the early 1960s. The highway cut the neighborhood off from Downtown, demolished hundreds of historic buildings, and allowed more people to effectively leave the neighborhood altogether. This is a good reason why the population dropped by almost 35% between 1960 and 1970.

The population loss rate had been slowing down each decade through 2000. During the 2000s, the city cleared out Poindexter Village, one of Columbus’ first public-housing projects and home to several hundred residents. This accounted for a very large chunk of the loss that occurred from 2000-2010 and why the loss increased during that time. The city is now tearing the complex down with plans for mixed-use development on the site. If not for this action by the city, it’s very likely that King-Lincoln would’ve had it’s lowest total population loss since the decline began in the 1950s.

Demographics
White
1990: 6.1%
2000: 6.2%
2010: 9.6%
Black
1990: 90.7%
2000: 87.7%
2010: 84.0%
Asian
1990: 2.4%
2000: 0.7%
2010: 0.5%
Hispanic
1990: 0.6%
2000: 1.1%
2010: 2.2%
Other
1990: 0.9%
2000: 5.4%
2010: 5.9%

% Change By Demographic for Each Decade
1990-2000

White: -3.7%
Black: -8.2%
Asian: -71.6%
Hispanic: +63.0%
Other: +501.4%
2000-2010
White: +24.5%
Black: -23.1%
Asian: -42.1%
Hispanic: +60.2%
Other: -11.8%
The demographics for the last 30 years show Hispanic and White populations are becoming an ever larger chunk of the neighborhood, while Asians have declined significantly. The African American population is still, by far, the largest demographic, but it too is on a long-term decline. This suggests a gradual gentrification of the neighborhood.

And what of the future of the area? Significant revitalization news has been coming out in recent months. As mentioned above, the 36-building Poindexter Village, long a hot spot for crime and concentrated poverty, is currently in the process of being torn down. The site will be replaced with residential, retail, office and arts space over time. A larger area plan was recently announced here: http://www.columbusunderground.com/pact-plans-165-million-strategic-redevelopment-for-near-east-side. The $165 million plan will focus on King-Lincoln’s main thoroughfares: East Long Street, Mount Vernon Avenue and Taylor Avenue. Increasing density with mixed-use development and revitalizing the commercial corridors is a big part of the plan, as well as infrastructure and green space improvement. Smaller developments include Homeport’s housing renovations, which have been very successful so far.

So while King-Lincoln has seen better days, the neighborhood is currently in transition. 5-10 years from now, the neighborhood should be radically changed, hopefully for the better. Its proximity to Downtown and other central neighborhoods give it a great advantage as the city has become fairly popular again.


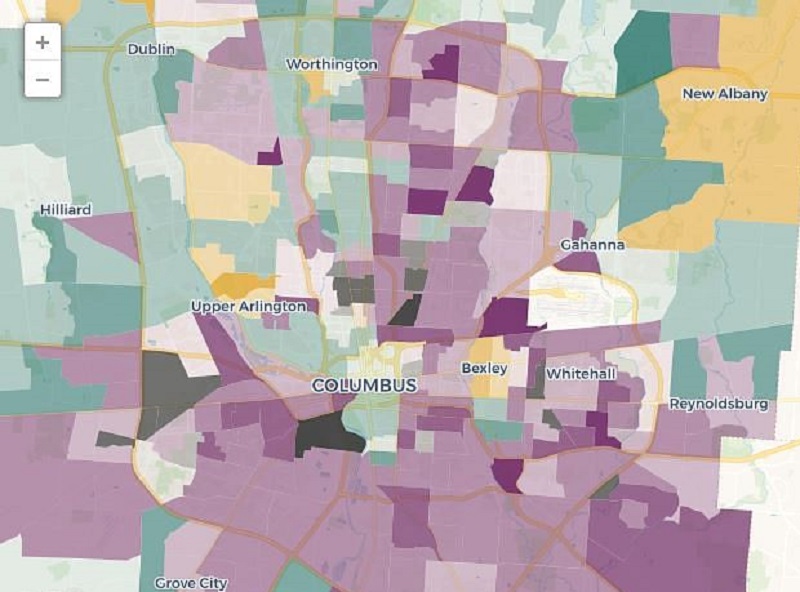
2011 Census Tract Estimates


2011 census tract estimates Columbus, Ohio

While I wouldn’t normally make a post on the 2011 census tract estimates- or any other estimates for them- because I really don’t know what their reliability is, I thought it might be an interesting exercise.

I only looked at those tracts that made up the original 1950 boundaries as well as some of the adjacent areas. I won’t go into too much detail, but…

In 2010, only 20 of the 78 tracts I looked at were growing. Well, specifically, only 20 grew during the 2000-2010 period, not just in 2010 alone. So several more could’ve been starting to recover in 2010, but since it measured the whole decade, it might still show up as a loss. In any case, the 2011 estimates are interesting just because they show a much different picture.

If I use the exact estimate used, 34 of the 78 tracts were growing in 2011, a significant improvement. However, some of the estimates were hard to understand where they came from. For example, they had Downtown tracts, which have had rapid growth the last decade, as declining in population for 2011, even while more and more residential units are built and more people move into the area. Also, they showed some tracts gaining population when the long-term trend is for significant loss and no reason to see that reversing.

So using the margin of error as a guide, I went back over them and did my own estimates. Of the 78 tracts, I only did my own for 14, as they were the only ones I felt didn’t match the reality on the ground or the long-term trends. With those changes, 38 of the 78 were growing, a slight increase of the official 34.

If we use the official estimates, the total population for the 78 tracts was 232,297, a loss of 2,285 since 2010. If we use my estimates, the population would be 237,806, or an increase of 3,224. So what’s the real story? Well, new 2012 tract estimates will be coming out soon. When they do, I will compare and see what, if any, updates should be made. The only real way to know, however, is to wait until 2020 with the next census. Still, until that time, it’s fun to look at the numbers- or maps– and see if the urban core is recovering in the same way that cities and towns are in and around Franklin County.


2012 Urban Population Trends


2012 urban and suburban population trends

I posted the 2012 city estimates from the US Census yesterday. Within them may be an interesting trend that has long-term implications for Columbus and other cities, so today we’re going to go over 2012 urban population trends, and see how they compare.

A lot of the talk in the news in recent years has been how urban core cities are seeing a comeback of sorts. I’ve made mention of it several times, myself, with hard data located on the Demographics and Population part of this site. However, there is some disagreement between urban proponents and suburban proponents about what’s really going on, and that disagreement seems to focus mostly around if the city is growing faster than the suburbs, and if so, if that trend can be sustained.

Looking over the estimates, I noticed something that may support the urban back-to-the-city argument, at least in Columbus. What I noticed was that those villages/towns/cities that were growing tended to be clustered closer to the urban core of the metro than those that were losing population.

I first gathered the data on the Columbus metro area’s 99 incorporated places, ranging in population from 36 on up to Columbus’ 809,798. I then measured the distance between Columbus’ Downtown center and the center of all 99 places. I then broke them up into increments of about 5 miles each. Here is some of what I found.

Average Total Population Growth by Place 2010-2012 by Distance from Columbus’ Center
0-4.9 Miles: 3,962.8
5-9.9 Miles: 438.4
10-14.9 Miles: 342.8
15-19.9 Miles: 26.5
20-24.9 Miles: 148.9
25+ Miles: 10.5

What this says, is that for the most part, the closer a place is to the center, the more total average growth it’s had since 2010. While the 0-4.9 mile distance is somewhat skewed because it includes Columbus’ growth, there is also a significant drop-off beyond 15 miles from the center.

Next, I looked at all the places that saw either 0 population change or a loss during the 2010-2012 period. Again, it was separated by the distance from Columbus’ center.

0-4.9 Miles: 0 of 6, or 0.0%
5-9.9 Miles: 0 of 12, or 0.0%
10-14.9 Miles: 1 of 12, or 8.3%
15-19.9 Miles: 2 of 8, or 25.0%
20-24.9 Miles: 2 of 10, or 20.0%
25+ Miles: 21 of 51, or 41.2%

What this shows is that the further the distance away from the center, in general, the more places there were that were stagnant or lost population since 2010.

Finally, I looked at the top 15 total population increases of all places from 2010-2012, as well as their distance from Columbus’ center.
1. Columbus (obviously): +22,765- 0 Miles
2. Hilliard: +2,129- 9.9 Miles
3. Grove City: +1,257- 7.4 Miles
4. Delaware: +1,172- 23.6 Miles
5. Dublin: +1,155- 11.3 Miles
6. Westerville: +953- 12.0 Miles
7. New Albany: +783- 13.0 Miles
8. Gahanna: +580- 7.5 Miles
9. Powell: +460- 14.2 Miles
10. Reynoldsburg: +454- 9.9 Miles
11. Upper Arlington: +432- 4.1 Miles
12. Pickerington: +401- 14.1 Miles
13. Grandview Heights: +374- 2.6 Miles
14. Whitehall: +341- 6.0 Miles
15. Canal Winchester: +292- 12.7 Miles

12 of the 15 are within Franklin County. Another 2 (Pickerington and Powell) are near the Franklin County border. Only Delaware is beyond 15 miles from Columbus’ center.

So do these numbers show a real trend? Maybe. Some of the questions are: Do 2 years of data support a real trend or just a blip? Is this really an urban movement or a rural decline… or both? Is this a new/recent trend or have the numbers been changing? Those questions and others need to be answered before making a definitive statement, but if nothing else, they are a positive indication that Columbus and it’s immediate surroundings remain the metro’s (and Ohio’s) strongest population draw.