After a very long delay, the 2020 Census data has arrived! In this first series of related posts, we will compared Columbus to national peer and Midwest metro areas. Metros used here are those that were within 1.5-2.5 million in either 2010 or 2020, as well as Midwest metros of 500,000 or more in either 2010 or 2020, and all Ohio metros.
Total Population by Metro Area by Year Green metros moved up in the rankings 2010-2020 and red moved down.
Rank
2010
2020
1
Chicago: 9,461,105
Chicago: 9,618,502
2
Detroit: 4,296,250
Detroit: 4,392,041
3
Minneapolis: 3,346,859
Minneapolis: 3,690,261
4
St. Louis: 2,787,701
St. Louis: 2,820,253
5
Pittsburgh: 2,356,285
Orlando: 2,673,376
6
Charlotte: 2,243,960
Charlotte: 2,660,329
7
Portland: 2,226,009
San Antonio: 2,558,143
8
Sacramento: 2,149,127
Portland: 2,512,859
9
San Antonio: 2,142,508
Sacramento: 2,379,382
10
Cincinnati: 2,137,667
Pittsburgh: 2,370,930
11
Orlando: 2,134,411
Austin: 2,283,371
12
Cleveland: 2,077,240
Las Vegas: 2,265,461
13
Kansas City: 2,009,240
Cincinnati: 2,256,884
14
Las Vegas: 1,951,269
Kansas City: 2,192,035
15
Columbus: 1,901,974
Columbus: 2,138,926
16
Indianapolis: 1,887,877
Indianapolis: 2,111,040
17
San Jose: 1,836,911
Cleveland: 2,088,251
18
Austin: 1,716,289
San Jose: 2,000,251
19
Virginia Beach: 1,713,954
Nashville: 1,989,519
20
Nashville: 1,646,200
Virginia Beach: 1,799,674
21
Providence: 1,600,852
Providence: 1,676,579
22
Milwaukee: 1,555,908
Jacksonville: 1,605,848
23
Jacksonville: 1,345,596
Milwaukee: 1,574,731
24
Grand Rapids: 993,670
Grand Rapids: 1,087,592
25
Omaha: 865,350
Omaha: 967,604
26
Dayton: 799,232
Dayton: 809,248
27
Akron: 703,200
Des Moines: 707,915
28
Toledo: 651,429
Akron: 701,449
29
Wichita: 623,061
Madison: 670,447
30
Des Moines: 606,475
Wichita: 643,768
31
Madison: 605,435
Toledo: 641,549
32
Youngstown: 565,773
Lansing: 548,248
33
Lansing: 534,684
Youngstown: 531,420
34
Canton: 404,422
Canton: 396,669
Columbus largely held its own in the rankings this decade, but it poised to eventually pass a few of the metros currently ahead of it.
Columbus had the 2nd highest growth in the Midwest after Minneapolis, and is growing much faster than 3 metros currently ranked ahead of it- Cincinnati, Kansas City and Pittsburgh- which it will likely pass at some point in the future. For Cincinnati, for example, current growth rates would suggest Columbus will pass it sometime around 2027. In any event, Columbus’ metro growth was the highest in its history, and about 10,000 more than occurred during the 2000s.
Data related to metro components of growth, such as immigration and deaths vs. births, have yet to be released. Those should come out sometime next month, and will be posted here when they do.
In Franklin County, the immigrant- or foreign-born- population has been growing rapidly for the last few decades. Latin American immigration was dominant for many years, but has recently taken secondary position to even faster Asian growth. But where does the immigrant population live, exactly? Where they end up in the county is perhaps not where common belief would always suggest. The interactive map below breaks down not only the main continent of origin for immigrants by census tract, but also gives the top 5 specific origin nations. While at first glance, the continents seem heavily grouped together, a deeper look at nations of origin indicate that immigrant populations are much more diverse and spread out much more evenly than it appears.
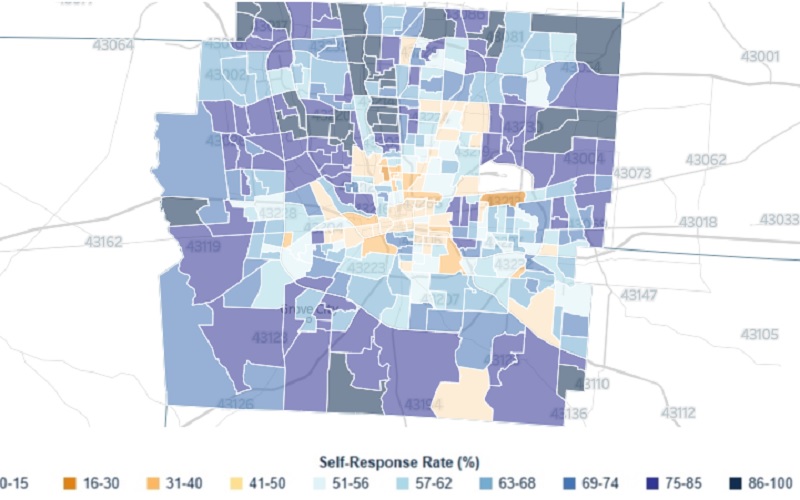
The 2020 US Census is currently winding down, perhaps somewhat earlier than planned, but wrapping up nonetheless. The accuracy of the Census relies heavily on enough people responding to the surveys. Because of the pandemic this year, the internet has played a bigger role in the response rates than normal, but there were still plenty of door to door workers doing surveys. How did Columbus, Central Ohio and other parts of the state do? Here are the Ohio census 2020 response rates.
First, let’s look at Ohio counties. These numbers are through September 2nd.
Top 10 counties for Census Response 1. Medina County: 81.9% 2. Delaware County: 79.7% 3. Geauga County, Warren County: 78.7% 4. Union County: 78.0% 5. Lake County: 77.4% 6. Auglaize County: 76.9% 7. Wayne County: 76.8% 8. Greene County: 76.0% 9. Miami County: 75.9% 10. Fulton County: 75.2%
Bottom 10 Counties for Census Response 1. Harrison County: 55.5% 2. Morgan County: 57.7% 3. Vinton County: 57.9% 4. Pike County: 58.5% 5. Monroe County: 58.8% 6. Lawrence County: 59.3% 7. Scioto County: 59.4% 8. Meigs County: 59.6% 9. Adams County: 59.9% 10. Ashtabula County, Athens County: 60.8%
Most of the high-reporting counties were large metro counties, while most of the low ones were Appalachia. This may be related to access to the internet, which again, played a crucial role this year.
Here are the counties that anchor Ohio’s largest metros Lucas County: 64.6% Cuyahoga County: 65.5% Franklin County: 66.7% Hamilton County: 66.7% Mahoning County: 67.4% Montgomery County: 68.0% Stark County: 74.3%
Columbus’ Franklin County was tied for 3rd worst.
Now let’s look at Central Ohio cities and towns. Minerva Park: 88.6% Worthington: 86.8% Upper Arlington: 85.7% Westerville: 83.2% Dublin: 82.7% Canal Winchester: 81.8% Grandview Heights: 81.8% Gahanna: 81.1% New Albany: 81.1% Bexley: 79.5% Grove City: 78.9% Groveport: 78.9% Pataskala: 77.4% Hilliard: 77.0% Valleyview: 76.5% Reynoldsburg: 75.3% Obetz: 72.7% Pickerington: 71.6% Columbus: 62.1% Whitehall: 58.5%
Generally, the more urban commmunities tended to do worse than the outer suburbs. This has implications on urban areas possibly being undercounted, though the response rates are generally similar to what they were in 2010, so that concern is probably overblown to some extent.
If your’e interested in taking a further look at Ohio’s and other states numbers, visit the following link, in which response rates are tracked all the way down to the Census Tract level: https://2020census.gov/en/response-rates/self-response.html
There have been a lot of updates and additions to the site in the last month.
The Historic Building Database pages now contain more than 1,200 buildings.
A new Local Sports History page has been added under the History tab. It contains information on Columbus’ college, minor and major league sports teams going back to the 19th Century.
The May Weather page has been updated with 2020 data, and records can be viewed back to 1879.
The numerous severe weather pages have all been updated to some degree over the past month or so with more links, events and even videos.
The Demographics and Population pages have been updated with 2019 population data, as well as various information related to income, GDP, housing and more!
Finally, a new Columbus Crime Statistics page has been added under the Demographics and Population tab. You can view total crimes, crime rates and maps going back to 1985.
The Census has just released 2019 city population estimates. These estimates are good for July 1, 2019. Let’s take a look at how Columbus compares to other cities in Ohio.
In 2010, 4 Columbus metro communities were in the top 30. By last year, 6 were, with more poised to enter the list in the coming years. This represents the Columbus region’s growing influence in the state and how its share of the state’s population continues to increase.
2018 to 2019, Columbus had 12 cities in the top 30, a lower number than the average of the decade. This is not necessarily indicating a slowdown in growth within the metro, however. The final year before a decennial census, population estimates tend to be used for final adjustments. This means that if a city is thought to have been estimated too high or too low through the decade, the final estimate year is adjusted accordingly and not necessarily according to true growth. The point of estimates is to get a snapshot of the population at the time of the estimate, but they are constantly being changed every time a new estimate comes out. This usually leaves the final estimate year as showing the slowest growth. This was true for 2008-2009 as well.
Out of the 101 communities of any size in the Metro, 81 of them have either steady populations or estimated growth since 2010. Most of the 20 that have shown declines are very small communities in the Appalachia counties of Perry and Hocking, the furthest removed from Columbus’ influence.