
The 2020 US Census is currently winding down, perhaps somewhat earlier than planned, but wrapping up nonetheless.
The accuracy of the Census relies heavily on enough people responding to the surveys. Because of the pandemic this year, the internet has played a bigger role in the response rates than normal, but there were still plenty of door to door workers doing surveys. How did Columbus, Central Ohio and other parts of the state do? Here are the Ohio census 2020 response rates.
First, let’s look at Ohio counties. These numbers are through September 2nd.
Top 10 counties for Census Response
1. Medina County: 81.9%
2. Delaware County: 79.7%
3. Geauga County, Warren County: 78.7%
4. Union County: 78.0%
5. Lake County: 77.4%
6. Auglaize County: 76.9%
7. Wayne County: 76.8%
8. Greene County: 76.0%
9. Miami County: 75.9%
10. Fulton County: 75.2%
Bottom 10 Counties for Census Response
1. Harrison County: 55.5%
2. Morgan County: 57.7%
3. Vinton County: 57.9%
4. Pike County: 58.5%
5. Monroe County: 58.8%
6. Lawrence County: 59.3%
7. Scioto County: 59.4%
8. Meigs County: 59.6%
9. Adams County: 59.9%
10. Ashtabula County, Athens County: 60.8%
Most of the high-reporting counties were large metro counties, while most of the low ones were Appalachia. This may be related to access to the internet, which again, played a crucial role this year.
Here are the counties that anchor Ohio’s largest metros
Lucas County: 64.6%
Cuyahoga County: 65.5%
Franklin County: 66.7%
Hamilton County: 66.7%
Mahoning County: 67.4%
Montgomery County: 68.0%
Stark County: 74.3%
Columbus’ Franklin County was tied for 3rd worst.
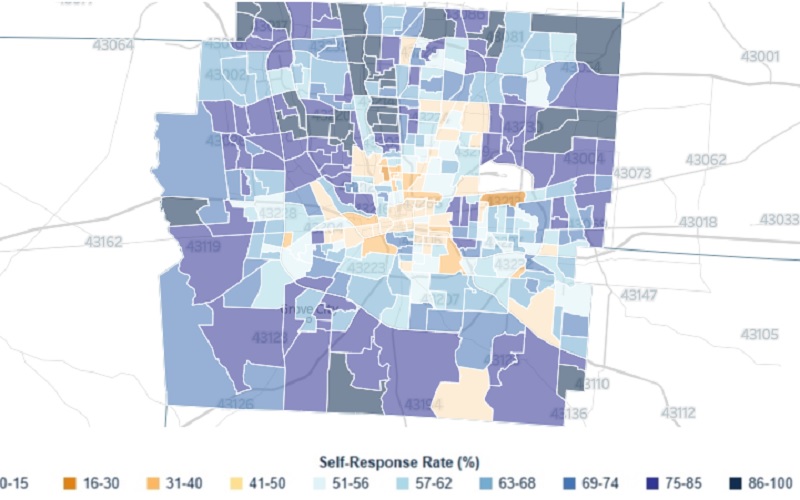
Now let’s look at Central Ohio cities and towns.
Minerva Park: 88.6%
Worthington: 86.8%
Upper Arlington: 85.7%
Westerville: 83.2%
Dublin: 82.7%
Canal Winchester: 81.8%
Grandview Heights: 81.8%
Gahanna: 81.1%
New Albany: 81.1%
Bexley: 79.5%
Grove City: 78.9%
Groveport: 78.9%
Pataskala: 77.4%
Hilliard: 77.0%
Valleyview: 76.5%
Reynoldsburg: 75.3%
Obetz: 72.7%
Pickerington: 71.6%
Columbus: 62.1%
Whitehall: 58.5%
Generally, the more urban commmunities tended to do worse than the outer suburbs. This has implications on urban areas possibly being undercounted, though the response rates are generally similar to what they were in 2010, so that concern is probably overblown to some extent.
If your’e interested in taking a further look at Ohio’s and other states numbers, visit the following link, in which response rates are tracked all the way down to the Census Tract level: https://2020census.gov/en/response-rates/self-response.html