The Columbus metro has never been Ohio’s largest job market, but that seems to be changing over time.
The January 2015 labor force jumped to a record high, and if trends hold, may pass the other 2 Cs by the end of the year.

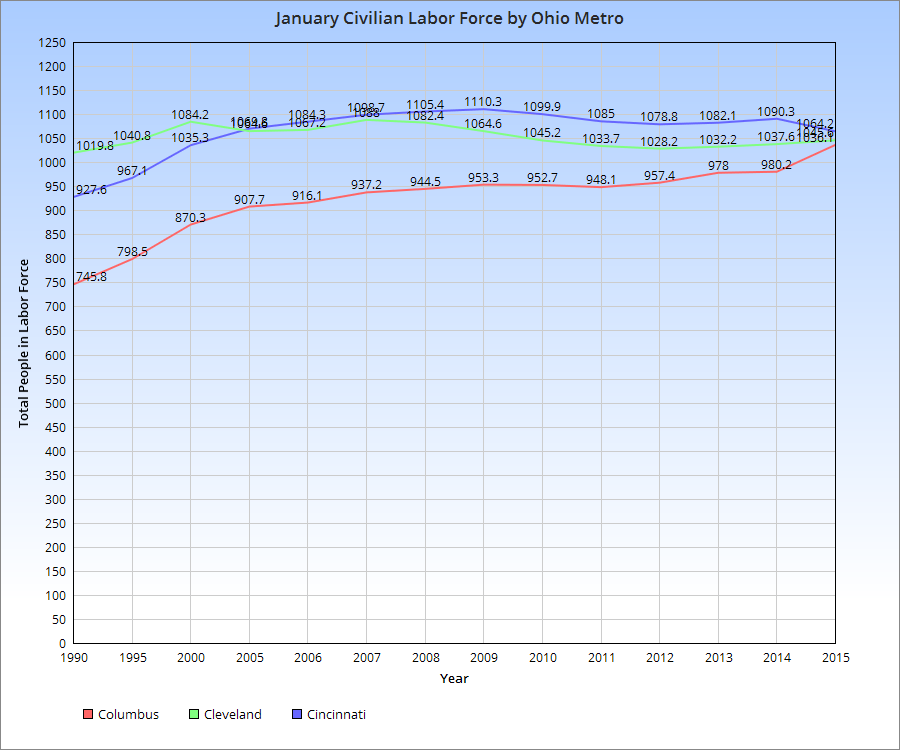
The Columbus metro has never been Ohio’s largest job market, but that seems to be changing over time.
The January 2015 labor force jumped to a record high, and if trends hold, may pass the other 2 Cs by the end of the year.
![]()
![]()
These latest June 2013 jobs data numbers are from the Bureau of Labor Statistics
Columbus City
Unemployment Rate: 6.4%
Unemployment Rate Change since June 2012: -0.1
Unemployment Rate Change since January 2013: -0.4
Civilian Labor Force: 438,100
Civilian Labor Force Change since June 2012: +5,000
Civilian Labor Force Change since January 2013: +11,700
Employment: 409,900
Employment Change since June 2012: +5,100
Employment Change since January 2013: +12,600
Unemployment: 28,200
Unemployment Change since June 2012: -100
Unemployment Change since January 2013: -900
Franklin County
Unemployment Rate: 6.4%
Unemployment Rate Change since June 2012: -0.1
Unemployment Rate Change since January 2013: -0.4
Civilian Labor Force: 640,600
Civilian Labor Force Change since June 2012: +7,400
Civilian Labor Force Change since January 2013: +16,900
Employment: 599,600
Employment Change since June 2012: +7,500
Employment Change since January 2013: +18,600
Unemployment: 41,100
Unemployment Change since June 2012: +0
Unemployment Change since January 2013: -1,500
Columbus Metro Area
Unemployment Rate: 6.4%
Unemployment Rate Change since June 2012: +0
Unemployment Rate Change since January 2013: -0.6
Civilian Labor Force: 992,617
Civilian Labor Force Change since June 2012: +12,256
Civilian Labor Force Change since January 2013: +24,712
Employment: 929,158
Employment Change since June 2012: +11,636
Employment Change since January 2013: +28,702
Unemployment: 63,459
Unemployment Change since June 2012: +620
Unemployment Change since January 2013: -3,990
Ohio Overall
Unemployment Rate: 7.2%
Unemployment Rate Change since June 2012: -0.1
Unemployment Rate Change since January 2013 : +0.2
Civilian Labor Force: 5,756,192
Civilian Labor Force Change since June 2012: +9,844
Civilian Labor Force Change since January 2013: +15,900
Employment: 5,343,335
Employment Change since June 2012: +15,079
Employment Change since January 2013: +2,483
Unemployment: 412,857
Unemployment Change since June 2012: -5,235
Unemployment Change since January 2013: +13,417
Metro Non-Farm Jobs
Total: 972,400
Change from June 2012: +15,200
Change from January 2013: +28,800
By Industry
Mining/Logging/Construction Total: 31,900
Change from June 2012: +1,000
Change from January 2013: +5,000
Manufacturing Total: 67,800
Change from June 2012: +1,400
Change from January 2013: +2,800
Trade/Transportation/Utilities Total: 181,600
Change from June 2012: -700
Change from January 2013: -1,600
Information Total: 16,400
Change from June 2012: -400
Change from January 2013: -100
Financial Activities Total: 71,800
Change from June 2012: +0
Change from January 2013: +100
Professional and Business Services Total: 161,900
Change from June 2012: +3,400
Change from January 2013: +6,300
Education and Health Services Total: 142,800
Change from June 2012: +6,600
Change from January 2013: +3,300
Leisure and Hospitality Total: 102,100
Change from June 2012: +4,700
Change from January 2013: +13,600
Other Services Total: 36,600
Change from June 2012: -500
Change from January 2013: +400
Government Total: 159,500
Change from June 2012: -300
Change from January 2013: -1,000
Overall, June was a pretty good month for Columbus and the state. Unemployment rose, but mostly because the labor force had strong growth, which is a sign of more people entering a recovering job market. Most industries saw job growth both year-over-year and year-to-date.

That latest April 2013 jobs data comes from the Bureau of Labor Statistics.
Columbus City
Unemployment Rate: 5.7%
Unemployment Rate Change since April 2012: -0.6
Unemployment Rate Change since January 2013: -1.1
Civilian Labor Force: 425,600
Civilian Labor Force Change since April 2012: +200
Civilian Labor Force Change since January 2013: -800
Employment: 401,400
Employment Change since April 2012: +2,800
Employment Change since January 2013: +4,100
Unemployment: 24,200
Unemployment Change since April 2012: -2,500
Unemployment Change since January 2013: -4,900
Franklin County
Unemployment Rate: 5.7%
Unemployment Rate Change since April 2012: -0.5
Unemployment Rate Change since January 2013: -1.1
Civilian Labor Force: 622,300
Civilian Labor Force Change since April 2012: +600
Civilian Labor Force Change since January 2013: -1,400
Employment: 587,100
Employment Change since April 2012: +4,100
Employment Change since January 2013: +6,100
Unemployment: 35,200
Unemployment Change since April 2012: -3,400
Unemployment Change since January 2013: -7,400
Columbus Metro Area
Unemployment Rate: 5.7%
Unemployment Rate Change since April 2012: -0.4
Unemployment Rate Change since January 2013: -1.3
Civilian Labor Force: 964,400
Civilian Labor Force Change since April 2012: +1,700
Civilian Labor Force Change since January 2013: -3,500
Employment: 909,800
Employment Change since April 2012: +6,300
Employment Change since January 2013: +9,300
Unemployment: 54,600
Unemployment Change since April 2012: -4,600
Unemployment Change since January 2013: -12,800
Ohio Overall
Unemployment Rate: 7.0%
Unemployment Rate Change since April 2012: -0.3
Unemployment Rate Change since January 2013 : +0.0
Civilian Labor Force: 5,741,116
Civilian Labor Force Change since April 2012: -22,664
Civilian Labor Force Change since January 2013: +824
Employment: 5,341,401
Employment Change since April 2012: -1,270
Employment Change since January 2013: +549
Unemployment: 399,715
Unemployment Change since April 2012: -21,394
loyment Change since January 2013: +275
Non-Farm Jobs
Total: 954,100
Change from April 2012: +7,000
Change from January 2013: +9,500
By Industry
Mining/Logging/Construction Total: 28,400
Change from April 2012: -500
Change from January 2013: +1,500
Manufacturing Total: 66,500
Change from April 2012: +700
Change from January 2013: +1,500
Trade/Transportation/Utilities Total: 179,600
Change from April 2012: -900
Change from January 2013: -3,600
Information Total: 16,400
Change from April 2012: -300
Change from January 2013: -100
Financial Activities Total: 71,400
Change from April 2012: +300
Change from January 2013: -300
Professional and Business Services Total: 158,300
Change from April 2012: +1,000
Change from January 2013: +2,700
Education and Health Services Total: 141,000
Change from April 2012: +3,000
Change from January 2013: +1,500
Leisure and Hospitality Total: 95,200
Change from April 2012: +3,800
Change from January 2013: +6,700
Other Services Total: 36,100
Change from April 2012: -100
Change from January 2013: -100
Government Total: 161,200
Change from April 2012: +0
Change from January 2013: +700
Columbus has been mentioned a few times over the years as a growing tech job market. Forbes named it the #1 Up and Coming Tech City in 2008, for example, although Forbes seems to randomly choose cities for its exhausting number of rankings each year, so that can be taken with a grain of salt. So is Columbus as a tech city really a thing? The latest ranking suggests it might be.
The actual tech growth numbers aren’t subjective. Out of the 51 largest metros, here is how Columbus ranked the last decade or so in STEM jobs (Science, Technology, Engineering and Mathematics).
2001-2012 % Growth in Total STEM Jobs: +10.4% Rank of 51: 13th
2005-2012 % Growth in Total STEM Jobs: +12.8% Rank of 51: 9th
2010-2012 % Growth in Total STEM Jobs: +4.7% Rank of 51: 16th
2012 Location Quotient*: 1.27 LQ Rank of 51: 14th
2001-2012 Location Quotient Change: +7.6% Change Rank of 51: 5th
*Location Quotient is the local share of STEM jobs divided by the national share of STEM jobs. Anything above 1.0 indicates that the local share is higher than the national average.
So Columbus is clearly doing well and is handily beating out many much larger cities. It is one of only two Midwestern cities in the top 15 (Indianapolis is #15), and its rate of growth in concentration of STEM jobs is in the top 5 nationally. As the article discusses, traditional tech centers are actually losing STEM jobs while other areas, like Columbus, are gradually becoming bigger players. A well-educated workforce is paramount, and one of Columbus’ greatest strengths is its abundance of colleges and universities and young population. There are over 100,000 students in the area, and this ensures a strong workforce available for tech jobs. An example of how this attracts new STEM jobs was the recently announced plan by IBM to open its worldwide HQ for Advanced Analytics in Dublin along with 500 new jobs. The article with more details on this project can be found here.