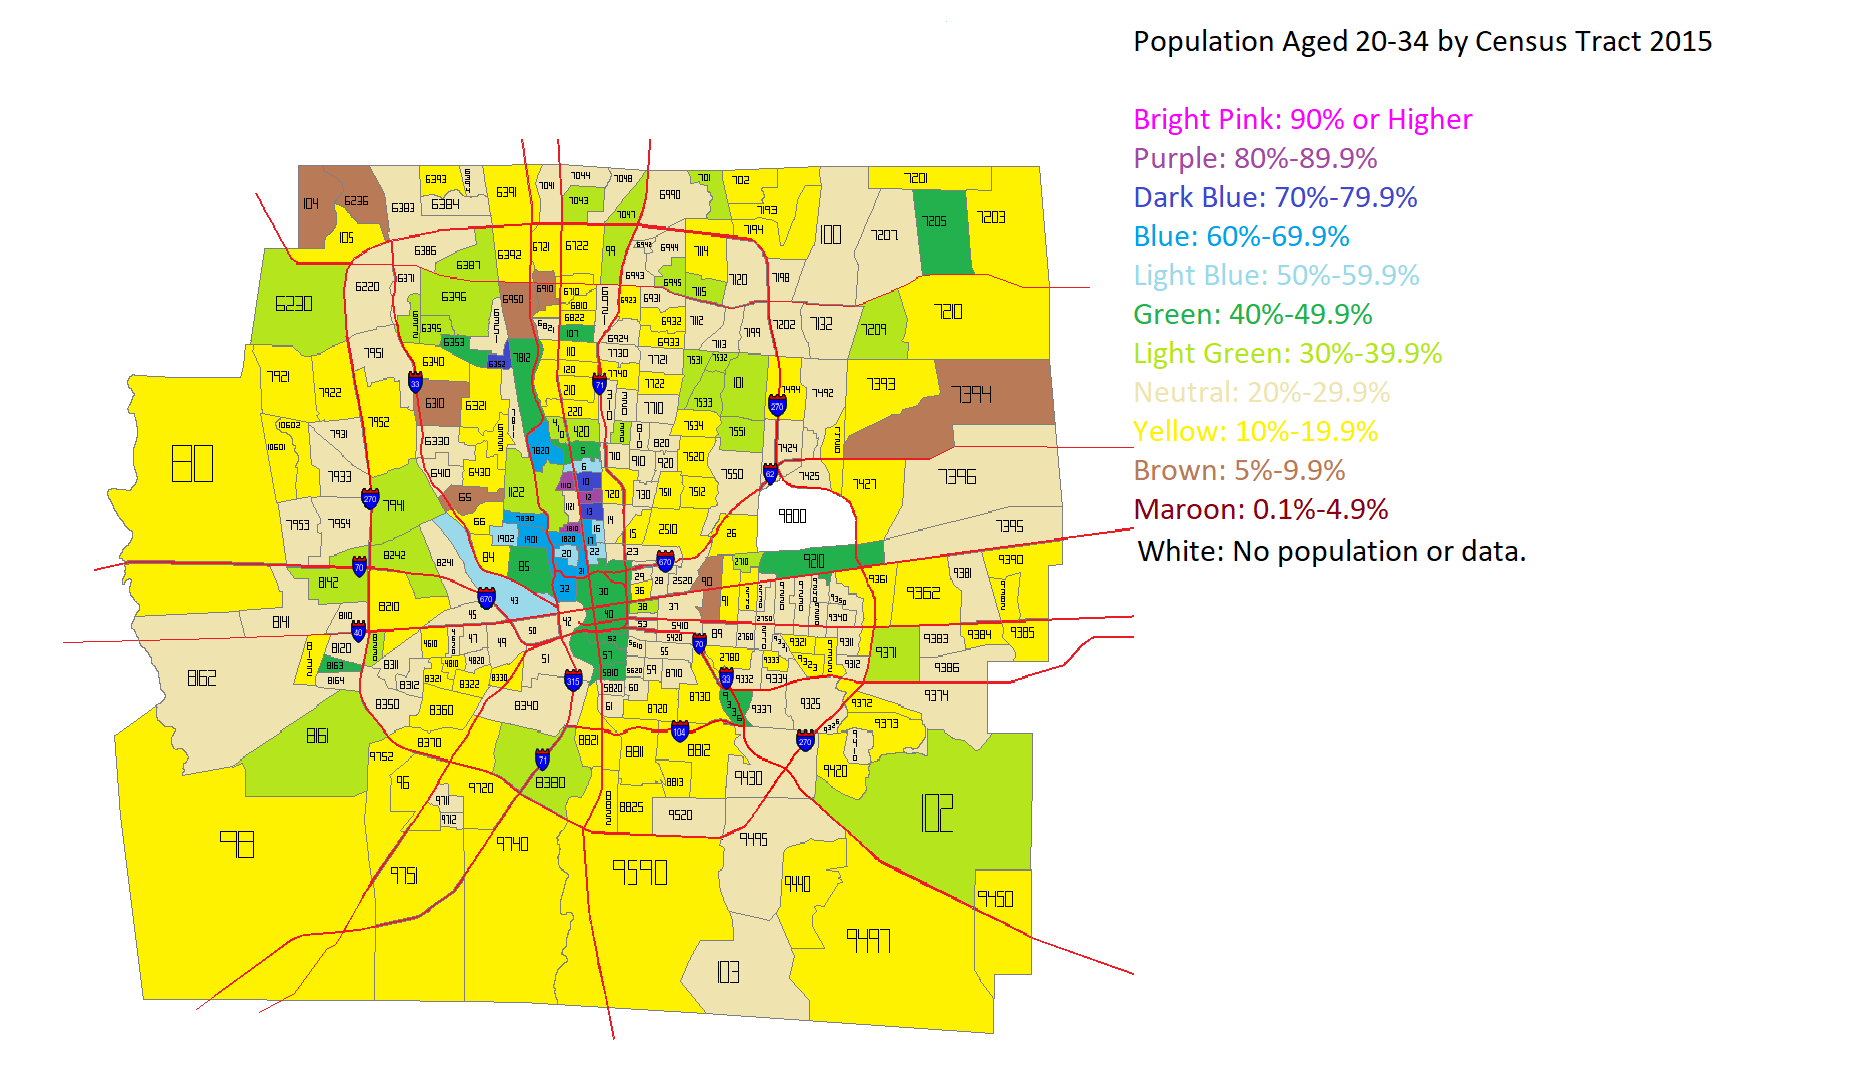
I’ve seen several articles across the internet lately questioning the idea that Millennials and young adults prefer density and urban areas. I decided to see how this played out in Franklin County overall. I first looked at the total population aged 20-34 in the year 2000 and the year 2015 by Census Tract. Here were the maps for those years.
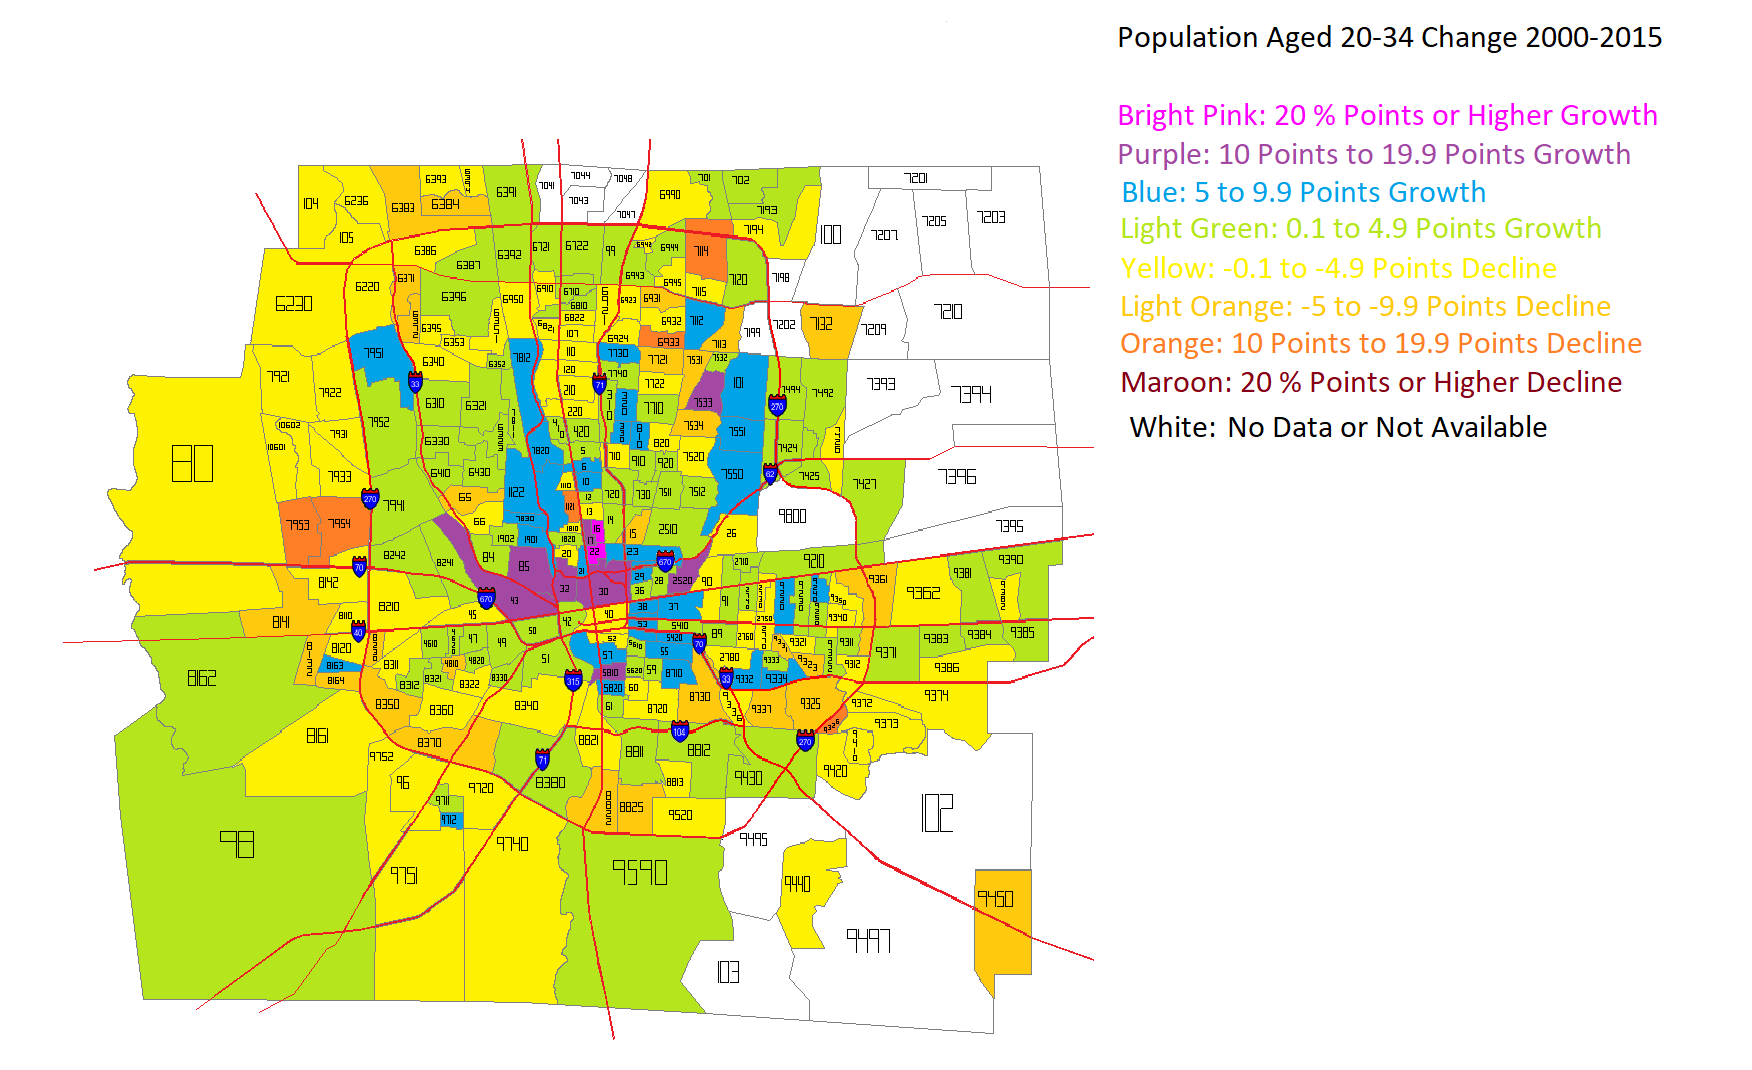
After looking at the numbers for both years, I came up with this map for how that age group had changed in the 2000-2015 period.
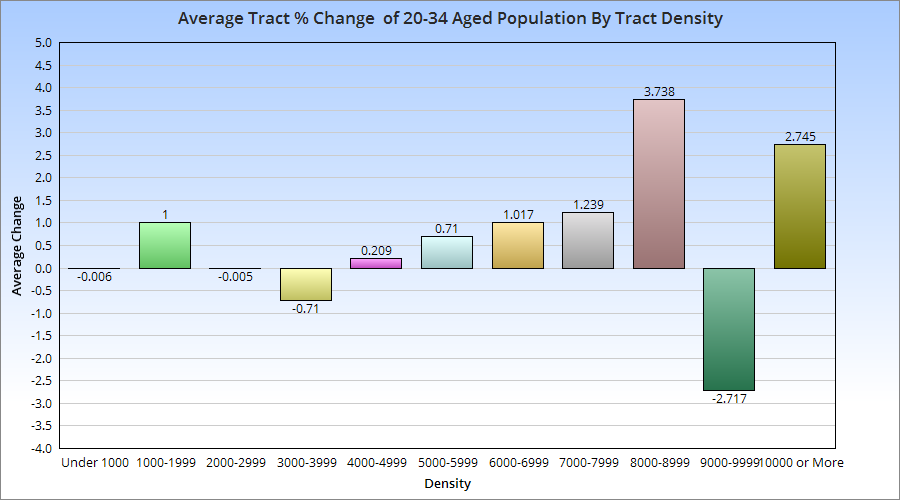
Unfortunately, some tracts, particularly in the eastern suburban areas, did not exist in 2000, and so I was not able to figure out the change for them during the period. The rest of the map, however, shows that the strongest growth in this age group was not only inside 270, but closest to Downtown and central corridors along Broad and High Streets. These maps don’t tell us about the relationship between those changes and the population density of the census tracts. So I went further and broke the tracts into increments of density to see where the strongest growth was occurring.
With a few exceptions, there appears to be a correlation between average 20-34 aged population growth and the density of the census tracts it occurs in. This suggests that this age group, at least in Franklin County, prefers areas with moderate to high density, which typically translates to urban living.
I saw this postthe other day about changing neighborhood demographics in certain cities, particularly when it comes to racial segregation and gentrification. Surprisingly, of all the maps and posts I’ve done on demographics, I hadn’t thought to do one that showed Franklin County gentrification trends. Well, now I have.
A bit of an explanation is needed for the color coding: -For those categories marked “Steady”, the demographic listed has been the majority throughout the period, with little to no change of other demographics. -For those mixed categories of one decline and one rise, it means that the majority demographic has declined at least 5 percentage points, while a secondary demographic has risen at least 5 percentage points. -For the category of recent or steady integration, there are at least 2 demographics at 10% or more of the total population, as well as a 3rd demographic reaching at least 5% of the population.
A few things that stand out to me: The eastern half of the county is in much greater flux than the western half, and integration is respectable county-wide. These neighborhoods of demographic equilibrium are largely the result of increasing Hispanic and Asian populations, particularly on the Northeast and West Sides, as well as the Whitehall area. In the center core, almost all of the High Street corridor has remained Steady White, suggesting that other demographics have, so far, been unable to tap into the building boom along and adjacent to this corridor. One other thing I notice is that there are FAR more tracts with a growing black population than there are with a growing White population, suggesting that perhaps the idea of Whites moving into neighborhoods and displacing residents is not quite as big of an issue as some might believe.
Here are the integrated tracts by year, based the above criteria, and their racial breakdown.
Breakdown of # of Tracts by % of Hispanic Population 1990 95% or Higher: 0 90%-94.9%: 0 80%-89.9%: 0 70%-79.9%: 0 60%-69.9%: 0 50%-59.9%: 0 Total Majority Hispanic Tracts: 0 40%-49.9%: 0 30%-39.9%: 0 20%-29.9%: 0 10%-19.9%: 0 0.1%-9.9%: 278 0%: 5 2015 95% or Higher: 0 90%-94.9%: 0 80%-89.9%: 0 70%-79.9%: 0 60%-69.9%: 0 50%-59.9%: 0 Total Majority Hispanic Tracts: 0 40%-49.9%: 0 30%-39.9%: 1 20%-29.9%: 7 10%-19.9%: 33 0.1%-9.9%: 241 0%: 9
Integrated Tracts By Year 1990: 2 2015: 98
Most Integrated Tract by Year 1990 1122: White: 76.6% Black: 9.6% Asian: 11.2% Hispanic: 2.5% 2015 7721: White: 33.9% Black: 31.2% Asian: 26.8% Hispanic: 10.1%
All in all, the data shows that the county is much less racially stratified/segregated now than it was in 1990, and that it doesn’t appear that gentrification is really affecting many areas in terms of forcing out one racial group for another.
In the 2nd post related to the recently-released Censusdemographic data, I’ll look at Columbus city diversity and how it’s been changing since 2005, as well as how it compares to other regional and national peers.
Rank by City of Total White, non-Hispanic Population by Year 2005————————————–2010————————————-2015 1. Chicago, IL: 819,215————1. Chicago: 853,910—————1. Chicago: 879,318 2. Indianapolis, IN: 491,044——2. Indianapolis: 482,195———–2. Columbus: 491,602 3. Columbus: 442,958————-3. Columbus: 470,971————-3. Indianapolis: 479,376 4. Portland, OR: 382,033———-4. Portland: 417,876—————4. Portland: 449,552 5. San Antonio, TX: 356,420—–5. Austin: 384,065——————5. Austin: 444,638 6. Austin, TX: 347,013————-6. San Antonio: 351,420———-6. Nashville: 365,542 7. Nashville, TN: 314,518——–7. Nashville: 339,030————–7. San Antonio: 364,707 8. Charlotte, NC: 302,789——-8. Charlotte: 331,357—————8. Charlotte: 356,507 9. Virginia Beach, VA: 290,891–9. Virginia Beach: 282,812——9. Omaha: 293,631 10. San Jose, CA: 281,822—–10. Las Vegas: 280,604——-10. Virginia Beach: 281,686 11. Las Vegas, NV: 281,679—-11. Omaha: 277,606————–11. Las Vegas: 278,444 12. Omaha, NE: 267,685——–12. San Jose: 265,311————12. San Jose: 268,948 13. Kansas City, MO: 249,123—13. Kansas City: 247,473——13. Kansas City: 261,360 14. Milwaukee, WI: 219,891——14. Minneapolis: 242,848——14. Minneapolis: 243,709 15. Minneapolis, MN: 216,975—-15. Milwaukee: 221,514——-15. Milwaukee: 216,755 16. Toledo: 183,746—————–16. Pittsburgh: 203,622——–16. Pittsburgh: 192,187 17. Pittsburgh, PA: 180,725——-17. Toledo: 177,341————17. Toledo: 164,305 18. Sacramento, CA: 160,599—-18. Sacramento: 165,610—–18. Sacramento: 155,784 19. Cleveland: 147,359————19. Cincinnati: 143,120——–19. Cincinnati: 147,360 20. St. Louis, MO: 143,590——–20. Cleveland: 137,977——–20. St. Louis: 138,178 21. Cincinnati: 138,486————-21. St. Louis: 134,146———-21. Cleveland: 133,998 22. Akron: 128,976——————22. Akron: 120,800————22. Grand Rapids: 119,128 23. Grand Rapids, MI: 113,791—23. Grand Rapids: 104,636—-23. Akron: 117,587 24. Orlando, FL: 92,326————24. Orlando: 96,867————24. Orlando: 102,822 25. Detroit, MI: 77,163————–25. Dayton: 72,663————-25. Dayton: 75,539 26. Dayton: 67,581——————26. Providence: 64,284——-26. Detroit: 64,511 27. Providence, RI: 64,223——–27. Detroit: 55,298————-27. Providence: 61,492
Columbus moved from 3rd to 2nd over the 10-year period for total White, non-Hispanic population.
Rank by City of Total Black, non-Hispanic Population by Year 2005—————————————–2010———————————2015 1. Chicago: 938,097—————–1. Chicago: 895,294———–1. Chicago: 834,048 2. Detroit: 683,999——————–2. Detroit: 587,707————-2. Detroit: 536,527 3. Milwaukee: 222,040————–3. Charlotte: 251,274———-3. Charlotte: 282,456 4. Cleveland: 221,797—————4. Milwaukee: 230,473——–4. Indianapolis: 234,338 5. Charlotte: 205,216—————-5. Indianapolis: 226,314——-5. Columbus: 233,320 6. Indianapolis: 193,948————6. Columbus: 216,486———6. Milwaukee: 231,304 7. Columbus: 179,197—————7. Cleveland: 208,528———7. Cleveland: 194,350 8. St. Louis: 168,768—————-8. Nashville: 171,104———–8. Nashville: 178,293 9. Nashville: 148,051—————-9. St. Louis: 157,382———–9. St. Louis: 146,925 10. Kansas City: 131,694———-10. Kansas City: 138,461—–10. Kansas City: 140,515 11. Cincinnati: 131,010————-11. Cincinnati: 131,909——–11. Cincinnati: 125,621 12. Pittsburgh: 81,758————–12. Virginia Beach: 79,583—-12. San Antonio: 98,876 13. Virginia Beach: 80,004——–13. San Antonio: 79,307——13. Virginia Beach: 85,867 14. Orlando: 73,736—————–14. Toledo: 75,033————-14. Minneapolis: 78,861 15. Toledo: 72,190——————-15. Pittsburgh: 71,539——–15. Toledo: 76,173 16. Sacramento: 71,452————16. Orlando: 70,988————16. Pittsburgh: 73,012 17. San Antonio: 70,723————17. Minneapolis: 63,749——17. Las Vegas: 68,777 18. Dayton: 60,196——————-18. Sacramento: 61,976——18. Austin: 68,061 19. Akron: 59,810——————–19. Austin: 61,833————–19. Sacramento: 63,477 20. Las Vegas: 59,780————–20. Dayton: 61,402————-20. Orlando: 61,955 21. Austin: 59,583——————-21. Akron: 60,653—————-21. Akron: 58,716 22. Minneapolis: 57,499————22. Las Vegas: 60,187———22. Omaha: 57,546 23. Omaha: 50,333——————23. Omaha: 55,086————-23. Dayton: 51,896 24. Grand Rapids: 40,408———24. Grand Rapids: 41,848—–24. Portland: 35,362 25. Portland: 30,828—————25. Portland: 37,355————-25. Grand Rapids: 32,423 26. San Jose: 27,446————–26. San Jose: 29,831———–26. San Jose: 30,068 27. Providence: 18,794————27. Providence: 19,265——–27. Providence: 21,484
Columbus moved up from 7th to 5th in total Black, non-Hispanic during the period.
Rank by City of Total Asian, non-Hispanic Population by Year 2005————————————-2010——————————————2015 1. San Jose: 269,186————–1. San Jose: 303,227—————–1. San Jose: 355,777 2. Chicago: 127,686—————-2. Chicago: 148,280——————2. Chicago: 166,771 3. Sacramento: 80,307————3. Sacramento: 84,556————-3. Sacramento: 88,422 4. Portland: 36,278—————–4. Austin: 46,575———————-4. Austin: 69,696 5. Austin: 35,239——————–5. Portland: 43,185——————-5. Charlotte: 50,142 6. Columbus: 27,125—————6. Las Vegas: 37,406—————-6. Portland: 49,811 7. Las Vegas: 25,077————–7. Charlotte: 37,181——————7. Columbus: 42,933 8. Charlotte: 23,356—————-8. Columbus: 35,468—————-8. San Antonio: 41,988 9. Virginia Beach: 22,501———9. San Antonio: 29,200————-9. Las Vegas: 41,782 10. San Antonio: 20,492———10. Virginia Beach: 27,303—–10. Virginia Beach: 28,358 11. Minneapolis: 20,189———-11. Milwaukee: 22,670————11. Minneapolis: 26,958 12. Milwaukee: 19,596————12. Minneapolis: 21,426———–12. Indianapolis: 25,264 13. Nashville: 16,943—————13. Indianapolis: 17,137———-13. Milwaukee: 22,497 14. Indianapolis: 12,312———–14. Nashville: 17,045————–14. Nashville: 20,577 15. Providence: 10,751————15. Pittsburgh: 12,036————-15. Pittsburgh: 18,067 16. Pittsburgh: 10,727————–16. Providence: 11,497———–16. Omaha: 15,243 17. Kansas City: 10,674———-17. Kansas City: 10,263———–17. Kansas City: 13,552 18. Detroit: 9,577——————-18. St. Louis: 8,717—————–18. Providence: 10,842 19. St. Louis: 7,046—————–19. Omaha: 8,397——————19. St. Louis: 8,920 20. Omaha: 6,971——————20. Orlando: 7,870——————20. Detroit: 8,790 21. Cincinnati: 6,874—————21. Detroit: 6,549——————–21. Akron: 8,006 22. Cleveland: 6,289————–22. Cincinnati: 5,938—————–22. Orlando: 7,949 23. Orlando: 5,528—————–23. Cleveland: 5,392—————–23. Cleveland: 7,874 24. Toledo: 4,150——————-24. Akron: 4,567———————-24. Cincinnati: 6,259 25. Akron: 3,497——————–25. Grand Rapids: 3,695———–25. Toledo: 5,008 26. Grand Rapids: 2,847———26. Toledo: 3,125——————-26. Grand Rapids: 4,451 27. Dayton: 1,827——————27. Dayton: 1,231——————-27. Dayton: 1,548
Columbus fell from 6th to 7th in Asian, non-Hispanic population.
Rank by City of Total Hispanic Population by Year 2005——————————————–2010————————————2015 1. Chicago: 778,234—————1. San Antonio: 853,654———-1. San Antonio: 937,607 2. San Antonio: 735,458———–2. Chicago: 763,968—————2. Chicago: 787,725 3. San Jose: 279,420————–3. San Jose: 318,389————–3. San Jose: 331,232 4. Austin: 223,361——————4. Austin: 288,130——————4. Austin: 327,680 5. Las Vegas: 153,813————5. Las Vegas: 181,923————-5. Las Vegas: 204,913 6. Sacramento: 111,559———6. Sacramento: 124,461———–6. Sacramento: 150,153 7. Milwaukee: 80,945————-7. Milwaukee: 104,619————-7. Charlotte: 113,731 8. Providence: 60,008————-8. Charlotte: 96,246—————-8. Milwaukee: 110,335 9. Charlotte: 58,466—————9. Indianapolis: 78,467————-9. Orlando: 89,306 10. Indianapolis: 47,764———10. Providence: 76,645————10. Indianapolis: 83,426 11. Detroit: 46,993—————–11. Nashville: 61,212————–11. Providence: 77,968 12. Orlando: 43,978—————12. Portland: 58,986—————12. Nashville: 67,526 13. Portland: 43,324—————13. Orlando: 56,061—————13. Omaha: 63,516 14. Omaha: 39,674—————–14. Omaha: 53,661—————14. Portland: 61,064 15. Nashville: 37,463—————15. Kansas City: 49,800———15. Detroit: 53,980 16. Minneapolis: 37,017———–16. Detroit: 45,580—————-16. Columbus: 46,855 17. Kansas City: 35,995———–17. Columbus: 43,276————17. Kansas City: 46,037 18. Grand Rapids: 32,368———18. Cleveland: 36,067———-18. Cleveland: 40,603 19. Cleveland: 32,085————–19. Minneapolis: 34,504——-19. Minneapolis: 39,981 20. Columbus: 24,607———–20. Grand Rapids: 30,659——20. Virginia Beach: 36,309 21. Virginia Beach: 20,803——–21. Virginia Beach: 29,206—-21. Grand Rapids: 31,282 22. Toledo: 18,404——————22. Toledo: 21,346————–22. Toledo: 23,614 23. St. Louis: 8,268—————–23. St. Louis: 11,207————-23. St. Louis: 12,261 24. Pittsburgh: 5,018—————24. Cincinnati: 8,710————-24. Pittsburgh: 9,266 25. Cincinnati: 3,855—————25. Pittsburgh: 7,282————-25. Cincinnati: 9,121 26. Akron: 3,485——————–26. Akron: 3,990——————-26. Dayton: 4,945 27. Dayton: 1,693——————-27. Dayton: 3,180—————–27. Akron: 3,684
Columbus moved up from 20th to 16th in the total Hispanic population.
Rank by City of Total Other, non-Hispanic Population by Year 2005——————————————-2010———————————————–2015 1. Chicago: 38,694—————1. Chicago: 37,379————————–1. Chicago: 54,694 2. San Jose: 29,456————2. San Jose: 32,439————————2. San Jose: 40,894 3. Sacramento: 21,370———-3. Sacramento: 30,900——————-3. Portland: 36,398 4. Portland: 21,164————–4. Portland: 28,027————————4. Columbus: 34,357 5. Indianapolis: 20,242———-5. Las Vegas: 24,521—————–5. Sacramento: 32,909 6. Columbus: 20,096————-6. Columbus: 23,738——————6. Las Vegas: 29,853 7. San Antonio: 19,130———-7. San Antonio: 20,778—————7. San Antonio: 26,646 8. Minneapolis: 18,580———-8. Minneapolis: 20,753—————-8. Indianapolis: 26,019 9. Detroit: 18,324—————–9. Virginia Beach: 20,268————-9. Charlotte: 24,285 10. Las Vegas: 18,304———-10. Indianapolis: 20,086————–10. Nashville: 22,658 11. Virginia Beach: 16,685—-11. Charlotte: 18,360——————11. Austin: 21,765 12. Milwaukee: 14,476———-12. Detroit: 16,776——————–12. Minneapolis: 21,426 13. Kansas City: 13,399——–13. Milwaukee: 16,311———–13. Virginia Beach: 20,525 14. Austin: 13,261—————-14. Omaha: 15,519—————-14. Milwaukee: 19,263 15. Charlotte: 11,771————-15. Austin: 14,915—————–15. Omaha: 13,951 16. Omaha: 8,552—————–16. Kansas City: 14,668———-16. Kansas City: 13,897 17. Toledo: 7,447——————17. Nashville: 14,227————-17. Detroit: 13,316 18. Cincinnati: 7,315————–18. Pittsburgh: 12,080————18. Pittsburgh: 11,853 19. Cleveland: 7,004————–19. Toledo: 10,134—————-19. Cleveland: 11,234 20. Providence: 6,488————-20. Akron: 9,020——————20. Toledo: 10,678 21. Pittsburgh: 6,138————–21. Cleveland: 8,276—————21. Cincinnati: 10,176 22. St. Louis: 6,058—————-22. St. Louis: 7,704—————22. Akron: 9,560 23. Orlando: 5,731—————–23. Grand Rapids: 7,376——-23. St. Louis: 9,401 24. Nashville: 5,687—————24. Orlando: 7,251————–24. Orlando: 8,885 25. Akron: 4,431——————–25. Cincinnati: 7,230———–25. Grand Rapids: 7,815 26. Grand Rapids: 4,154———26. Providence: 6,471———-26. Providence: 7,418 27. Dayton: 1,382——————27. Dayton: 3,025—————27. Dayton: 6,669
Finally, Columbus moved up from 6th to 4th in the total of Other, non-Hispanic population. Overall, Columbus ranks fairly well in totals vs. its peers, as one might expect given that it is one of the largest cities in the grouping. However, to truly find out how it compares with these other cities, you have to look at percentages, which tells how much of the city’s populationis made up of each group. Columbus had the 8th highest White, non-Hispanic % of total population of the city in 2015.
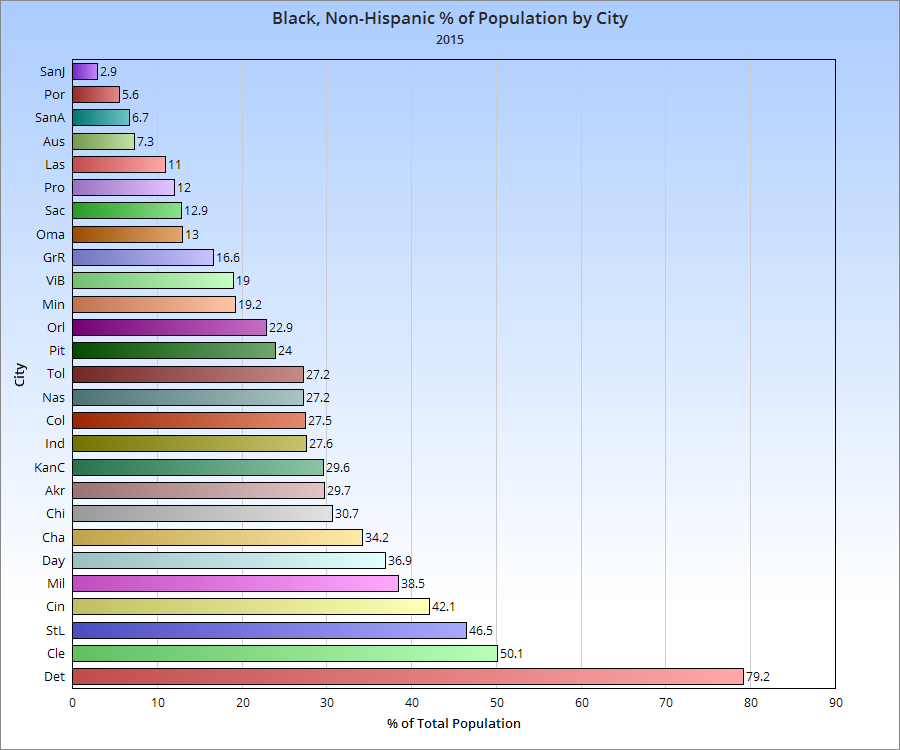
Columbus had the 12th highest Black, non-Hispanic % of total population.
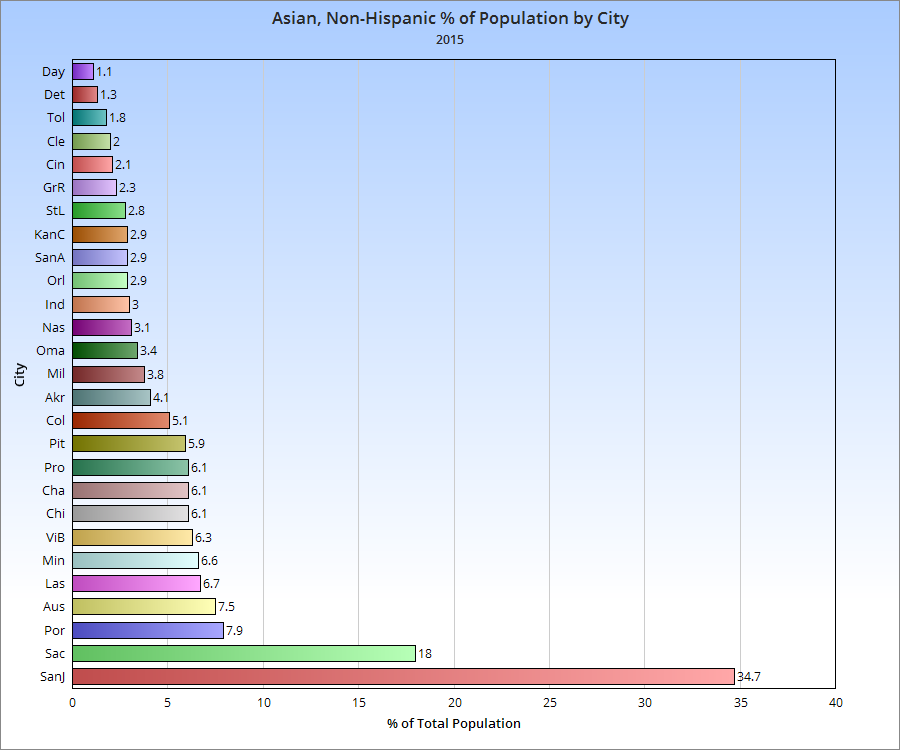
Columbus also had the 12th highest Asian, non-Hispanic % of total population.
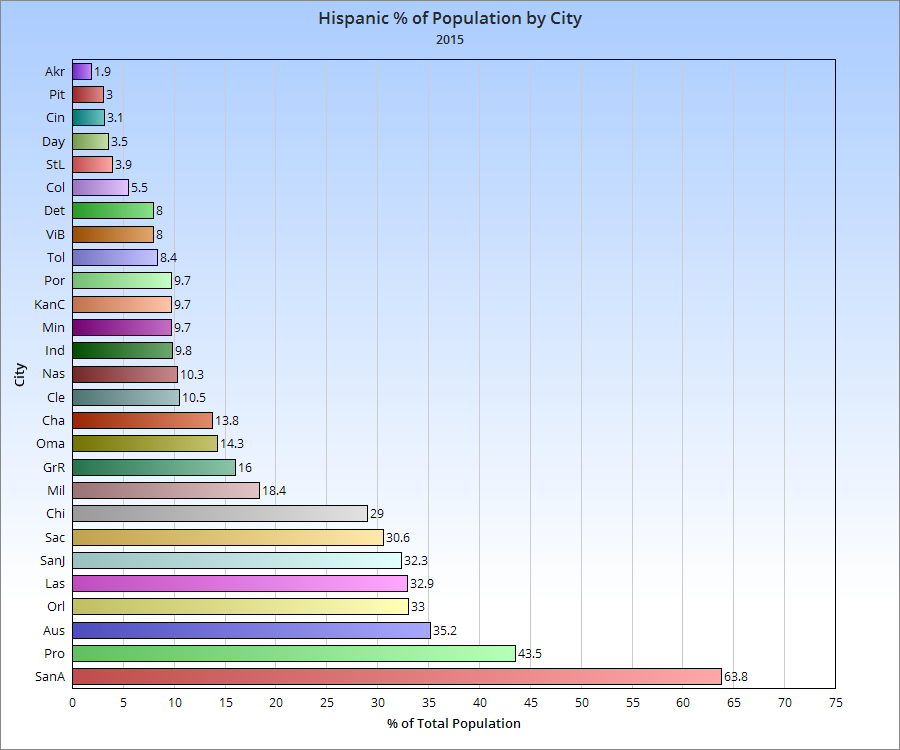
Columbus ranks poorly with Hispanics in the group, having only the 22nd highest % of population.
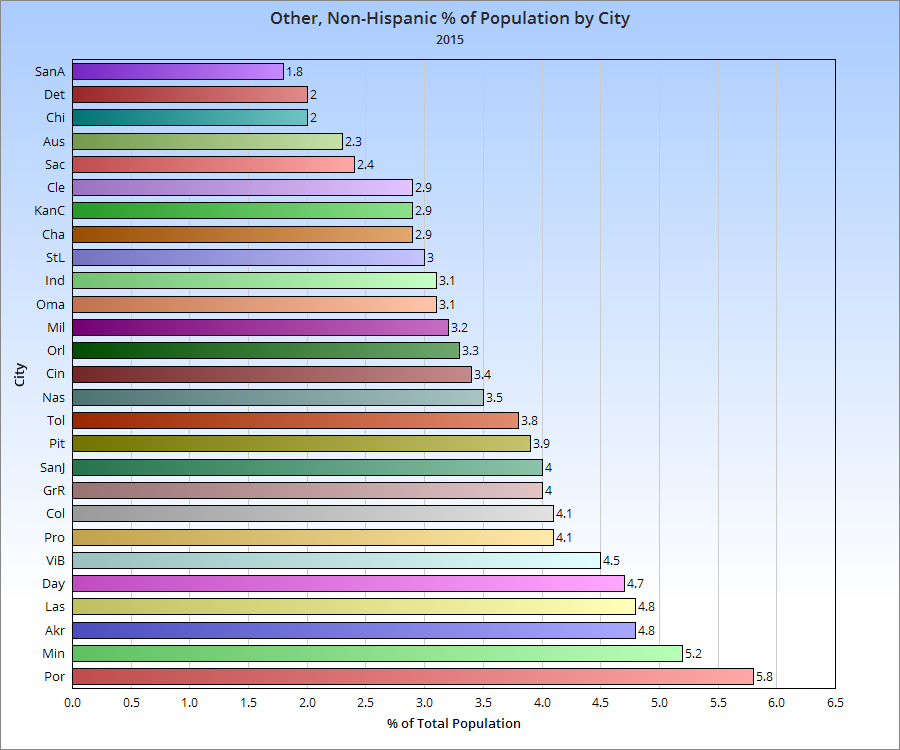
Finally, Columbus ranks 8th again in Other, non-Hispanic % of population.
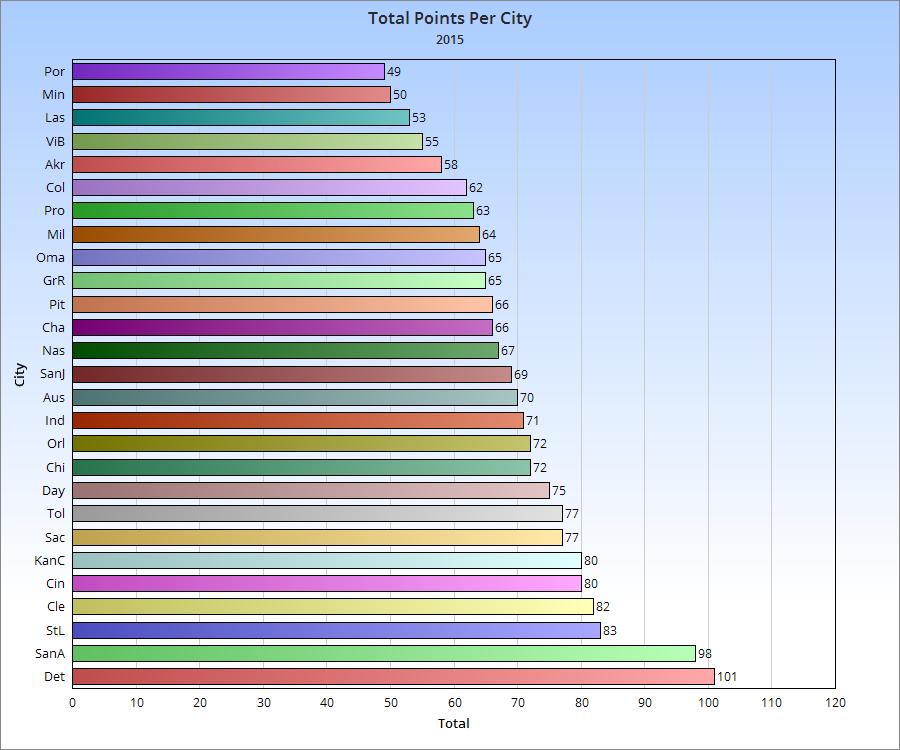
So what’s the final ranking for where Columbus is with diversity compared to its peers? To find out, I assigned points based on ranked position in each 5 racial categories. The final total determined where the cities ranked overall.
So based on this, Columbus is the 6th most racially diverse city of the 27 cities measured. This is no doubt surprising, but not so much when you get to the numbers.
*Note: Normally, Youngstown would be included, but the data was not available.
The Census just came out with 2015 demographic numbers for all places with at least 65,000 people. Given that half the decade is over, it’s a good point to look at where Columbus stands relative to its national/Midwest peers in a foreign-born comparison. A few days ago, I gave numbers for GDP. In the next few posts, I will look at the people that make up the populations of these places.
First up, let’s take a look at foreign-born populations. I have looked at this topic some in the past, but I have never done a full-scale comparison for this topic.
Total Foreign-Born Population Rank by City 2000, 2010 and 2015 2000—————————————-2010———————————-2015 1. Chicago, IL: 628,903———–1. Chicago: 557,674—————1. Chicago: 573,463 2. San Jose, CA: 329,750——–2. San Jose: 366,194————-2. San Jose: 401,493 3. San Antonio, TX: 133,675—-3. San Antonio: 192,741———-3. San Antonio: 208,046 4. Austin, TX: 109,006————4. Austin: 148,431——————4. Austin: 181,686 5. Las Vegas, NV: 90,656——-5. Las Vegas: 130,503————-5. Charlotte: 128,897 6. Sacramento, CA: 82,616—–6. Chalotte: 106,047—————6. Las Vegas: 127,609 7. Portland, OR: 68,976———7. Sacramento: 96,105————-7. Sacramento: 112,579 8. Charlotte, NC: 59,849——–8. Columbus: 86,663—————-8. Columbus: 101,129 9. Minneapolis, MN: 55,475—–9. Portland: 83,026—————–9. Nashville: 88,193 10. Columbus: 47,713———–10. Indianapolis: 74,407———–10. Portland: 86,041 11. Milwaukee, WI: 46,122—–11. Nashville: 73,327—————11. Indianapolis: 72,456 12. Detroit, MI: 45,541———–12. Minneapolis: 57,846———–12. Minneapolis: 70,769 13. Providence, RI: 43,947—–13. Milwaukee: 57,222————-13. Milwaukee: 58,321 14. Nashville, TN: 38,936——-14. Providence: 52,926————14. Providence: 53,532 15. Indianapolis, IN: 36,067—-15. Orlando: 43,747—————-15. Orlando: 50,558 16. Virginia Beach, VA: 28,276–16. Virginia Beach: 40,756—–16. Omaha: 48,263 17. Orlando, FL: 26,741———17. Omaha: 39,288—————–17. Detroit: 39,861 18. Omaha, NE: 25,687———18. Kansas City: 35,532———18. Virginia Beach: 38,360 19. Kansas City, MO: 25,632—19. Detroit: 34,307—————-19. Kansas City: 37,787 20. Cleveland: 21,372————20. St. Louis: 23,011————–20. Pittsburgh: 28,187 21. Grand Rapids, MI: 20,814–21. Pittsburgh: 18,698————21. St. Louis: 21,802 22. St Louis, MO: 19,542——-22. Cleveland: 17,739————-22. Grand Rapids: 19,176 23. Pittsburgh, PA: 18,874—–23. Grand Rapids: 16,615——–23. Cleveland: 18,830 24. Cincinnati: 12,461———–24. Cincinnati: 16,531————-24. Cincinnati: 16,896 25. Toledo: 9,475—————–25. Toledo: 11,559—————–25. Akron: 10,024 26. Akron: 6,911——————26. Akron: 8,524——————–26. Toledo: 9,257 27. Dayton: 3,245—————-27. Dayton: 5,102——————-27. Dayton: 7,381 28. Youngstown: 1,605———28. Youngstown: 3,695————28. Youngstown: 1,058
Here’s the 2000-2015 total change.
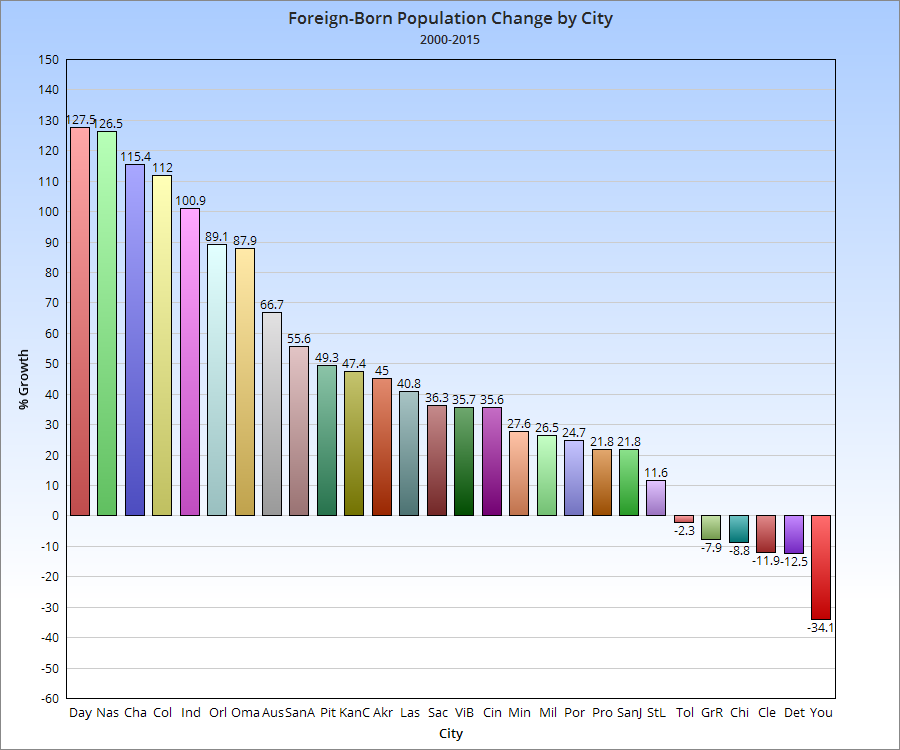
And the 2000-2015 change by %.
So Columbus has an above average total and growth compared to its peers nationally.
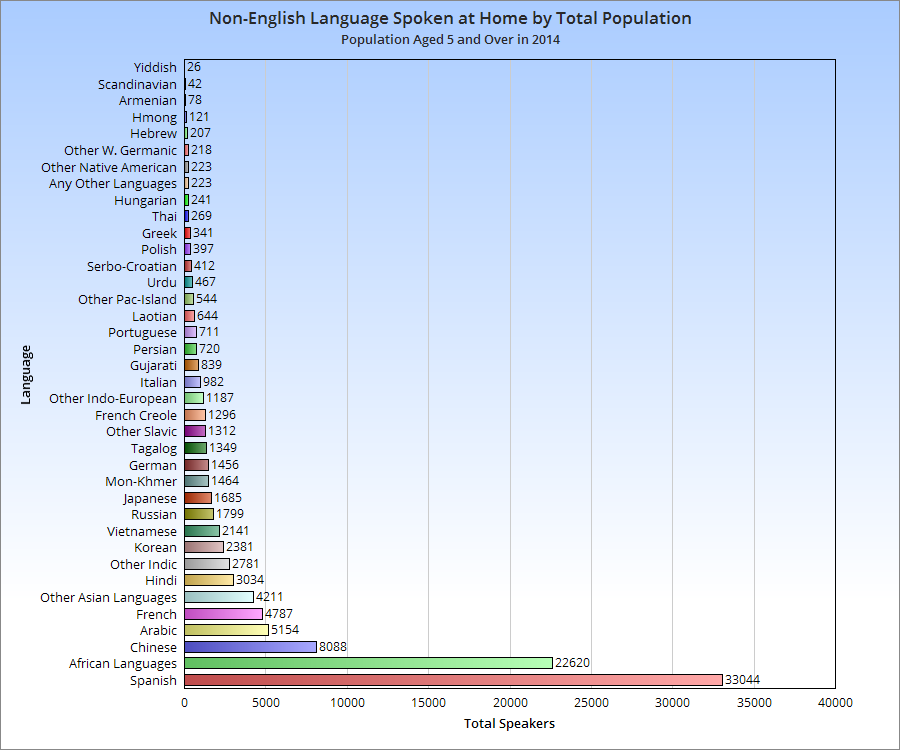
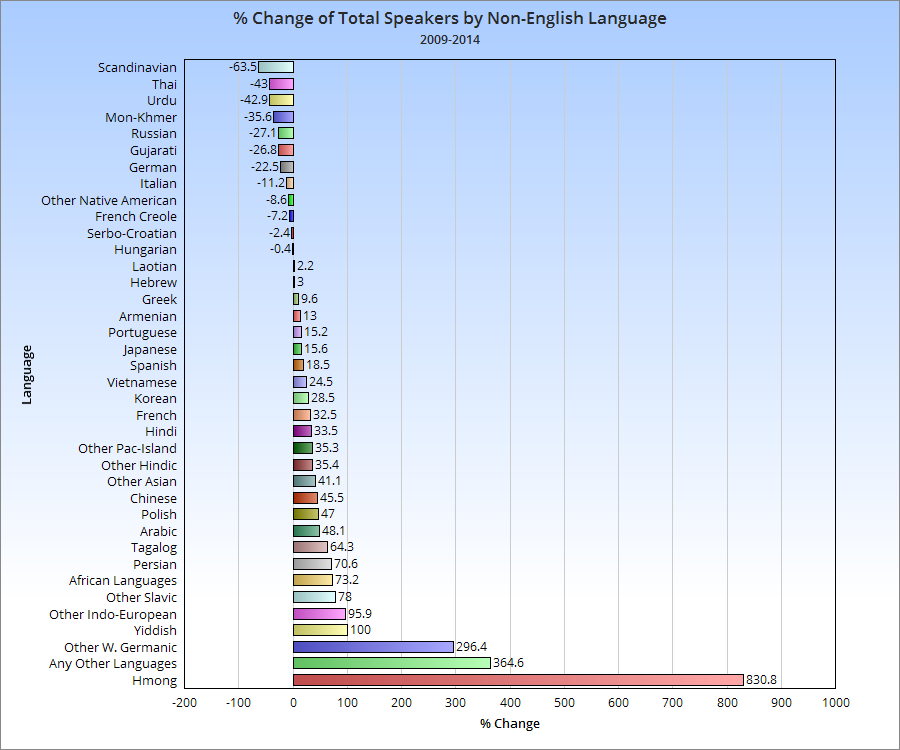
Just a quick little post about the non-English languages spoken in the city of Columbus and how they have changed between 2009 and 2014, by total number of speakers.
For the record, in 2014, 14.3% of the Columbus population spoke a language other than English at home, up from about 12% in 2009.