Ohio maintained its 7th-place position through 2014. Now let’s look at the 20 states that had the biggest increases.
Total GDP Growth in Millions 2013-2014 1. California: +98,625 2. Texas: +90,843 3. New York: +62,927 4. Florida: +39,247 5. Pennsylvania: +22,596 6. Illinois: +21,080 7. Ohio: +20,416 8. Georgia: +20,000 9. Washington: +19,892 10. Massachusetts: +18,470 11. Colorado: +18,325 12. Michigan: +16,842 13. North Carolina: +16,051 14. New Jersey: +11,703 15. Oregon: +10,810 16. Tennessee: +10,479 17. Arizona: +9,422 18. Maryland: +9,222 19. Minnesota: +8,934 20. Virginia: +8,629
So Ohio is growing at the same position as its overall ranking. No states below it are set to pass it anytime in the near future. In fact, the gap is widening from its nearest threats.
What about per-capita GDP, which is a measure of the state’s total GDP divided by its population?
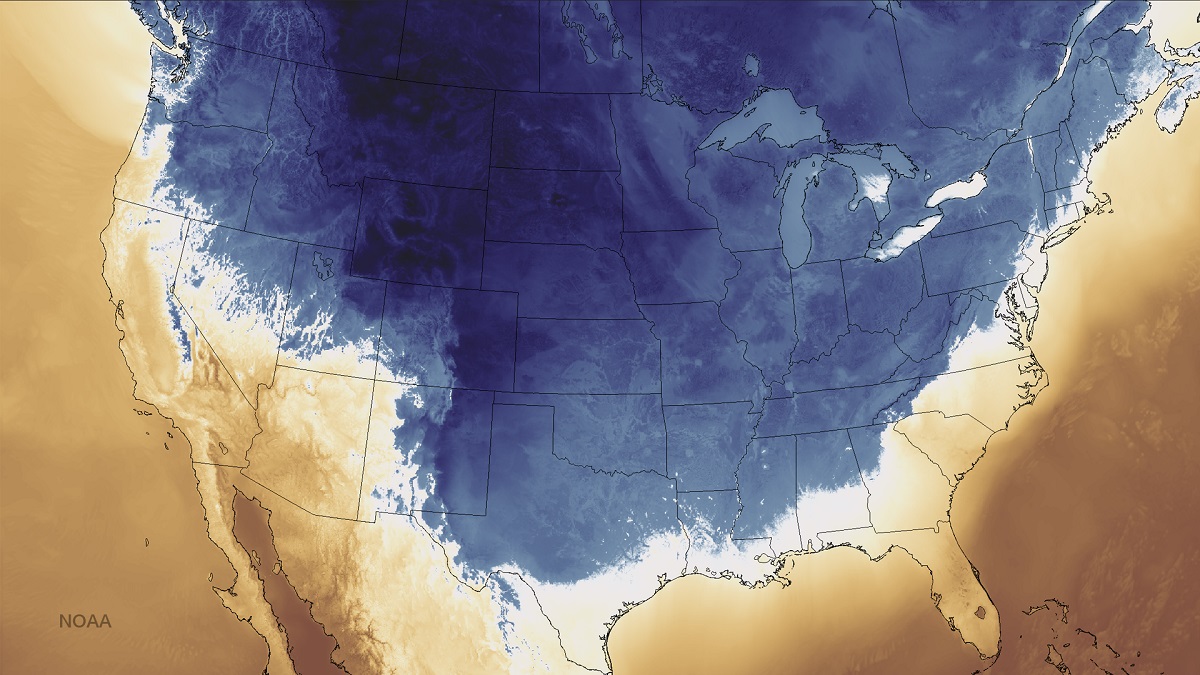
The mid-November 2014 cold wave that kickstarted a historic winter.
The Winter 2014-2015 Review details the historic season, with its bouts of extreme cold and heavy snowfall occurring in all months except December.
Temperature and snowfall ranking data goes back to the winter of 1878-1879. Snow depth ranking data goes back to 1940.
December-February Only Average High: 34.8 19th Coldest Average Low: 19.3 14th Coldest Mean: 27.1 15th Coldest Precipitation: 7.27″ 57th Driest Snowfall: 23.9″ 33rd Snowiest Average Daily Snow Depth: 0.9″ 15th Highest Largest Snowstorm: 6.8″ on February 21st 32 or Below Highs: 36 14th Most 32 or Below Lows: 76 13th Most Measurable Precipitation Days: 36 12th Fewest Measurable Snowfall Days: 15 11th Fewest Deepest Snow Depth: 6″ on February 21st Days with 1″+ Snow Depth: 30 16th Most
Entire Cold Season: October-April Average High: 46.6 14th Coldest Average Low: 29.4 14th Coldest Mean: 38.0 14th Coldest Precipitation: 19.51″ 67th Wettest Snowfall: 33.4″ 28th Snowiest Average Snow Depth: 0.6″ 7th Lowest Largest Snowstorm: 6.8″ on February 21st 32 or Below Highs: 43 12th Most 32 or Below Lows: 116 17th Most Measurable Precipitation Days: 89 16th Most Measurable Snowfall Days: 22 13th Fewest Deepest Snow Depth: 6″ on February 21st Days with 1″+ Snow Depth: 45 8th Most
Average High By Month October 2014: 63.4 32nd Coldest November 2014: 45.7 9th Coldest December 2014: 42.1 33rd Warmest January 2015: 33.8 32nd Coldest February 2015: 28.6 5th Coldest March 2015: 47.6 37th Coldest April 2015: 63.5 34th Warmest
Average Low By Month October 2014: 45.4 37th Warmest November 2014: 30.0 6th Coldest December 2014: 29.9 19th Warmest January 2015: 18.1 33rd Coldest February 2015: 10.0 3rd Coldest March 2015: 28.1 22nd Coldest April 2015: 42.9 28th Warmest
Mean By Month October 2014: 54.4 35th Coldest November 2014: 37.9 7th Coldest December 2014: 36.0 27th Warmest January 2015: 26.0 31st Coldest February 2015: 19.3 2nd Coldest March 2015: 37.9 33rd Coldest April 2015: 53.2 28th Warmest
Precipitation By Month October 2014: 2.77″ 42nd Wettest November 2014: 1.46″ 22nd Driest December 2014: 2.70″ 63rd Driest January 2015: 2.87″ 51st Wettest February 2015: 1.70″ 45th Driest March 2015: 3.92″ 45th Wettest April 2015: 4.09″ 37th Wettest
Snowfall By Month October 2014: Trace 2nd Least Snowy November 2014: 4.1″ 15th Snowiest December 2014: Trace 2nd Least Snowy January 2015: 8.4″ 48th Snowiest February 2015: 15.5″ 8th Snowiest March 2015: 5.4″ 23rd Snowiest April 2015: 0.0″ 1st Least Snowy
Average Snow Depth By Month October 2014: 0″ November 2014: 0.4″ December 2014: 0″ January 2015: 0.8″ February 2015: 3.3″ March 2015: 1.1″ April 2015: 0″
Maximum High By Month October 2014: 86 on the 2nd November 2014: 69 on the 11th December 2014: 61 on the 1st January 2015: 59 on the 3rd February 2015: 56 on the 8th March 2015: 69 on the 16th April 2015: 79 on the 13th and 18th
Minimum High By Month October 2014: 49 on the 31st November 2014: 19 on the 18th December 2014: 26 on the 31st January 2015: 13 on the 7th February 2015: 8 on the 15th and 19th March 2015: 23 on the 5th and 6th April 2015: 50 on the 23rd
Minimum High Records -The 33 on November 14th was a record for the day, beating the old record of 34 set in 1900, 1908, 1911 and 1916. -The 19 on November 18th tied the record for the day set in 1904. -The 8 on February 15th was a record for the day, beating the old record of 12 set in 1920. -The 10 on February 16th was a record for the day, beating the old record of -The 8 on February 19th was a record for the date, beating the old record of 10 set in 1885. -The 18 on February 27th tied the record for the date set in 1888 and 1934. -The 25 on February 28th was a record for the date, beating the old record of 26 set in 1986.
Maximum Low By Month October 2014: 58 on the 13th and 14th November 2014: 47 on the 4th December 2014: 44 on the 23rd January 2015: 34 on the 18th and 21st February 2015: 41 on the 8th March 2015: 43 on the 16th April 2015: 57 on the 19th
Maximum Low Records -The 54 on November 30th was a record for the date, beating the old record of 53 set in 1998 and 2006.
Minimum Low By Month October 2014: 38 on the 4th, 26th and 31st November 2014: 12 on the 18th December 2014: 15 on the 15th January 2015: -6 on the 8th February 2015: -11 on the 24th March 2015: 4 on the 6th April 2015: 28 on the 24th
Minimum Low Records -The -11 on February 24th was a record for the date, beating the old record of -1 set in 1914. -The 0 on February 28th was a record for the date, beating the old record of 2 set in 1934. -The 28 on April 24th tied the record for the date set in 1930.
Highest Daily Precipitation By Month October 2014: 0.57″ on the 6th November 2014: 0.39″ on the 17th December 2014: 0.82″ on the 6th January 2015: 1.46″ on the 3rd February 2015: 0.55″ on the 1st March 2015: 0.63″ on the 14th April 2015: 0.66″ on the 2nd
Highest Daily Snowfall By Month October 2014: Trace on the 4th November 2014: 3.8″ on the 17th December 2014: Trace on the 10th, 17th, 18th, 19th, 20th and 31st January 2015: 3.7″ on the 6th February 2015: 6.8″ on the 21st March 2015: 3.6″ on the 1st April 2015: 0.0″
Snowfall Records -The 6.8″ on February 21st was a record for the day, beating the old record of 5.8″ set in 1893. -The 3.6″ on March 1st was a record for the date, beating the old record of 3.5″ set in 1954.
Deepest Snow Depth By Month October 2014: 0″ November 2014: 3″ on the 18th and 19th December 2014: 0″ January 2015: 3″ on the 6th, 7th and 9th February 2015: 6″ on the 21st March 2015: 6″ on the 1st and 2nd April 2015: 0″
In an occasional series, I will be attempting to answer questions or provide information based on popular searches on the site. In today’s addition, I will talk retail. I get a lot of searches for Columbus malls and shopping destinations. I had to think about the best way to tackle this, because Columbus has so much retail- it’s considered to be one of the best cities per-capita for shopping.
Here is just a straight list of some of the major centers with all information I could find, as well as a Google Map location.
Major Malls Eastland Mall Opened: 1968 (Renovation 2003) Address: 2740 Eastland Mall Site B, Columbus 43232 Phone: 614-861-3234 Hours: M-S: 10AM-9PM Sunday: 12PM-6PM # of Retail Stores: 74 # of Restaurants/Eateries/Grocery: 6 Mall Website: www.eastlandmall.com
Easton Town Center Opened: 1999 (Expansions in 2001, 2013, 2014 and 2019) Address: 160 Easton Town Center, Columbus 43219 Phone: 614-416-7000 Hours: M-T: 10AM-9PM F-S: 10AM-10PM Sunday: 12PM-6PM # of Retail Stores: 164 # of Restaurants/Eateries/Grocery: 56 Mall Website: www.eastontowncenter.com
The Mall at Tuttle Crossing Built: 1997 Address: 5043 Tuttle Crossing Blvd, Dublin 43016 Phone: 614-717-9604 Hours: M-S: 10AM-9PM Sunday: 11AM-6PM # of Retail Stores: 125+ # of Restaurants/Eateries/Grocery: 20+ Mall Website: www.simon.com/mall/the-mall-at-tuttle-crossing
Polaris Fashion Place Opened: 2001 (Expansions/Renovations in 2008 and 2015) Address: 1500 Polaris Parkway, Columbus 43240 Phone: 614-846-1500 Hours: M-T: 10AM-9PM F-S: 10AM-9:30PM Sunday: 12PM-6PM # of Retail Stores: 200 # of Restaurants/Eateries/Grocery: 20 Mall Website: www.polarisfashionplace.com
The Shops at Worthington Place Address: 7227 N. High Street, Worthington 43085 Phone: 614-841-1110 Hours: M-S: 10AM-8PM Sunday: 12PM-5PM # of Retail Stores: 25+ # of Restaurants/Eateries/Grocery: 8 Website: http://shopworthingtonplace.com/
Town & Country Shopping Center Address: 3772 E. Broad Street, Columbus 43213 Phone: N/A Hours: N/A # of Retail Stores: 55 Website: N/A
Total Births Census 2010 to July 1, 2014 Chicago, IL: 516,295 Detroit, MI: 212,571 Minneapolis, MN: 192,866 Charlotte, NC: 125,143 Kansas City, MO: 117,872 Portland, OR: 117,482 Cincinnati: 117,072 Sacramento, CA: 116,893 Orlando, FL: 114,387 Columbus: 113,392 Indianapolis, IN: 113,127 Las Vegas, NV: 111,857 Austin, TX: 107,591 San Jose, CA: 105,447 Pittsburgh, PA: 100,888 Cleveland: 98,504 Virginia Beach, VA: 96,734 Nashville, TN: 96,440 Milwaukee, WI: 84,990 Providence, RI: 70,850 Grand Rapids, MI: 57,551 Omaha, NE: 55,860 Dayton: 40,683 Wichita, KS: 40,276 Des Moines, IA: 36,423 Akron: 32,228 Toledo: 32,024 Madison, WI: 31,280 Youngstown: 23,686
Total Deaths Census 2010 to July 1, 2014 Chicago, IL: 289,440 Detroit, MI: 166,387 Pittsburgh, PA: 114,531 Minneapolis, MN: 90,773 Cleveland: 88,446 Cincinnati: 77,345 Charlotte, NC: 71,315 Kansas City, MO: 68,102 Sacramento, CA: 67,943 Portland, OR: 67,820 Orlando, FL: 65,979 Indianapolis, IN: 64,207 Columbus: 62,011 Providence, RI: 61,604 Las Vegas, NV: 60,256 Nashville, TN: 55,846 Virginia Beach, VA: 55,425 Milwaukee, WI: 55,123 San Jose, CA: 41,927 Austin, TX: 36,873 Dayton: 33,636 Grand Rapids, MI: 30,324 Youngstown: 29,196 Akron: 29,040 Omaha, NE: 26,829 Toledo: 24,226 Wichita, KS: 23,025 Des Moines, IA: 17,602 Madison, WI: 17,069
Total Natural Change Census 2010 to July 1, 2014 Chicago, IL: 226,855 Minneapolis, MN: 102,093 Austin, TX: 70,718 San Jose, CA: 63,520 Charlotte, NC: 53,828 Las Vegas, NV: 51,601 Columbus: 51,381 Kansas City, MO: 49,770 Portland, OR: 49,662 Sacramento, CA: 48,950 Indianapolis, IN: 48,920 Orlando, FL: 48,708 Detroit, MI: 46,184 Virginia Beach, VA: 41,309 Nashville, TN: 40,594 Cincinnati: 39,727 Milwaukee, WI: 29,867 Omaha, NE: 29,031 Grand Rapids, MI: 27,227 Des Moines, IA: 18,821 Wichita, KS: 17,251 Madison, WI: 14,211 Cleveland: 10,058 Providence, RI: 9,246 Toledo: 7,798 Dayton: 7,047 Akron: 3,188 Youngstown: -5,510 Pittsburgh, PA: -13,643
Total Domestic Migration Census 2010 to July 1, 2014 Austin, TX: 126,296 Charlotte, NC: 83,305 Orlando, FL: 72,735 Nashville, TN: 63,477 Portland, OR: 48,793 Las Vegas, NV: 35,289 Columbus: 20,083 Indianapolis, IN: 16,744 Des Moines, IA: 16,559 Sacramento, CA: 15,658 Madison, WI: 6,901 Grand Rapids, MI: 5,372 Pittsburgh, PA: 4,053 Omaha, NE: 2,869 Minneapolis, MN: -934 Kansas City, MO: -1,948 Akron: -6,490 Youngstown: -7,347 Dayton: -10,873 Wichita, KS: -11,148 Toledo: -13,337 San Jose, CA: -15,335 Cincinnati: -18,334 Providence, RI: -21,325 Milwaukee, WI: -22,597 Virginia Beach, VA: -24,374 Cleveland: -38,424 Detroit, MI: -89,649 Chicago, IL: -237,666
Total International Migration Census 2010 to July 1, 2014 Chicago, IL: 108,320 San Jose, CA: 69,894 Orlando, FL: 63,215 Minneapolis, MN: 46,328 Detroit, MI: 44,614 Las Vegas, NV: 29,440 Sacramento, CA: 29,435 Austin, TX: 25,762 Charlotte, NC: 23,114 Virginia Beach, VA: 23,092 Portland, OR: 22,042 Columbus: 21,574 Providence, RI: 21,170 Indianapolis, IN: 17,623 Nashville, TN: 16,204 Cleveland: 16,010 Kansas City, MO: 14,569 Cincinnati: 14,567 Pittsburgh, PA: 12,887 Milwaukee, WI: 9,968 Omaha, NE: 7,897 Madison, WI: 6,706 Grand Rapids, MI: 6,232 Dayton: 6,200 Des Moines, IA: 6,159 Akron: 4,599 Wichita, KS: 4,006 Toledo: 2,971 Youngstown: 1,088
Total Migration Census 2010 to July 1, 2014 Austin, TX: 152,058 Orlando, FL: 135,950 Charlotte, NC: 106,419 Nashville, TN: 79,681 Portland, OR: 70,835 Las Vegas, NV: 64,729 San Jose, CA: 54,559 Minneapolis, MN: 45,394 Sacramento, CA: 45,093 Columbus: 41,657 Indianapolis, IN: 34,367 Des Moines, IA: 22,718 Pittsburgh, PA: 16,940 Madison, WI: 13,607 Kansas City, MO: 12,621 Grand Rapids, MI: 11,604 Omaha, NE: 10,766 Providence, RI: -155 Virginia Beach, VA: -1,282 Akron: -1,891 Cincinnati: -3,767 Dayton: -4,673 Youngstown: -6,259 Wichita, KS: -7,142 Toledo: -10,366 Milwaukee, WI: -12,629 Cleveland: -22,414 Detroit, MI: -45,035 Chicago, IL: -129,346
Total Population Change Census 2010 to July 1, 2014 Austin, TX: 226,996 Orlando, FL: 187,012 Charlotte, NC: 163,066 Minneapolis, MN: 146,319 Portland, OR: 122,236 Nashville, TN: 121,749 Las Vegas, NV: 118,412 San Jose, CA: 115,931 Sacramento, CA: 95,254 Chicago, IL: 93,061 Columbus: 92,521 Indianapolis, IN: 83,192 Kansas City, MO: 61,795 Des Moines, IA: 41,916 Virginia Beach, VA: 39,807 Omaha, NE: 39,071 Grand Rapids, MI: 38,763 Cincinnati: 34,694 Madison, WI: 28,350 Milwaukee, WI: 16,291 Wichita, KS: 10,157 Providence, RI: 8,151 Dayton: 1,620 Akron: 618 Detroit, MI: 298 Pittsburgh, PA: -317 Toledo: -2,545 Youngstown: -12,541 Cleveland: -13,648
Out of the 31 peer and Midwest metros, Columbus had the 7th highest natural growth, the 10th highest migration rate and the 11th highest overall growth rate.
New 2014 county population estimates were released Thursday by the Census. Franklin County had its 2nd highest growth year since 1970 and within a few years of passing Cuyahoga County to become the most populated in Ohio.