I talked about housing permits before- almost a decade ago now- and thought it would be a good time to update and expand the information. The following graphs detail Columbus area housing permits as they pertain to new residential units being permitted for construction.
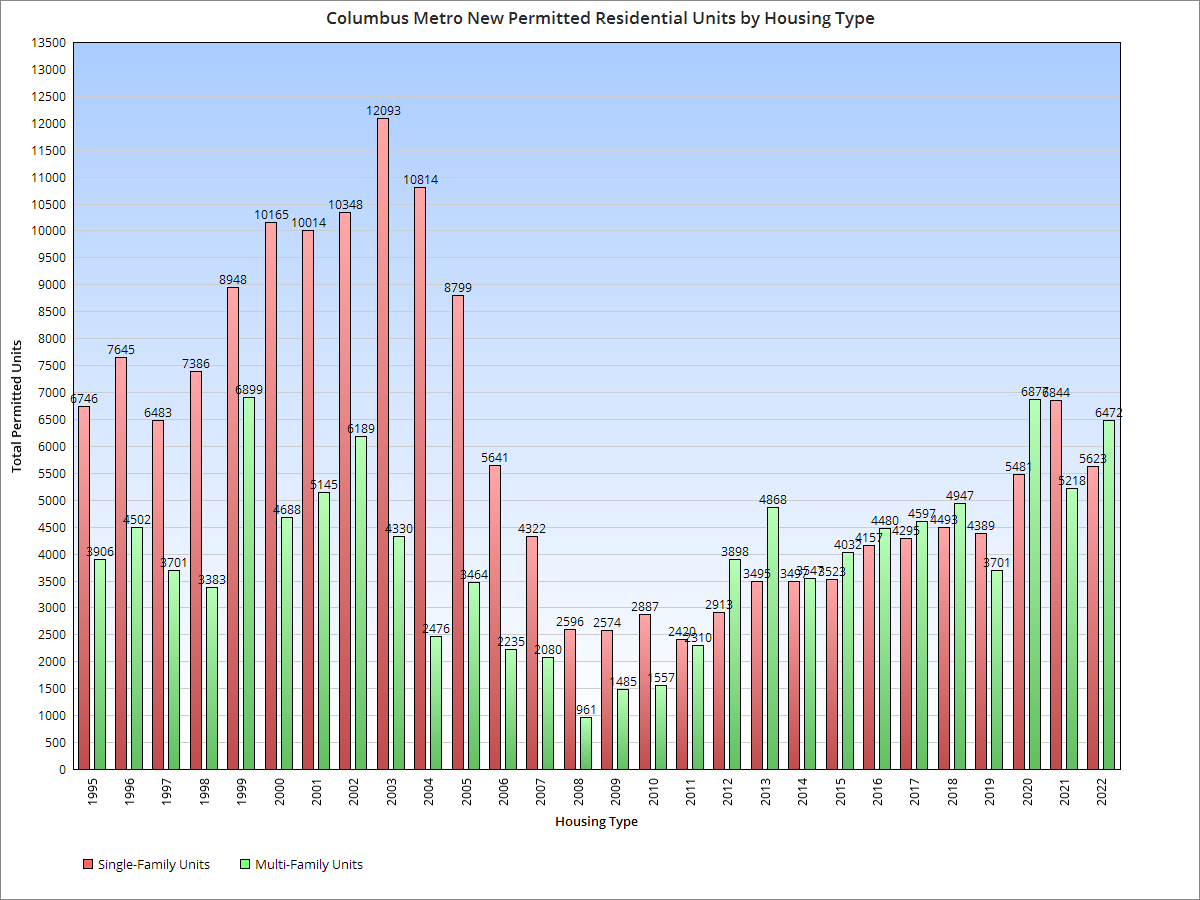
Up first, the below graph shows all permitted units by type for the entire metro area since 1995. What most stands out about the graph is how single-family construction dominated until the late 2000s. When the Great Recession hit, it completely changed that dynamic. Since then, multi-family units have mostly been on top in most years, perhaps because more money could be made with them with less financial risk.
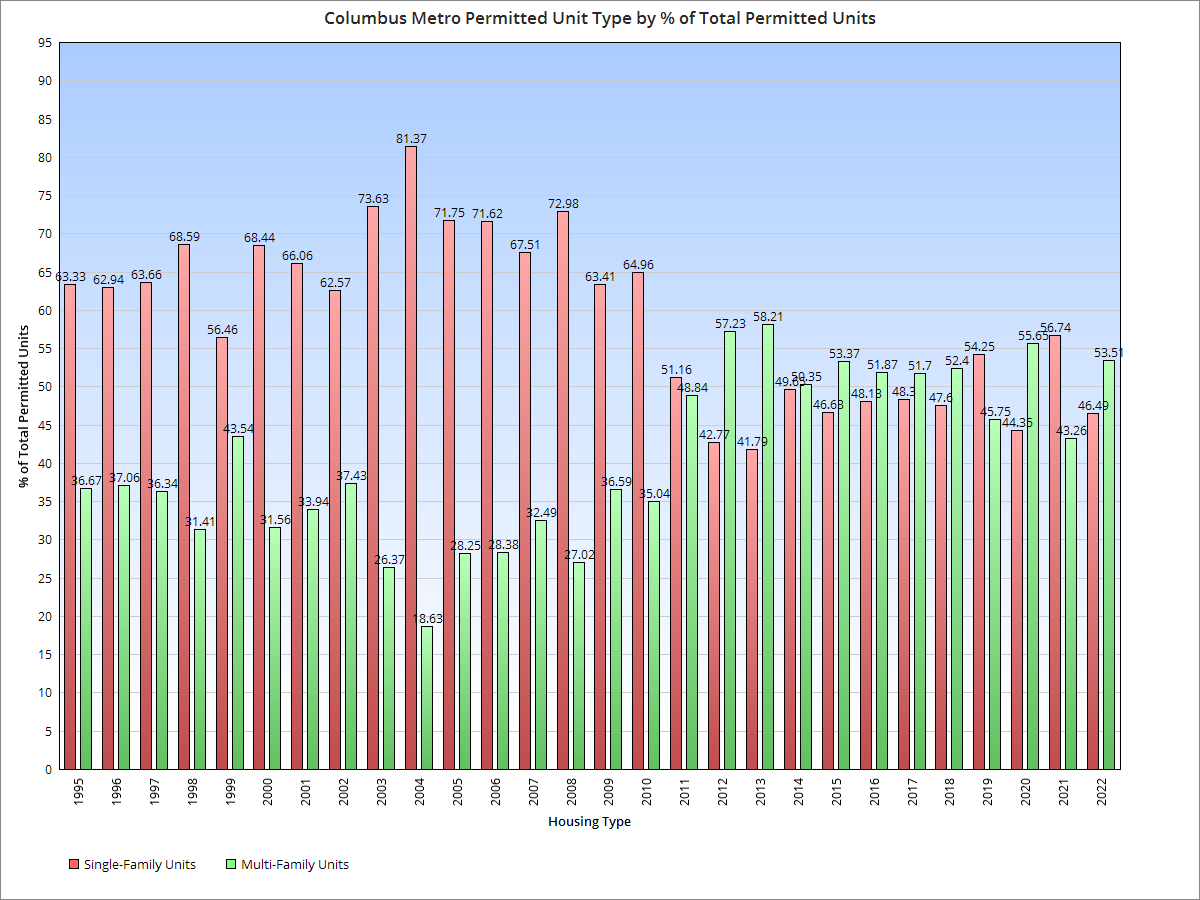
Here is the permitted housing type as a % of total permitted units. Between 1995-2010 the average breakdown was 67.46% Single-Family and 32.54% Multi-Family. Since 2010, the breakdown has been 48.16% Single-Family and 51.84% Multi-Family, representing a full 38.6-point margin change towards Multi-Family.
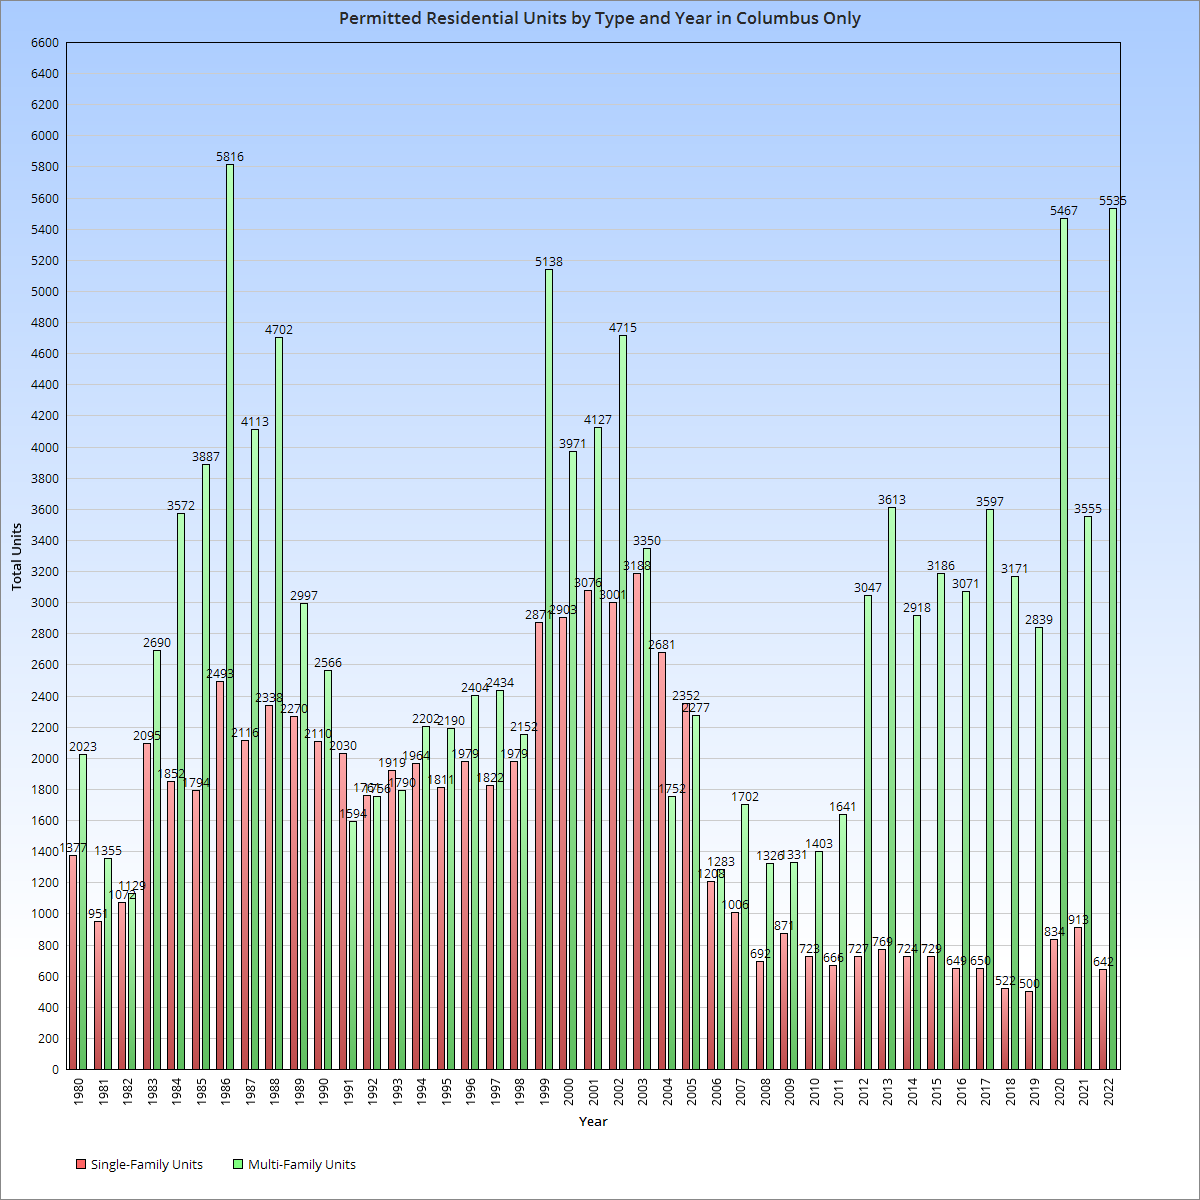
But what about what is actually getting permitted within just the city of Columbus, rather than the entire metro? City-exclusive data is available going back to 1980. The city experienced the same shift as the overall metro, but much more drastically.
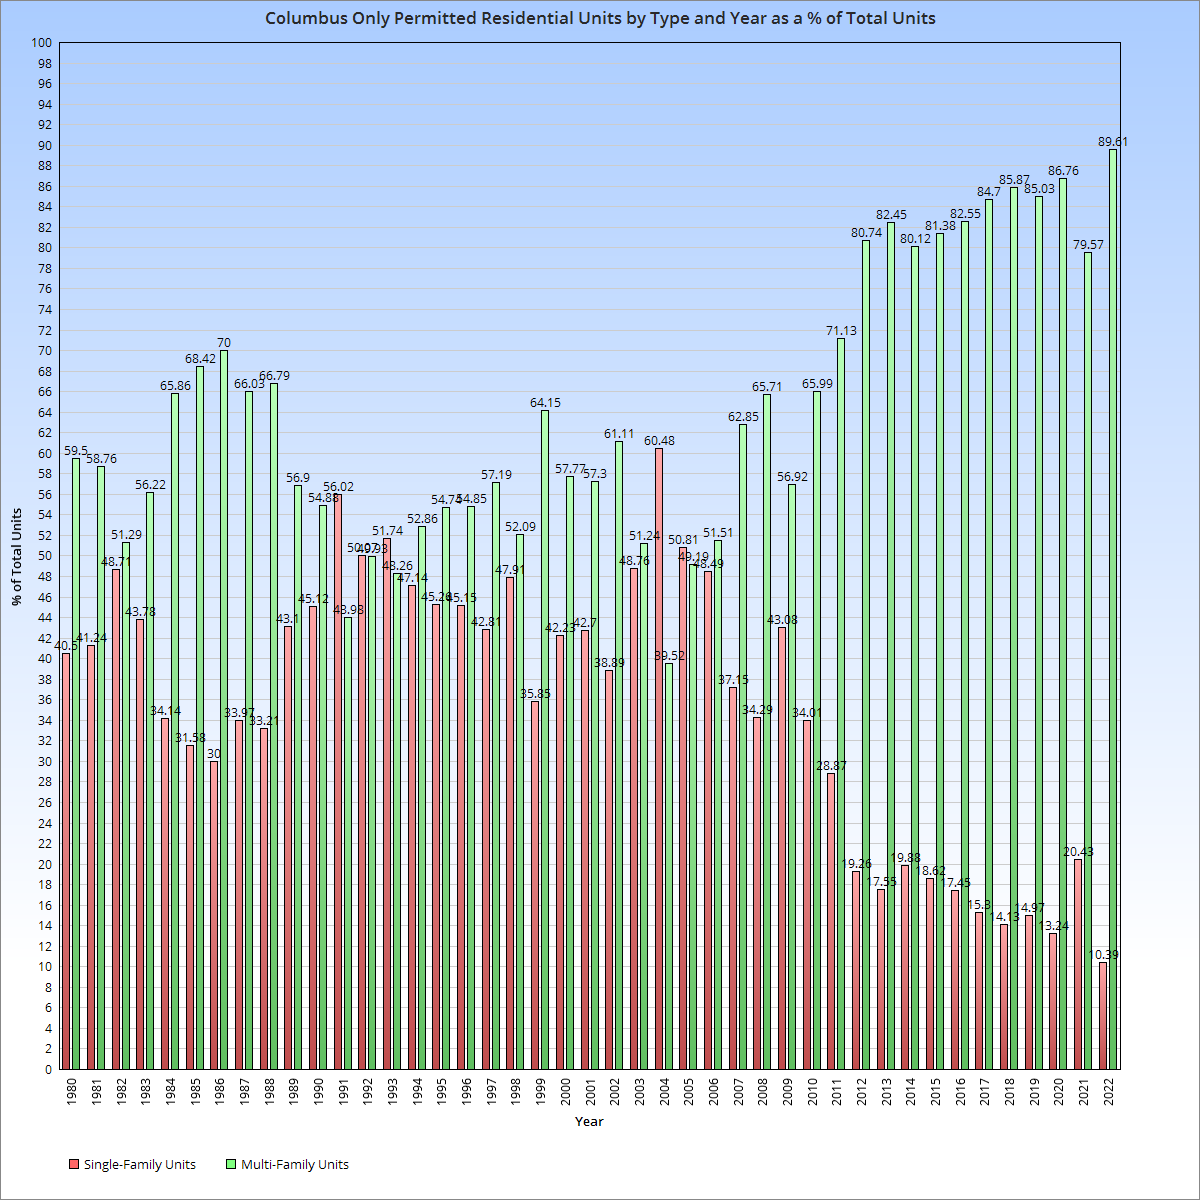
The % of total units by type for the city shows that single-family housing has been steadily becoming a smaller part of new construction permits since around 2003.
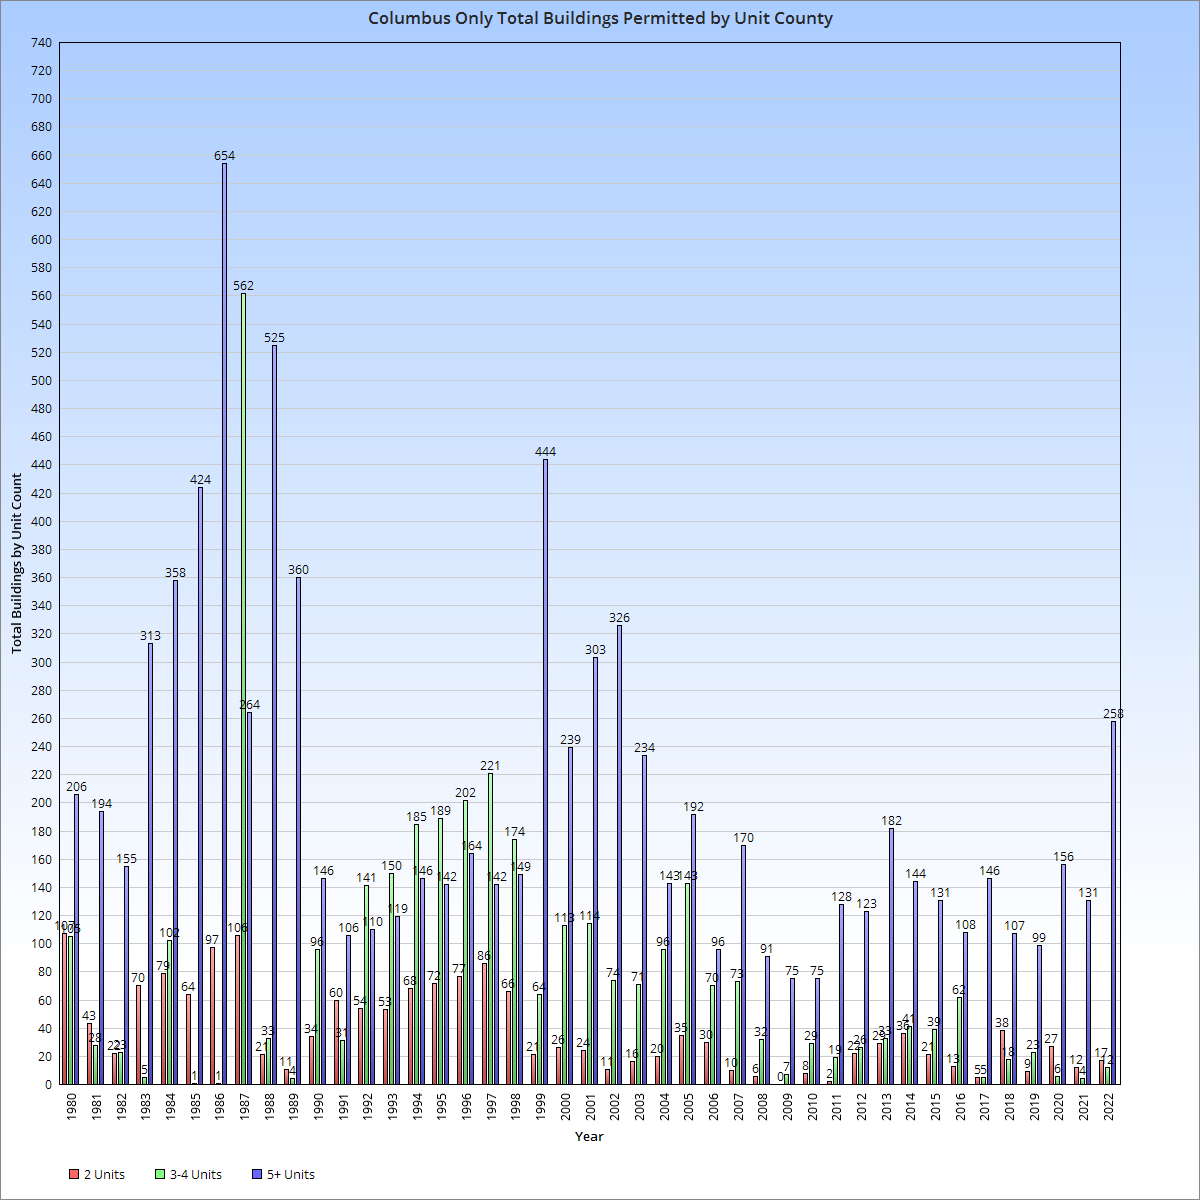
Finally, let’s break down multi-family permits by total number of buildings per unit count for the city only. Except for during the 1990s, 5+-unit buildings have been dominant, but it seems that fewer overall buildings are being built despite total units being high, suggesting that project size has increased over the years.
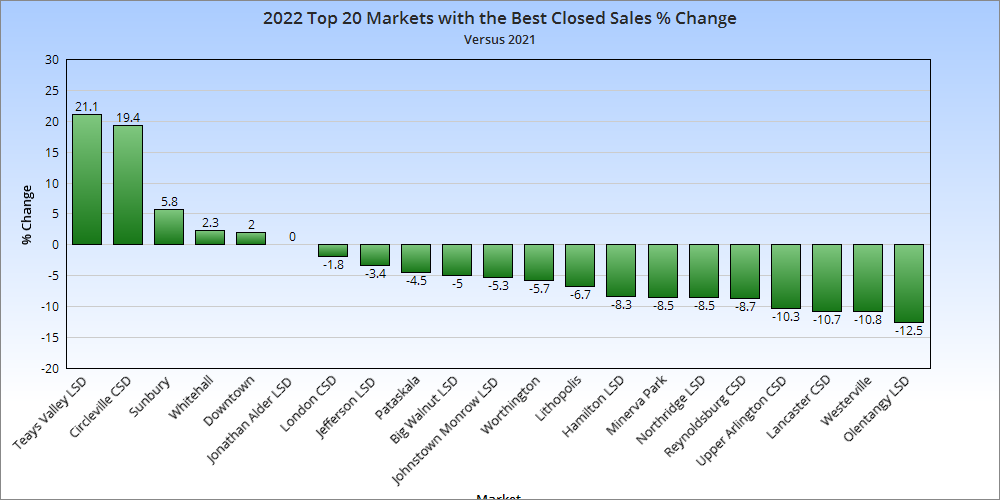
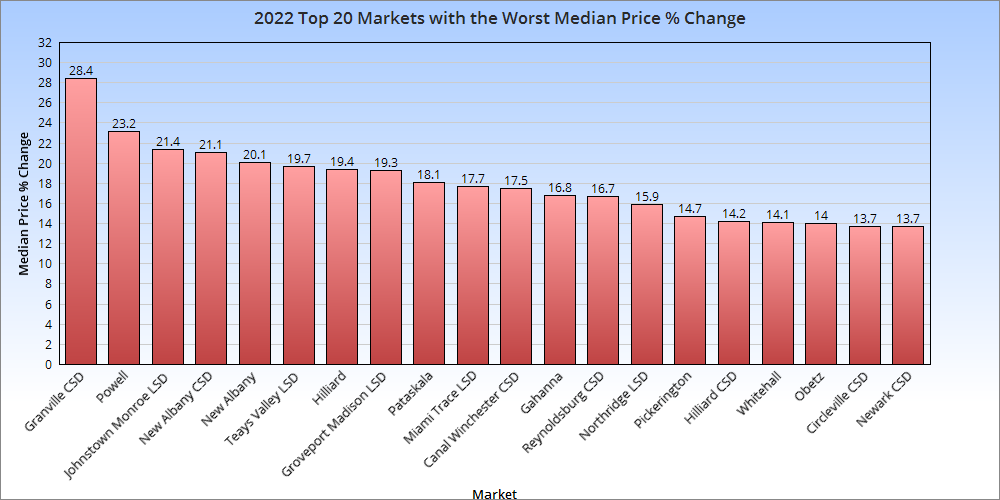
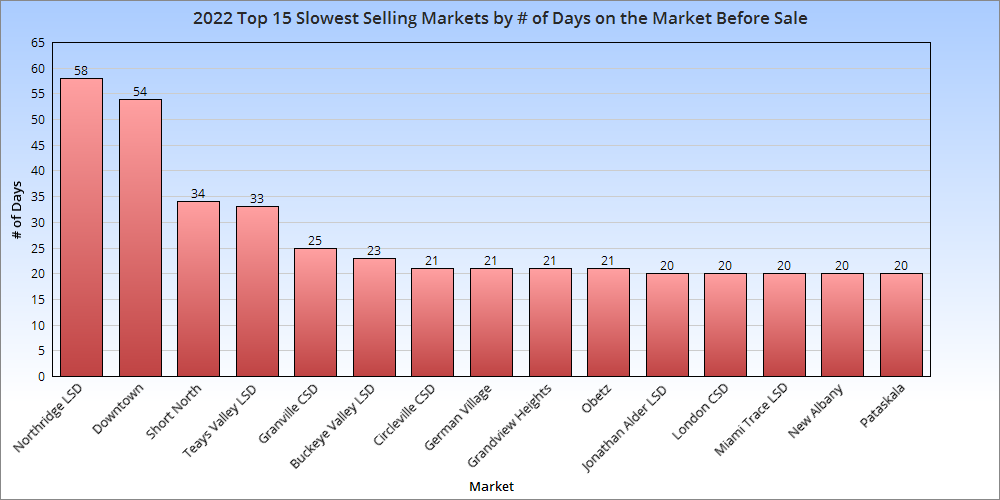
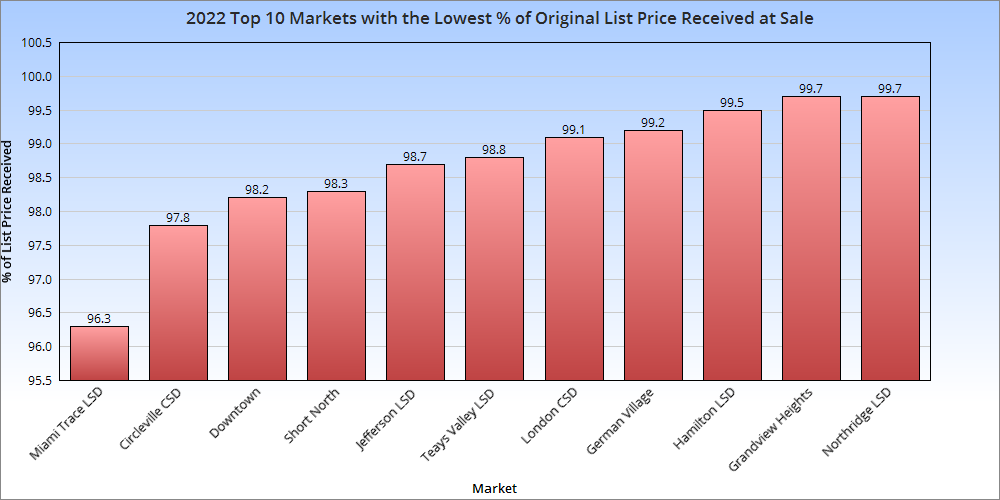
The 2022 final housing market update looks at the overall market performance for the year versus 2021.
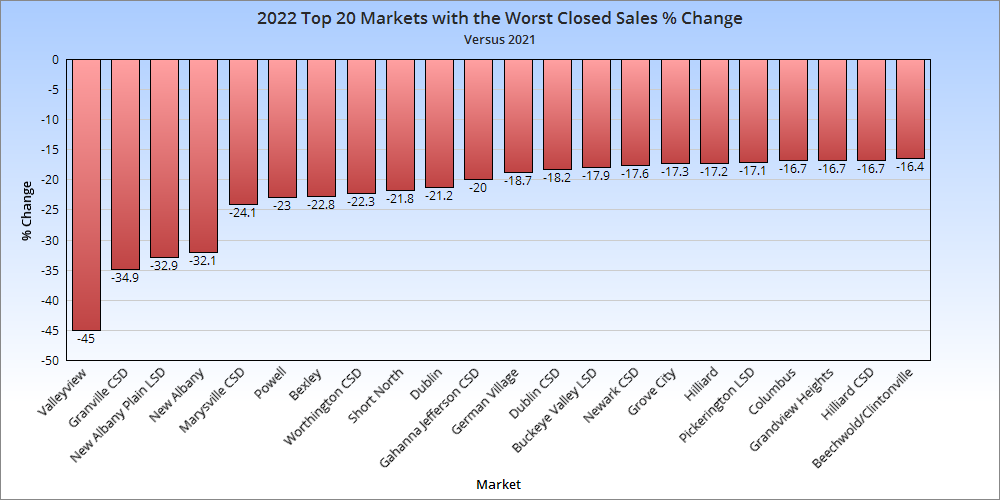
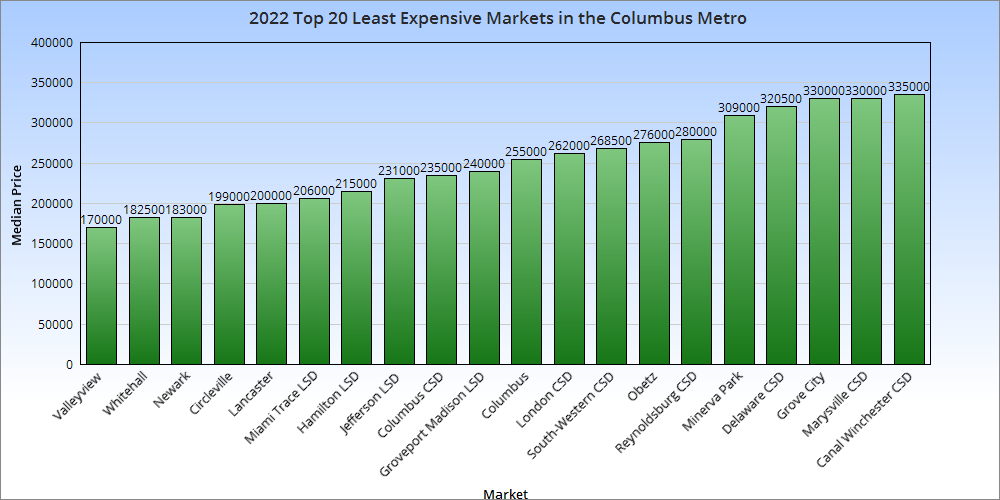
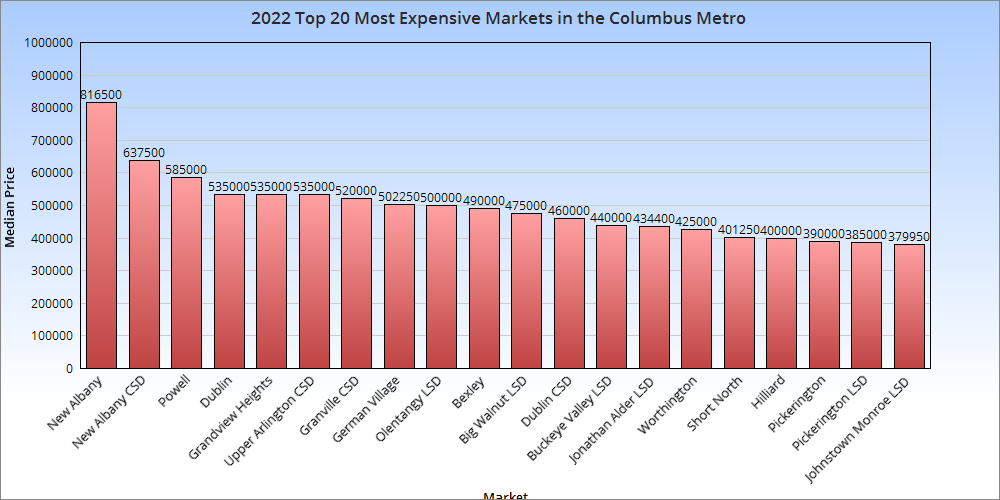
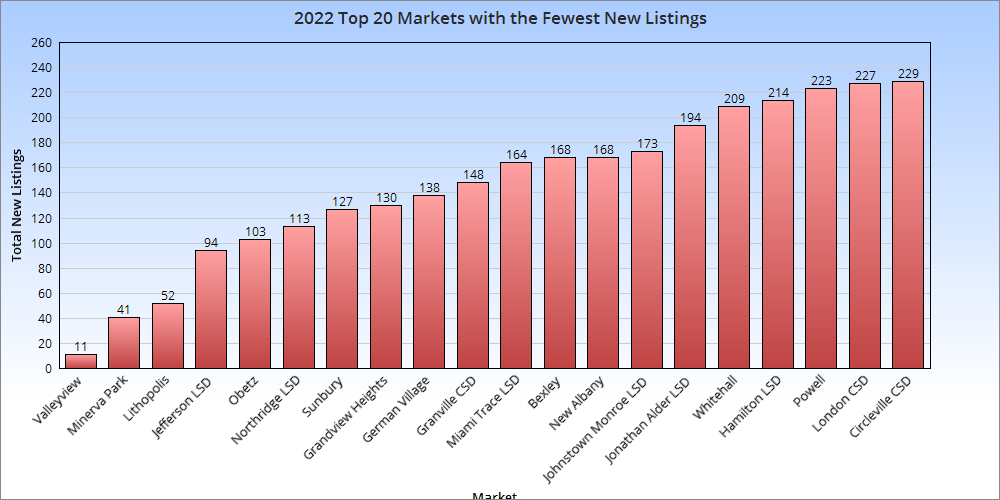
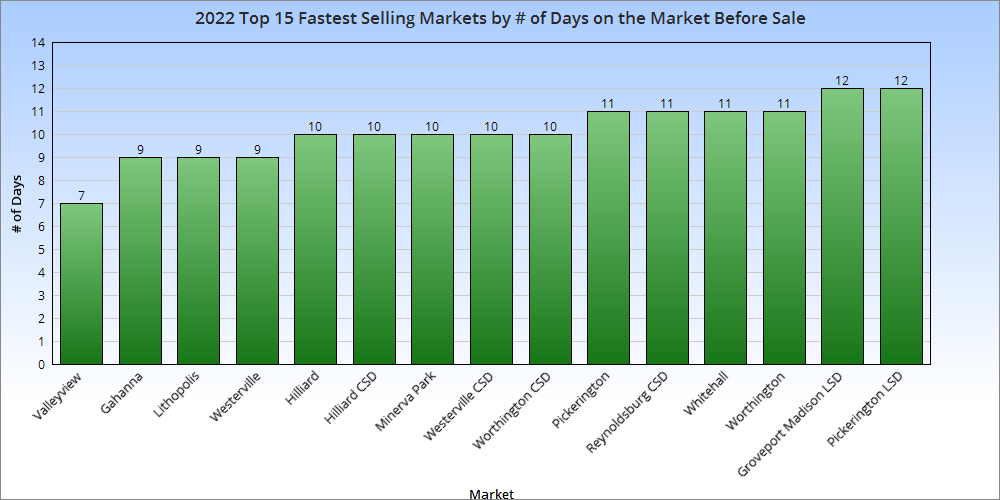
Note: LSD= Local School District, CSD= City School District. In both cases, school district boundaries differ from city boundaries.
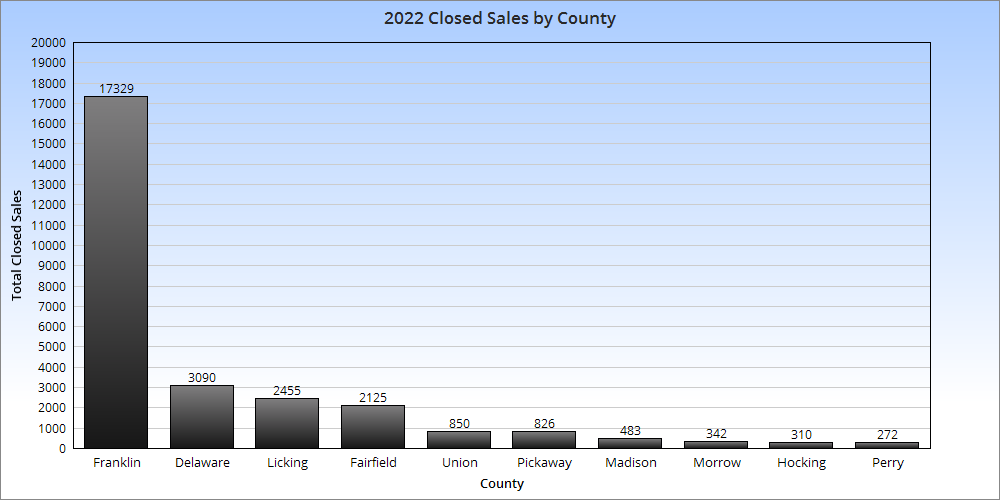
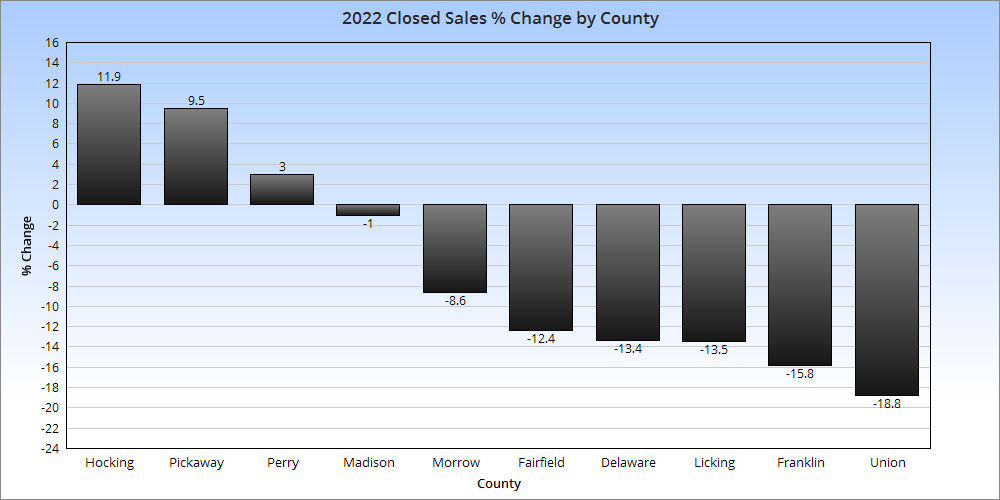
Closed sales are those sales that were completed during the year. 7 of the 10 metro counties saw declines vs. 2021.
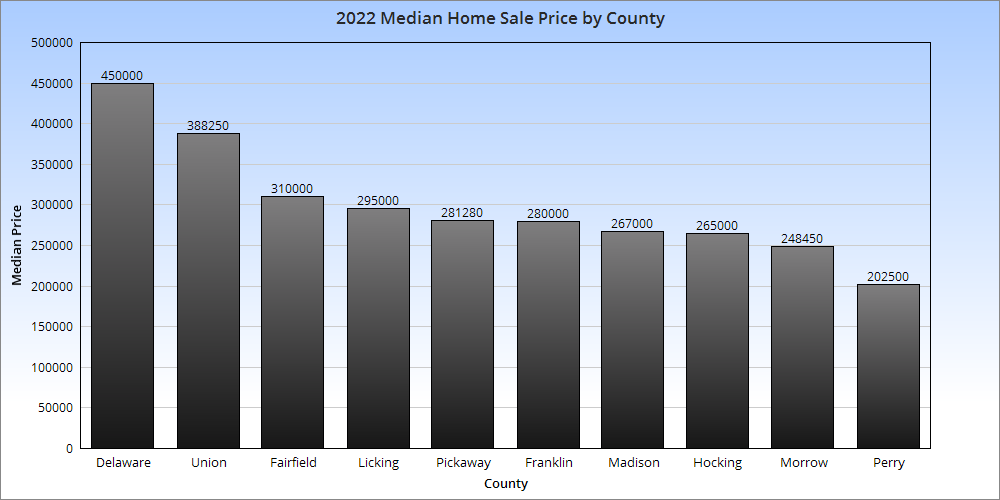
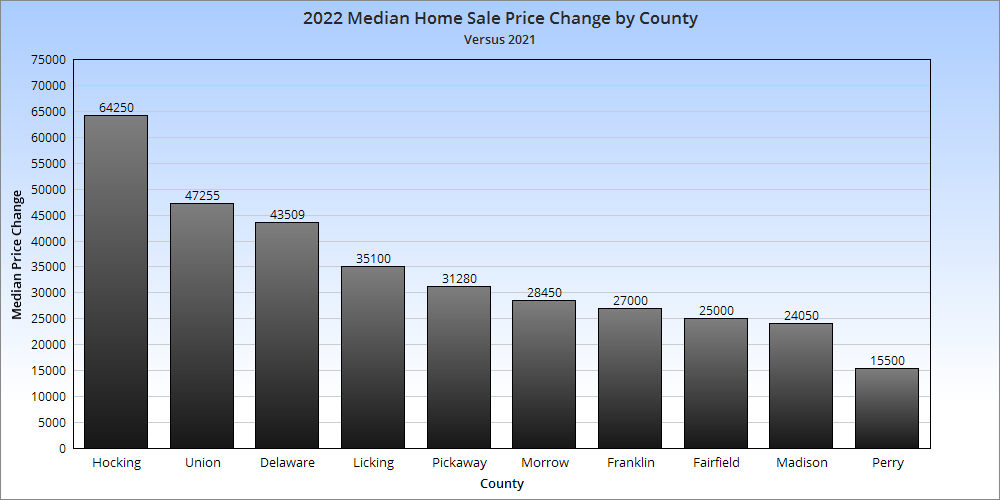
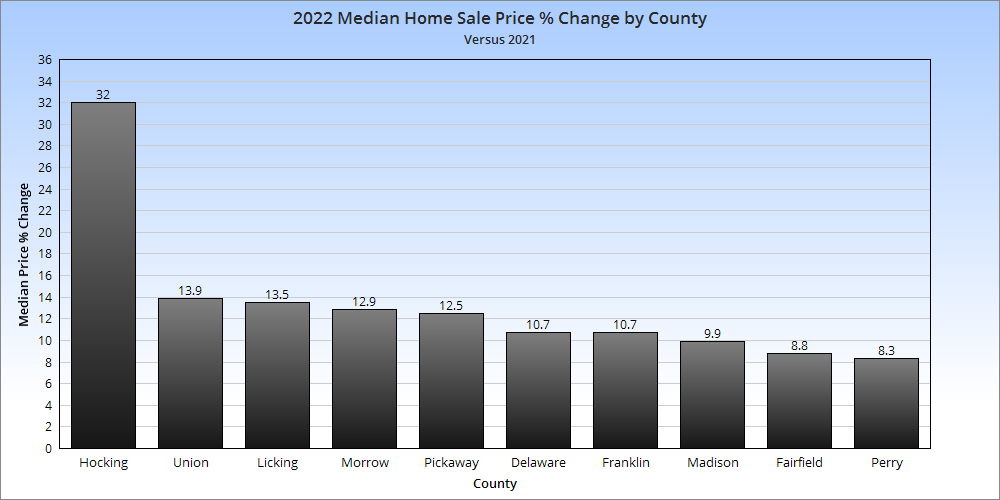
Overall Market Median Sales Price in 2022: $298,748 Based on the 10 Columbus Metro Area counties, the median price increased by $34,139 over 2021. Overall Market Median Sales Price % Change in 2022 versus 2021: +12.9%
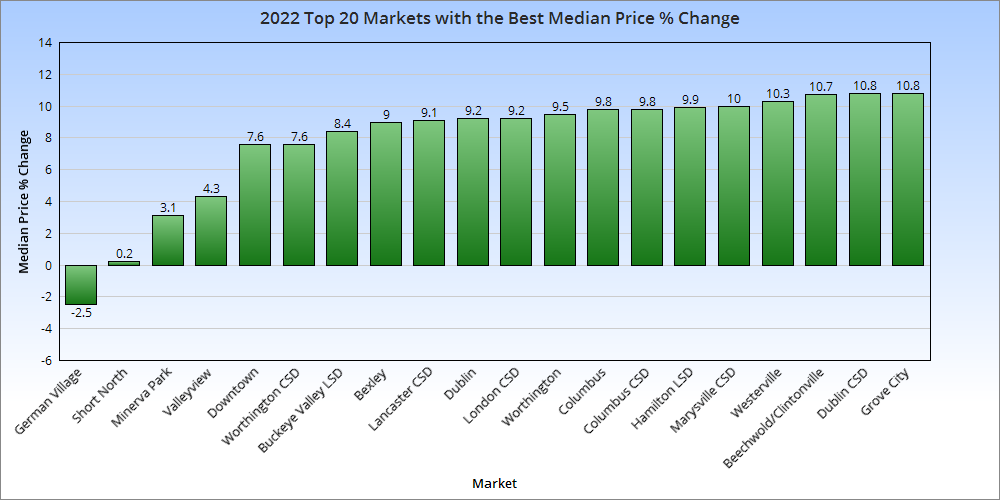
Best in the case of market median price % change is subjective. For buyers, it would be prices that have increased the least or even declined, while for sellers it would be the largest increases.
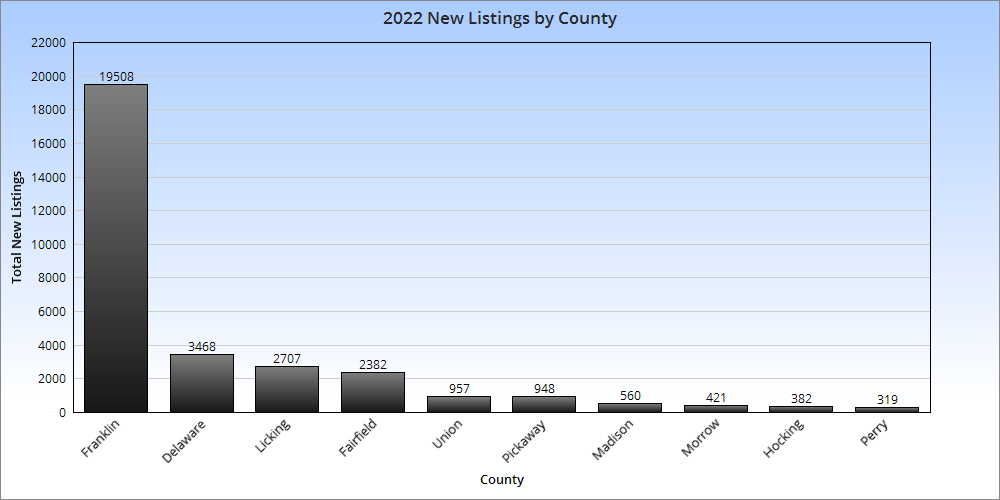
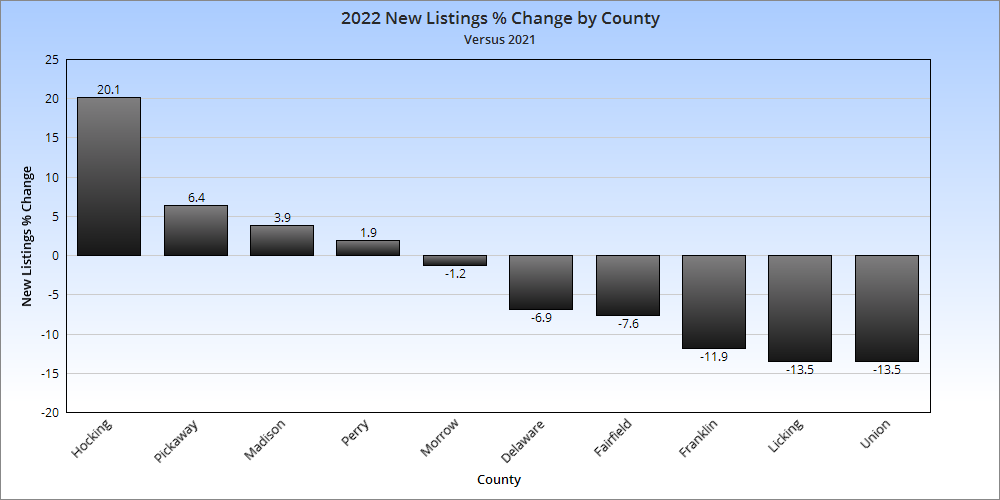
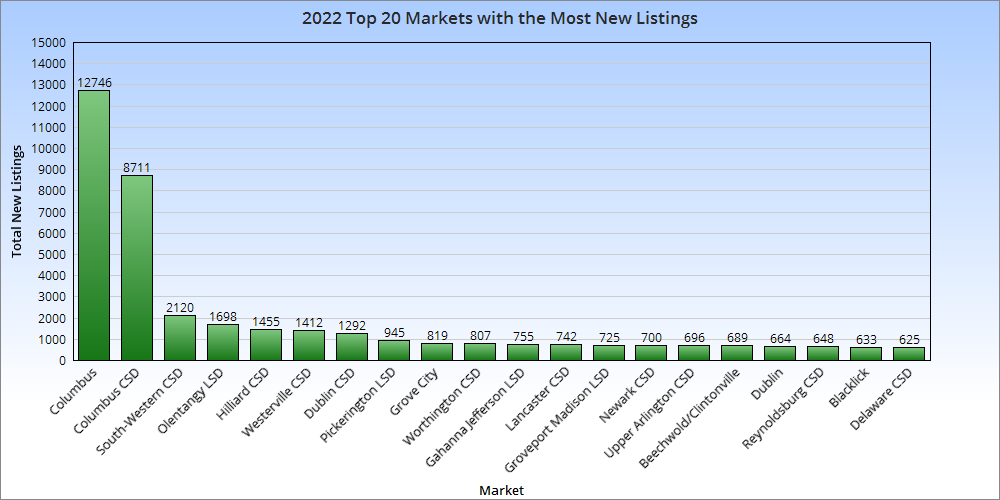
Total Metro New Listings in 2022: 31,652 Total Metro New Listings Change from 2021 to 2022: -3,508 Thousands of fewer homes going to market helped keep prices rising across the metro despite a significant slowdown in overall sales.
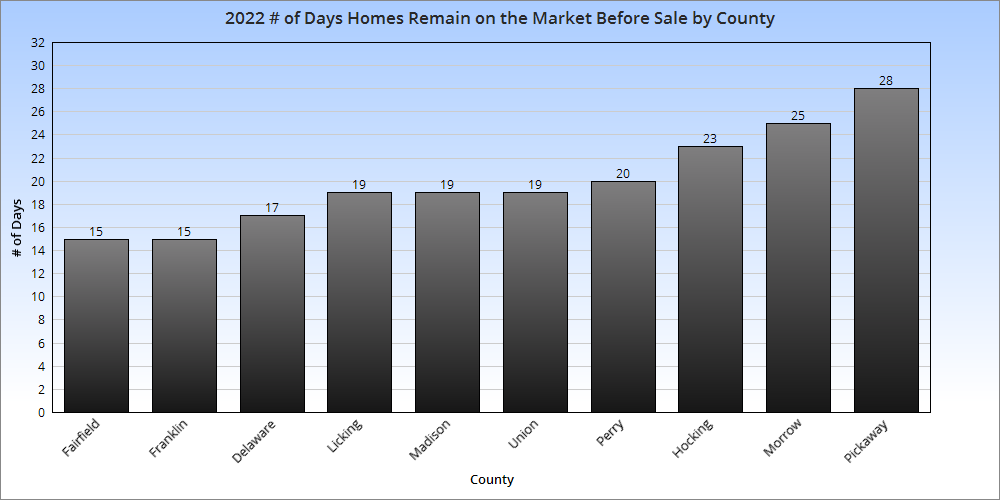
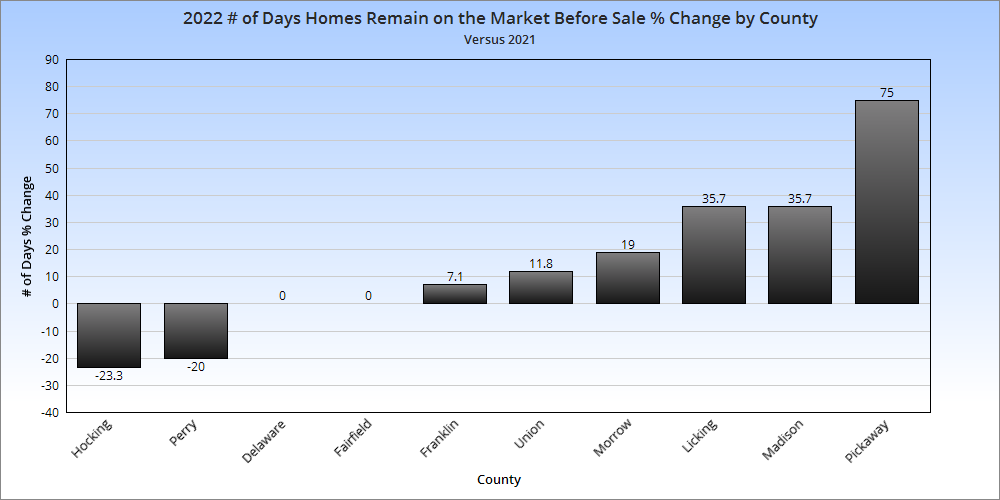
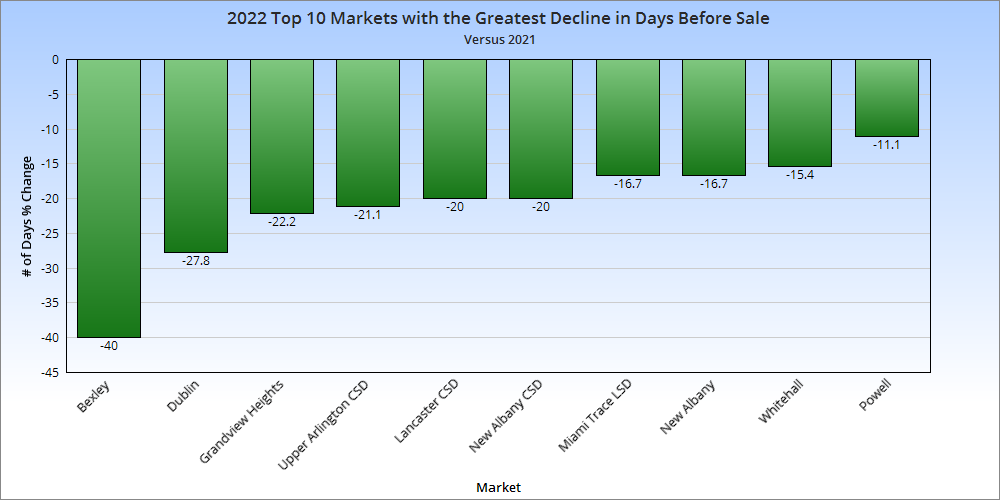
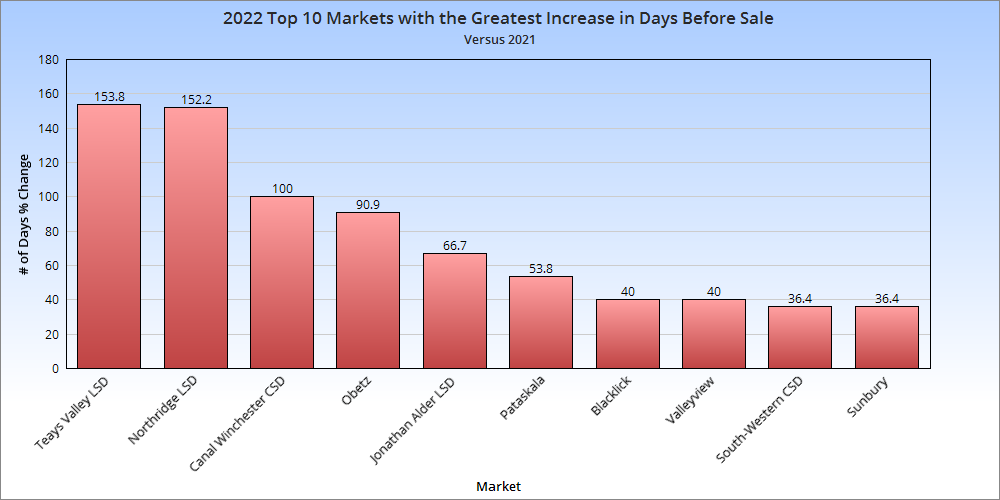
Average # of Days Homes Remain on the Market Before Sale for the Metro Overall in 2022: 20.0 # of Days Homes Remain on the Market Before Sale % Change for the Metro 2021 vs. 2022: +9.3%
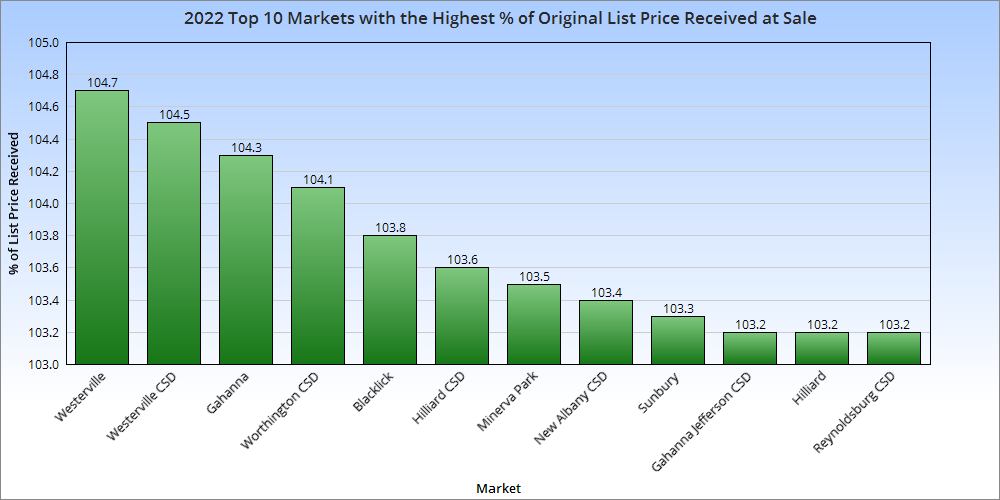
This new data shows whether a market was receiving more or less than the original list price for the homes for sale. Those above 100% were markets that typically had buyer competition to the point where they had to pay more than list. Those below 100% were the opposite, where relatively lower demand allowed some buyers to get a home for under list.
And there you have it, the final housing market update for 2022!
Next month, AllColumbusData.com will have its 10-year anniversary. Hard to believe! Here are some stats on just some of what the site now contains: -338 published posts. 10 additional are already complete and scheduled over the next few months. -105 specific content pages. -Well over 2,000 individual and before and after series historic photos. -143+ years of weather data for both Columbus and its suburbs. -200+ years of demographic and population data for Columbus and its suburbs. -Information and photos for hundreds of current and past development projects. -100+ videos.
What has been the most visited page, the most popular post over the years? Unfortunately, visitor data was lost prior to 2015 for various reasons. However, here have been the top 10 most popular posts and pages since 2015.
Top 10 Posts and the Year Published 1. Before and After How Columbus Changed in 10 Years 2021 This 2-part series was extremely popular last year, and easily became the most visited in the past 7 years. 2. Questions Answered- Columbus Zip Codes 2014 This post was very popular into 2018, but is now defunct. The information on this post ended up becoming bits and parts of other posts and pages. 3. Columbus Retail History- Shopping Centers 2013 One of the oldest posts on the site, it still gets consistent traffic almost a decade later. 4. Columbus Historic Church Demolition 2021 This one detailed plans to demolish an old church on the South Side. 5. Columbus Area Murders by Zip Code 2008-2015 2016 Pretty explanatory. This post provided crude maps of murders by zip code. 6. Columbus’ Greatest Snowstorm 2021 This post gave an account of the March 7-8, 2008 blizzard. 7. Columbus Area Zip Codes and Their Economies 2013 Still a consistent hit after a decade, this post gave details on economic information by local zip code. 8. Winter 2020-2021 Review 2021 Review the 2020-2021 winter with stats and rankings, something that has been done for all winters since 2014. 9. Franklin County Gentrification Trends 1990-2015 2017 This post looked at how income and race changes were driving neighborhood gentrification around Columbus. 10. How We Should Develop Around Intel 2022 The most recent on this list, this post deals with how the area around the Intel project should have a development plan, and detailed a hypothetical map of what that development could look like.
Top 10 Pages 1. Columbus Tornado History The most popular by far, this page covers historic tornadic events throughout the entire Columbus Metro Area. 2. Olde Towne East Historic Buildings This has been the most popular of all the Historic Building Database pages to date. 3. Proposed Development This regularly-updated development page highlights the region’s many proposed projects. 4. Other Residential Historic Buildings This page was one of the very first to be included in what would eventually become the Historic Building Database. It is defunct now, as its photos were eventually divided into a much greater expansion of featured neighborhoods. 5. Development Under Construction All the projects currently under construction at any given time. 6. Census Tract Maps Demographics, population and other data at the census tract level are provided in interactive maps going back to 1930. 7. Winter Storms This page chronicles significant winter weather events from the past. 8. Columbus Flood History As above, but dealing with flooding events. 9. Columbus Crime Statistics Violent and property crime data, maps and demographic data related to Columbus crime are provided going back about 40 years. 10. Completed Development Buildings and projects that were completed at some point in the past are highlighted on this page going back to the 19th Century.
Any surprises in what has been the most popular? Any posts or pages you’d like to see more of? Let me know here or on the Facebook page if you are enjoying the content or would like to see something different!
For the Columbus economy July 2022 report, we find several local industries in record high territory, but with a metro labor force that is barely growing. The data comes from the Bureau of Labor Statistics.
Overall Metro Area July 2022 and Change from July 2021 Labor Force: 1,136,345 +1,050 Employed: 1,093,966 +13,074 Unemployed: 42,379 -12,024 Unemployment Rate: 3.7% -1.1 Total Non-Farm Jobs: 1,126,200 +16,400 Numbers continued the trend of improvement year-over-year, but labor force growth remained relatively slow.
Overall Metro Area July 2022 and Change from February 2020 (Pre-Pandemic) Labor Force: 1,136,345 +15,541 Employed: 1,093,966 +17,126 Unemployed: 42,379 -1,585 Unemployment Rate: 3.7% -0.2 Total Non-Farm Jobs: 1,126,200 +14,800 The overall metro area remained better in July than the last month prior to the pandemic.
Now let’s view the results by industry.
Mining/Logging/Construction 7/2020———–7/2021———-7/2022 45,200————46,800———48,200 These industries remain near their all-time highs for total metro jobs. Mining/Logging/Construction Jobs as a % of Total Metro Jobs 7/2020————7/2021———7/2022 4.3——————4.2————–4.3
Manufacturing 7/2020———–7/2021———-7/2022 70,100———–72,700———-72,900 Manufacturing has largely recovered from pandemic losses, but remains well below historic highs achieved decades ago. Manufacturing Jobs as a % of Total Metro Jobs 7/2020————7/2021———-7/2022 6.7——————6.6—————6.5
Trade/Transportation/Utilities 7/2020———–7/2021———-7/2022 215,000———-225,400———240,200 These industries are at historic highs. Trade/Transportation/Utilities Jobs as a % of Total Metro Jobs 7/2020————7/2021———7/2022 20.4—————–20.3———–21.3
Information 7/2020———–7/2021———-7/2022 15,300———–16,000———-17,000 While nowhere near previous highs of the late 1990s-early 2000s “Dot.com” boom, this industry has been steadily growing since it hit a pandemic bottom in late 2020, and has returned to levels last seen in 2019. Information Jobs as a % of Total Metro Jobs 7/2020————7/2021———-7/2022 1.5——————1.4—————1.5
Financial Activities 7/2020———–7/2021———-7/2022 85,200———–85,900———-85,600 Financial jobs initially recovered from the pandemic recession, but then in late 2021 through part of 2022 plummeted to their lowest levels in 6 years. However, since May, they have been shooting back up and are once again close to historic highs. Financial Activities Jobs as a % of Total Metro Jobs 7/2020————7/2021———-7/2022 8.1——————7.7—————7.6
Professional and Business Services 7/2020———–7/2021———-7/2022 172,800———-183,800———181,200 These industries have been hovering around their highs since about 2015, so it seems like these jobs have not been changing much in recent years. Professional and Business Services Jobs as a % of Total Metro Jobs 7/2020———–7/2021———-7/2022 16.4—————-16.6————–16.1
Education and Health Services 7/2020———–7/2021———-7/2022 152,100———-159,800———161,800 While these industries have not fully recovered to pre-pandemic levels, they are relatively close to doing so. Education and Health Services Jobs as a % of Total Metro Jobs 7/2020———–7/2021———-7/2022 14.4—————-14.4————-14.4
Leisure and Hospitality 7/2020———–7/2021———-7/2022 90,600———–105,600————108,000 This industry should be near historic highs by the holiday season, despite being hit the hardest during the recent recession. Leisure and Hospitality Jobs as a % of Total Metro Jobs 7/2020————7/2021————7/2022 8.6——————9.5——————9.6
Other Services 7/2020———–7/2021———-7/2022 37,400———–41,100———-41,900 This industry is near historic highs. Other Services Jobs as a % of Total Metro Jobs 7/2020———–7/2021———-7/2022 3.5—————–3.7—————-3.7
Government 7/2020———–7/2021———-7/2022 170,100———-172,700———169,400 Government jobs have been in a slow decline since the pandemic recession. Government Jobs as a % of Total Metro Jobs 7/2020———–7/2021———-7/2022 16.1—————15.6————–15.0
For the Columbus economy June 2022 report, we find the metro area continues to post generally positive numbers versus 2021 and 2020. The data comes from the Bureau of Labor Statistics.
Overall Metro Area June 2022 and Change from June 2021 Labor Force: 1,130,201 +7,231 Employed: 1,087,813 +24,480 Unemployed: 42,388 -17,249 Unemployment Rate: 3.8% -1.5 Total Non-Farm Jobs: 1,125,000 +26,400 Numbers improved versus a year prior across the board, though with relatively slow labor force growth.
Overall Metro Area June 2022 and Change from February 2020 (Pre-Pandemic) Labor Force: 1,130,201 +9,397 Employed: 1,087,813 +10,973 Unemployed: 42,388 -1,576 Unemployment Rate: 3.8% -0.1 Total Non-Farm Jobs: 1,125,000 +13,600 The metro area continues to be above pre-pandemic levels on all measurements.
Now let’s view the results by industry.
Mining/Logging/Construction 6/2020———–6/2021———-6/2022 45,000————46,300———48,500 This industry has fully recovered from the pandemic and is the highest since at least 1990.
Manufacturing 6/2020———–6/2021———-6/2022 69,600———–72,400———-72,900 Manufacturing has recovered from the pandemic period, but isn’t growing nearly as fast as other industries.
Trade/Transportation/Utilities 6/2020———–6/2021———-6/2022 213,300———-222,500———239,800 Fully recovered, this industry is at all-time highs.
Information 6/2020———–6/2021———-6/2022 15,500———–15,600———-16,700 The pandemic didn’t affect this industry much, as it was already in a general decline since the late 1990s-early 2000s.
Financial Activities 6/2020———–6/2021———-6/2022 84,300———–84,700———-85,400 Numbers for this industry have kind of been all over the place in recent years, but seem to be mostly stagnant since around 2016, so the pandemic didn’t have a strong effect either way.
Professional and Business Services 6/2020———–6/2021———-6/2022 171,000———-179,400———179,900 As with the financial activities industry, this one has been rather stagnant since about 2015-2016.
Education and Health Services 6/2020———–6/2021———-6/2022 149,700———-158,800———158,600 Education and Health were hard hit during the pandemic, and while they have recovered most of their lost jobs, have been unable to date to push past pre-pandemic highs.
Leisure and Hospitality 6/2020———–6/2021———-6/2022 86,400———-100,500———-109,600 The hardest hit industry by far, it has recovered the vast majority of lost jobs, but still remains a bit below pre-pandemic levels.
Other Services 6/2020———–6/2021———-6/2022 35,800———–40,400———-42,000 This industry is basically recovered.
Government 6/2020———–6/2021———-6/2022 171,200———-177,000———171,600 Government jobs have struggled to recover, and 2022 is not moving in the right direction, though this may not have anything to do with the pandemic.