In Franklin County, the immigrant- or foreign-born- population has been growing rapidly for the last few decades. Latin American immigration was dominant for many years, but has recently taken secondary position to even faster Asian growth. But where does the immigrant population live, exactly? Where they end up in the county is perhaps not where common belief would always suggest. The interactive map below breaks down not only the main continent of origin for immigrants by census tract, but also gives the top 5 specific origin nations. While at first glance, the continents seem heavily grouped together, a deeper look at nations of origin indicate that immigrant populations are much more diverse and spread out much more evenly than it appears.
Happy day! The 2020 Census data is finally beginning to be released after months of delays, including 2020 census state populations. Let’s take a look.
In many cases, the 2020 estimates had significant errors. New York was found to have more than 800,000 people above what the estimate was. The estimate assumed the state had lost population the past decade, but it had actually gained well over 800,000. Ohio was also undercounted by more than 106,000. In general, the Census estimates had Northern states with either too large losses/too slow growth than reality, while Southern states were generally estimated to have grown more than they really did. This has been a long-standing bias within the Census estimates program.
Total Change By Region Between 2000-2010 and 2010-2020 South: -2,571,014 Midwest: -475,772 Northeast: +531,490 West: -2,104,601
Ohio moved into the top 25 in total growth and was one of the top states for the biggest improvement between the 2000s and 2010s. However, because it was already one of the most-populated states in the nation, its total growth still wasn’t enough for it to not lose another House district. The state will have to keep improving if it wants to maintain its level of representation in Congress. Meanwhile, the fast-growing South and West regions clearly slowed down in growth the past decade. Combined, they added 4.675 million fewer people the past decade than they did during the 2000s. The Midwest was more of a mixed bag, with more states improving, but Illinois cancelling out all of that positive momentum. Only the Northeast managed to add more people the past decade than it did during the 2000s, mostly led by a huge improvement in New York.
The Census will release 2020 population numbers for counties, cities and other places over the next few months, and will be posted here when they are.
For a long time, Columbus has had a reputation for having a relatively easy commute, at least in terms of driving. Its abundant highway and road system allowed commuters to travel to work quickly, with most commutes 20 minutes or less. However, as the city has grown and traffic has increased, the local commute may not be as quick as it once was. Story after story has shown that Columbus’ commute is steadily getting worse.
This post seeks to answer both how people are getting to work, how fast they get to work, and how commuters in Columbus differ from those in other cities. For this comparison, I used cities from metro areas most similar to Columbus’ size- 1.5-2.5 million- as well as major Midwest and Ohio cities.
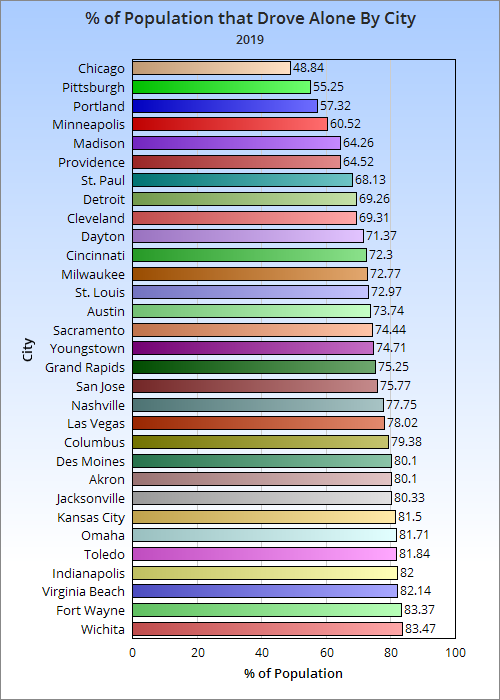
First, let’s look at just how people get to work by the % of workers in 2019, the latest year available.
Out of the 31 cities looked out, Columbus is the 10th most car-dependent city. It is also the 3rd most car-dependent in Ohio after Akron and Toledo.
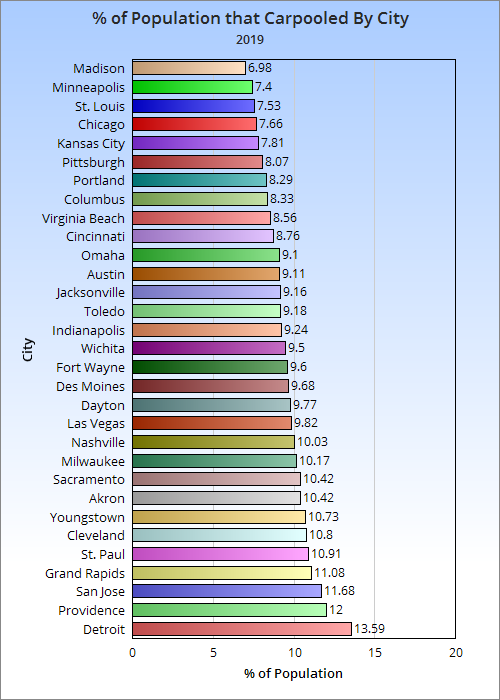
The heavy use of cars in Columbus did not translate to more people carpooling.
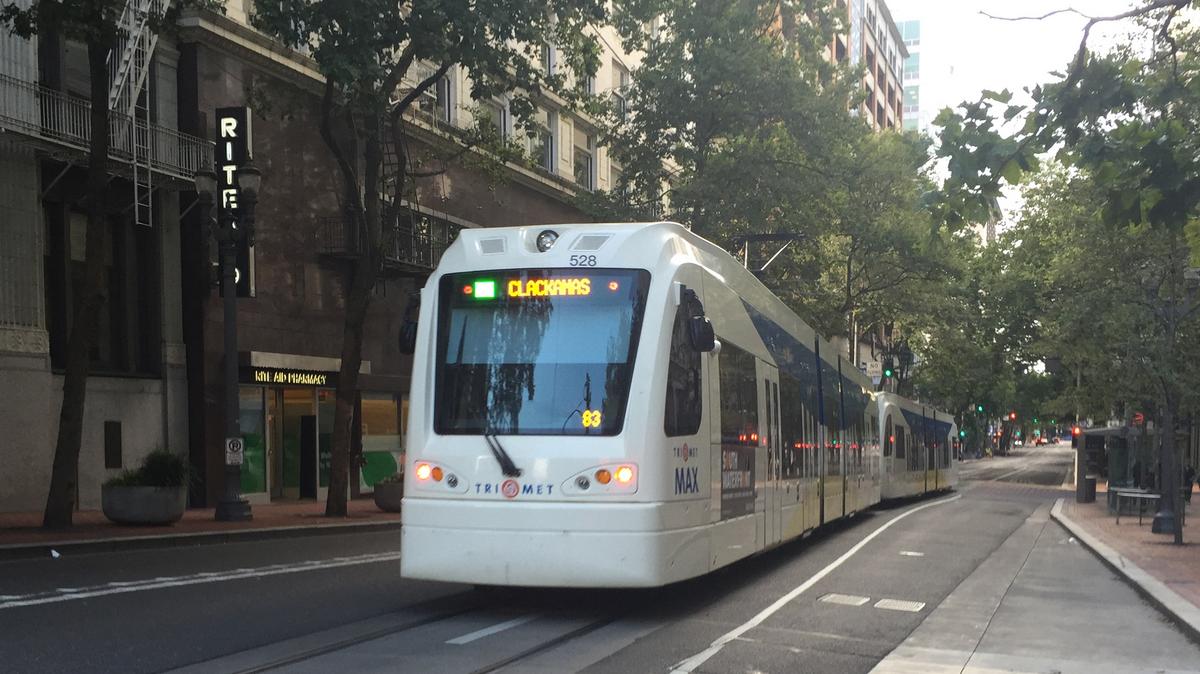
With only the COTA bus system available, the portion of the population that uses public transit is also in the bottom half. This despite the city seeing strong bus ridership growth over the last several years.
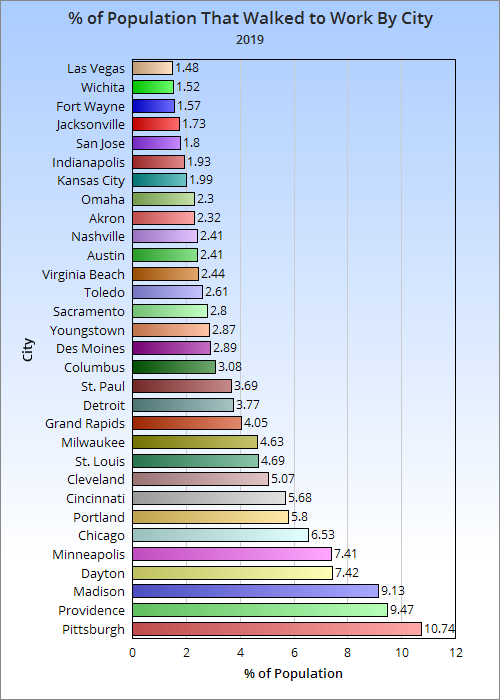
Columbus sat right in the middle of cities with the number of walking commuters. Several parts of the city lack sufficient walking infrastructure. For example, large parts of Linden and the South Side were built without sidewalks of any kind. Crosswalks and other safety features are also lacking in many areas.
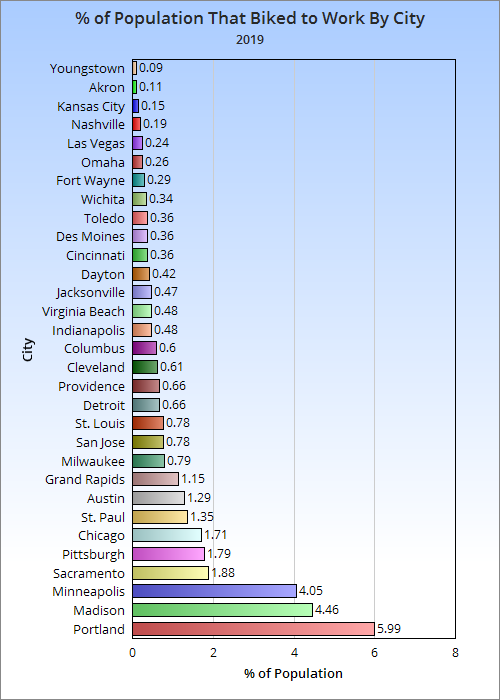
Columbus is again in the middle of the pack on biking commutes, and again infrastructure is the likely reason. There is only a single section of one bike lane that is protected anywhere in the city. Creating more bike lanes, let alone protected ones, remains a low priority for the city. Instead, they have relied on “Shared Use” type signage, along with painting sharrows.
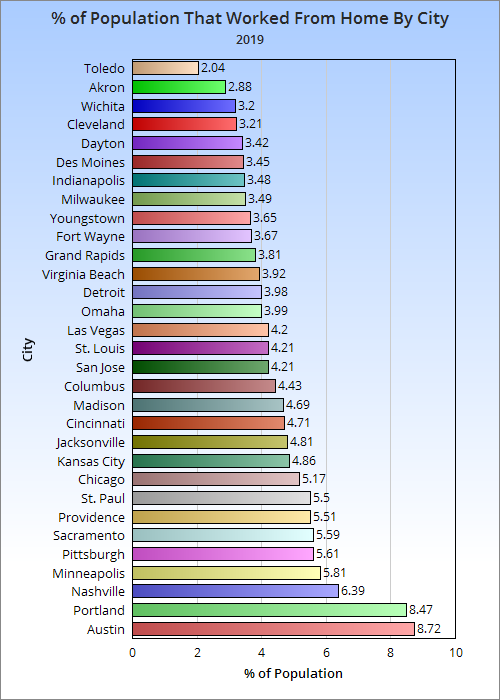
Columbus was in the top half of at-home workers. These numbers were all prior to the pandemic, so it’s likely that there will be significant increases in long-term or permanent home workers in post-2019 numbers.
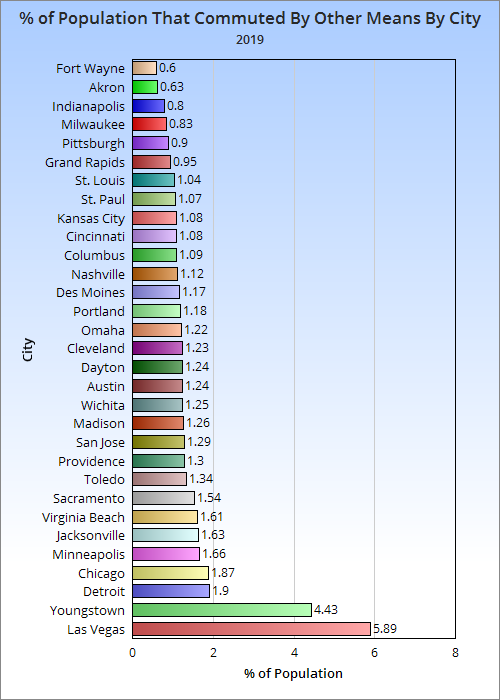
Other types of commuting include everything from taxis to commercial airline flights.
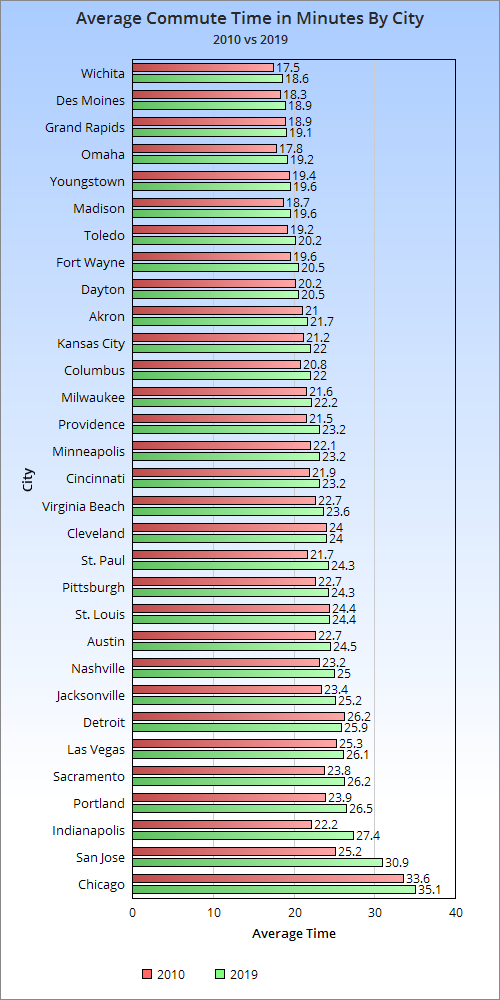
Columbus was in the bottom half of cities for the average commute time. Like almost everywhere else, that time has been increasing, however. Columbus saw the 11th biggest commute time increase and had the 2nd largest in Ohio. With its far larger population growth recently and predicted, that commute time is only going to get worse.
It’s pretty clear that Columbus has significant car dependency. With increasing commute times, it is crucial to plan for how people will get to work in the future. That is why it’s so important that new development is built to be walkable and dense while the average commute is still relatively short. This will promote walking, biking and new transit forms, all of which is better for a more vibrant, healthier city. It will also perhaps keep the number of cars on the road from growing as much. To assist in this process, the city must invest in more pedestrian and bike-friendly infrastructure, while also writing building codes that promote better planning in development.
To be fair, Columbus has made some progress. In 2010, the % of the population that drove alone was 80.76%, 1.38 points above where it was in 2019. Furthermore, the city has promoted more bus usage with its CPASS program. That said, the culture changes could’ve been much better had more policy and infrastructure been in place years ago like many other cities have had. Columbus has a lot of work to do.
Is North Linden the best neighborhood for a starter home in Columbus? For many local residents, when they hear “Linden”, they may only think of negatives such as crime and neighborhood condition. Like many other parts of urban Columbus, the area is changing as development forces and population growth have begun pushing in from all sides, however.
With the Columbus market on fire, supply low and prices skyrocketing due to heavy demand, Linden homes are being looked at with a new perspective. Linden homes are some of the most affordable anywhere in Columbus, and while the neighborhood can be hit or miss to say the least, North Linden has begun to emerge as a destination for first-time home buyers.
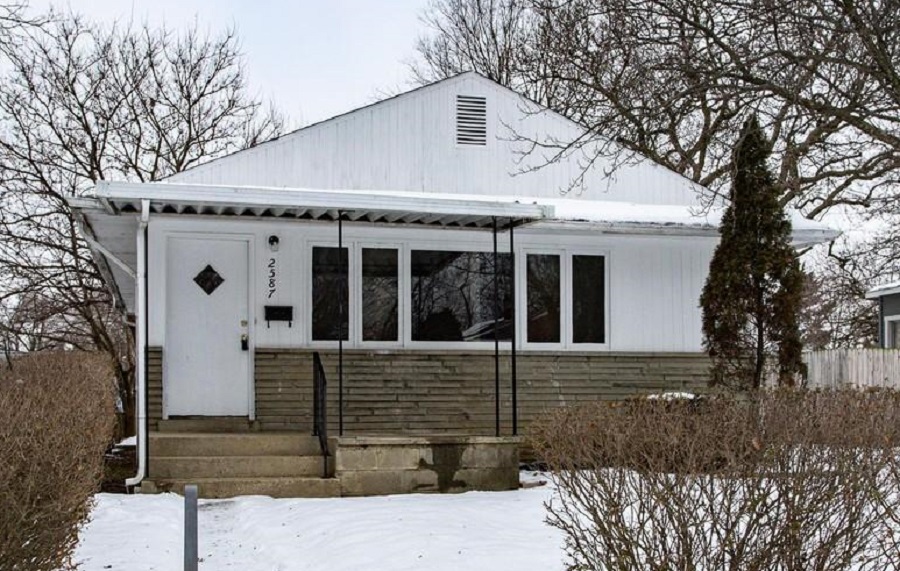
Although the southern part of Linden was constructed before WWII, the vast majority of the remaining area was built in the 1950s and 1960s as former soldiers looked to start new lives. Because of the era in which many of the homes were built, most are single-story ranches or Cape Cod style cottages. The square footage of many of these homes tends to be around 1000 square feet or less. Until recently, the small relative size, among other issues, kept buyers away. The aforementioned tight real-estate market has given these homes potential new life.
North Linden is generally the part of the neighborhood that is to the between I-71 and Cleveland Avenue west to east and between Hudson Avenue and Cooke Road south to north. Let’s take a look at some of the homes currently on the market in this area to get a feel for what is available there.
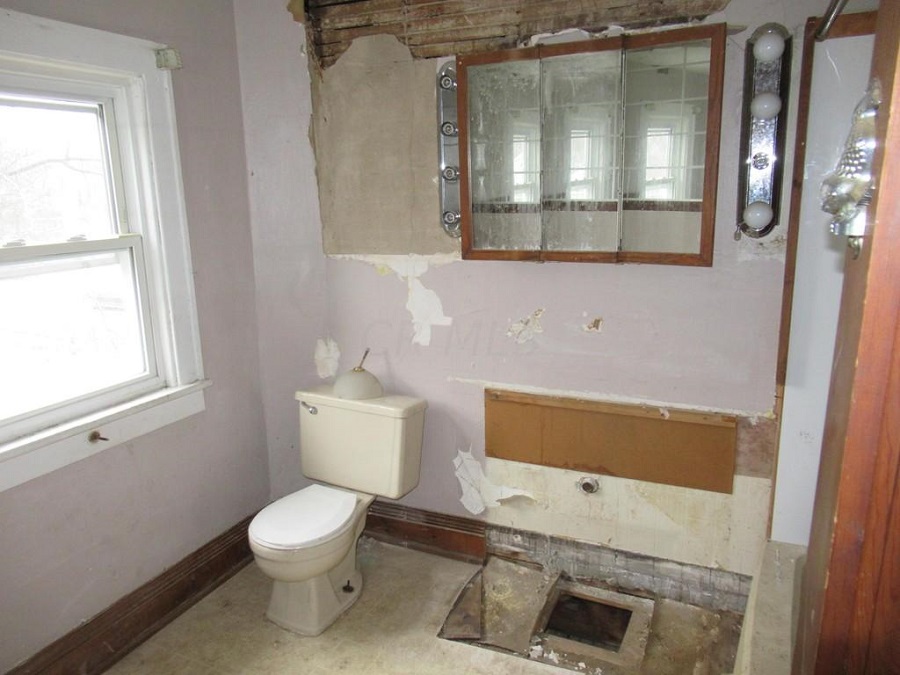
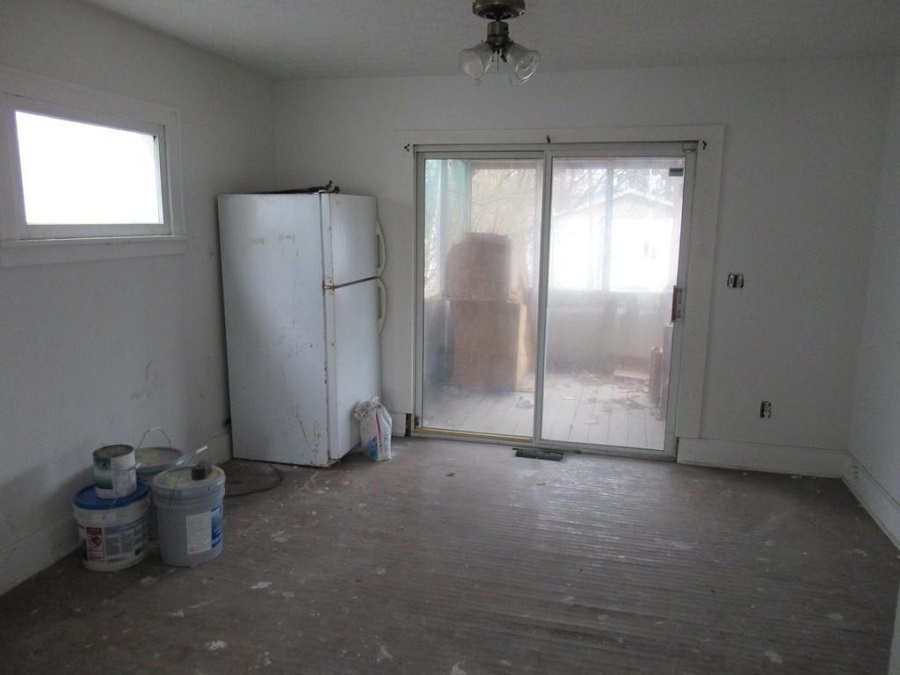
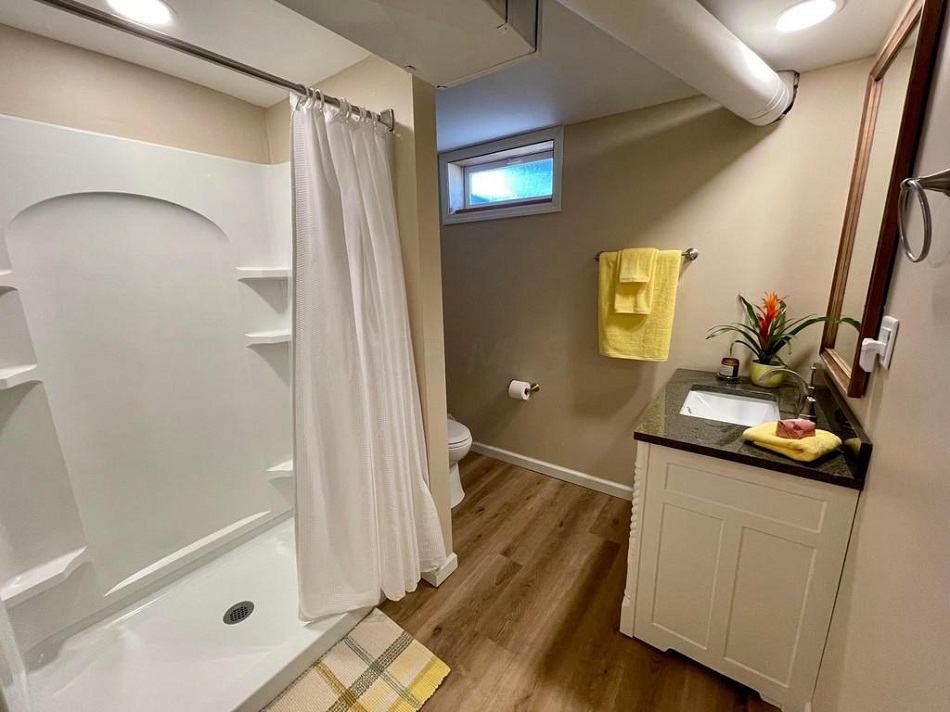
1541 Genessee Avenue: $25,000 Square Footage: 1,056 This pre-WWII home is an example of many in the area that need some level of renovations- in this home’s case- major renovations. For those willing to take on a challenge, these types of inexpensive purchases could be a consideration.
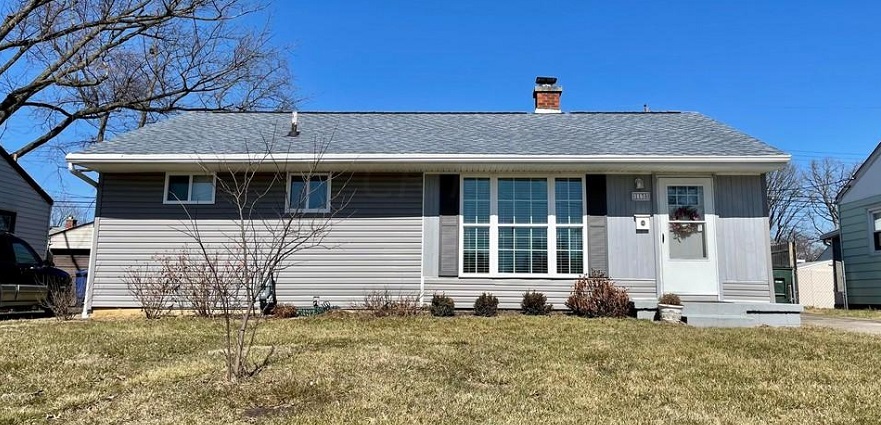
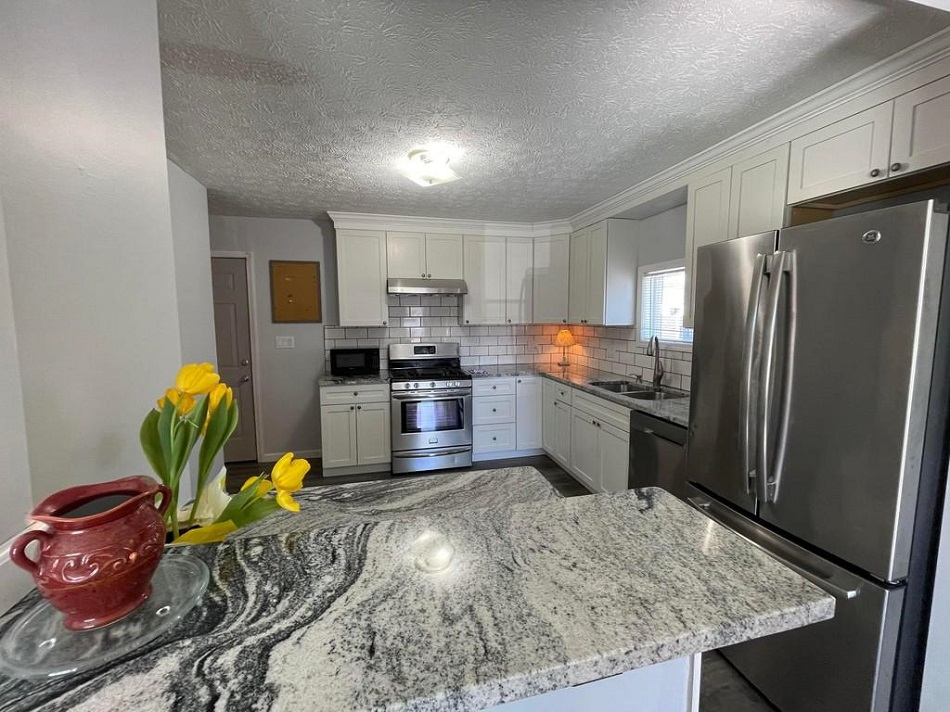
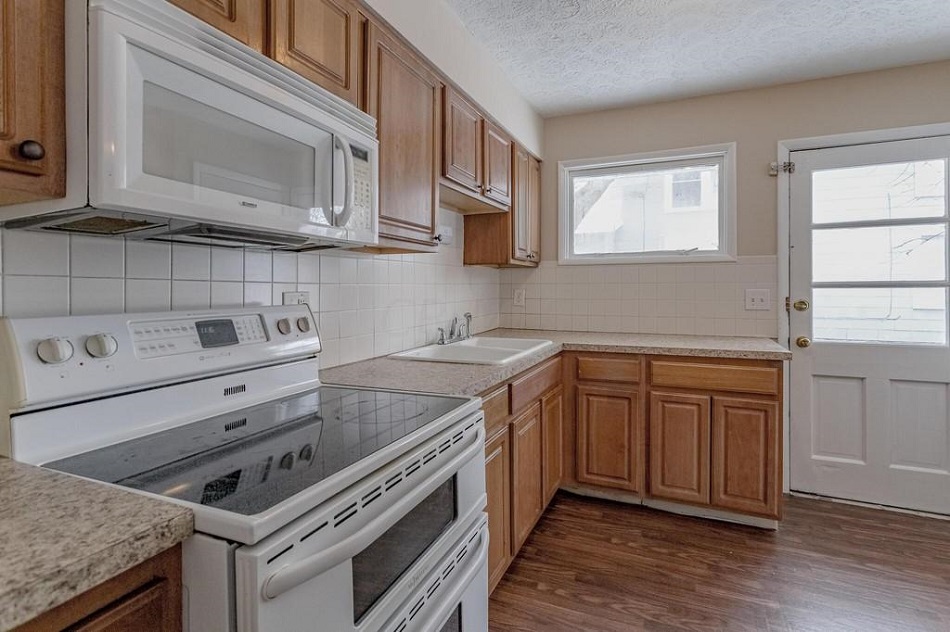
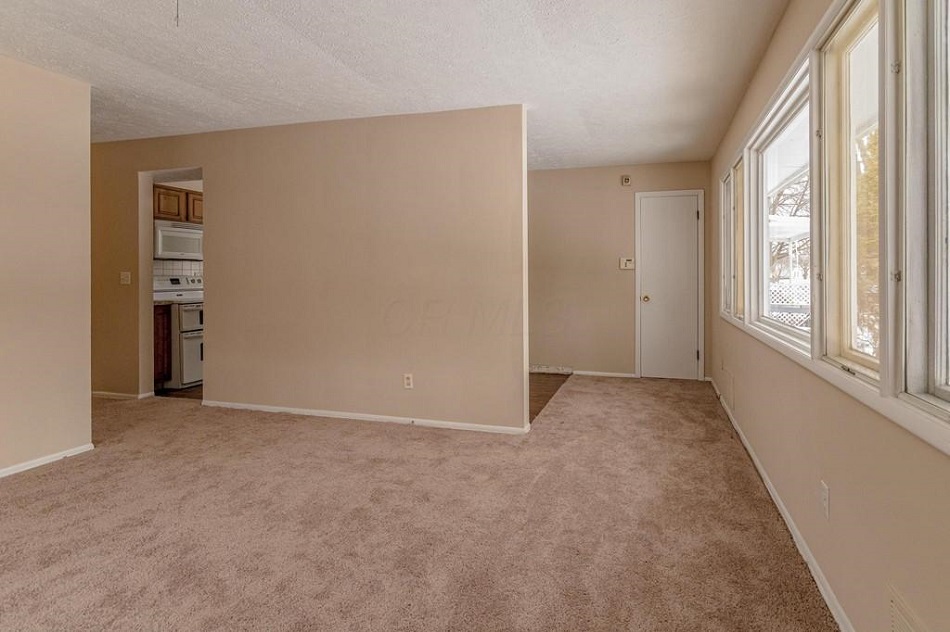
1130 Pauline Avenue: $185,000 Square Footage: 1,412 Built in 1955, this home is much more typical of the housing stock that exists within the neighborhood, but on the larger side. Unlike the home above, this one has been fully renovated and shows the potential of what they can become. This type of home represents the top of the market in terms of price in the neighborhood, showing just how affordable the area really is. https://www.realtor.com/realestateandhomes-detail/1130-Pauline-Ave_Columbus_OH_43224_M37110-45745
Beyond the less expensive prices and variety of quality fixer-uppers and renovated starter homes, North Linden is also well-situated near popular areas such as Easton, Clintonville, OSU Campus and the Morse corridor, which is rich in locally-owned restaurants and markets that specialize in foods and products from Asia, Africa and the Middle East. While there are many positives, some negatives might be higher crime in some spots- particularly closer to Cleveland Avenue- lack of walkability to amenities, and lower ranked schools within the Columbus district. As with any neighborhood, prospective residents must weigh the pros and cons according to their own lifestyles and needs. If one is a current Columbus resident looking to downsize, or a new family to Columbus looking to purchase their first home in an extremely difficult market to break into, North Linden does offer some opportunities that other neighborhoods do not.
Columbus has been growing steadily its entire existance. The past 10 years have seen its fastest growth ever, however. The city is attracting new residents not just from other parts of Ohio, but from across the United States and world. 50% of its overall growth is made up by either domestic migration or immigration from other nations.
There is now a steady stream of prospective residents in search for answers about the city and metro area. Hopefully, this post provides some of those desired answers.
Let’s look at some of the most common questions and attempt to provide the necessary information.
1. What are the most desirable places to live in Columbus? The answer to this question depends on what someone is searching for. For this question, we’ll base the answer on 5 categories- affordability, walkability, safety, schools and access to amenities. Based on these topics, here are the most-recommended urban neighborhoods.
Click on any neighborhood to find out more information.
1. The Short North, including Italian Village and Victorian Village Arguably the heart of Columbus’ urban core, the Short North is one of the most complete Midwest urban neighborhoods outside Chicago. While it has tons of amenities and walkability, a few potential negatives include the lack of parking and higher housing costs. 2. German Village and the Brewery District German Village is one of the largest historic districts in the United States. Its preserved 19th Century brick buildings and streets, walkable amenities and landscaped parks make it one of Columbus’ most uniquely beautiful neighborhoods. However, all that beauty can come with higher housing prices and very strict preservation rules. 3. Downtown and the Arena District The Downtown area, which includes the Arena District, is a rapidly growing area with tons of new housing and entertainment amenities. It is very walkable and the central hub of the city’s transit system. 4. Clintonville Located just north of the massive Ohio State Campus, Clintonville is a larger, more family-oriented neighborhood with quality housing and decent schools. 5. Merion Village, Schumacher Place, Franklinton, Weinland Park, Olde Towne East, Westgate and Old North Columbus These neighborhoods are for those who are okay with neighborhoods in transition. They are more affordable than the top 4, but also in various stages of revitalization. These neighborhoods provide some of the best long-term investment opportunities so long as you can look past some grit.
Based on the same criteria, here are the most-recommended suburbs.
1. Dublin This outer northwest suburb has a great mix of urban and suburban neighborhoods, with plenty of options for most tastes. Great schools and a one of the most diverse suburban populations make Dublin a popular choice. Negatives include a general lack of transit and higher housing costs. 2. Bexley Bexley is one of the oldest inner suburbs in the city. Its attractive older homes and beautiful tree-lined streets are right out of a John Hughes film. Great schools and walkable retail corridors make this suburb highly desirable. However, negatives include high property taxes and higher housing costs. 3. Grandview Heights Grandview is another more urban inner suburb with a great mix of quality housing stock and amenities. Schools are also very good. Negatives include a very tight housing market that make finding a home difficult, along with higher costs. 4. Upper Arlington This inner suburb is well known for its terrific schools and quality of life. It is more suburban in nature than other inner suburbs, and therefore a negative is its general lack of walkability to amenities. The cost of housing is generally higher. 5. Westerville Westerville is a northern, outer traditional suburb. Positives include a nice, walkable downtown area and much less expensive housing the other suburbs on the list.
This list of urban and suburban places is just a starter list and is not to be limiting.
2. What are the best ways to find somewhere to live? Beyond going with a realtor or doing internet searches, the best way to find somewhere to live is to visit your preferred neighborhood. Some house and apartments may not be advertised online, specifically those sales being managed by the owner. Another potential way is to visit local neighborhood social media sites to see if anyone has advertised their home or apartment. With the extremely fast-moving Columbus market, thinking outside the box can be beneficial.
4. Where can I find more information about the city and its quality of life? For many more links on Columbus activities, local government, schools and much more, check out the Columbus Links and Resources