Part 2 is now available for more great before and after comparisons.
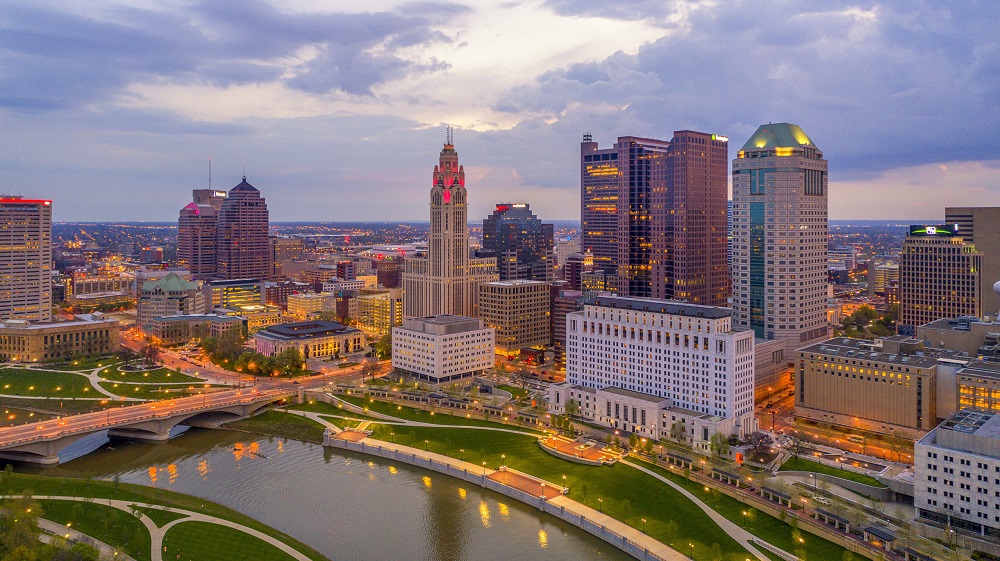
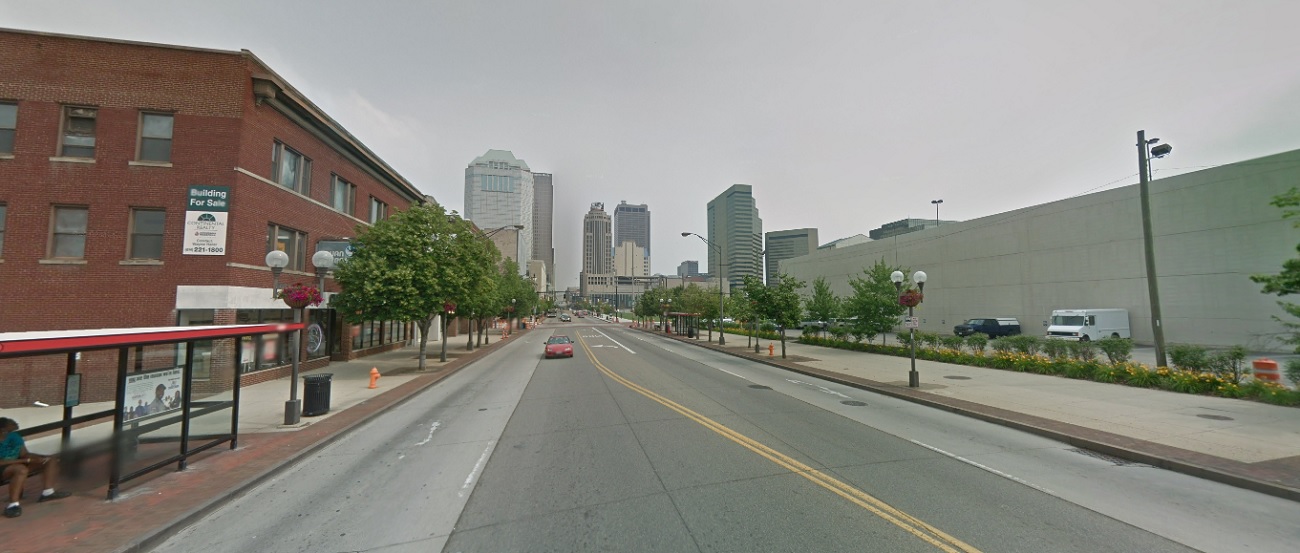
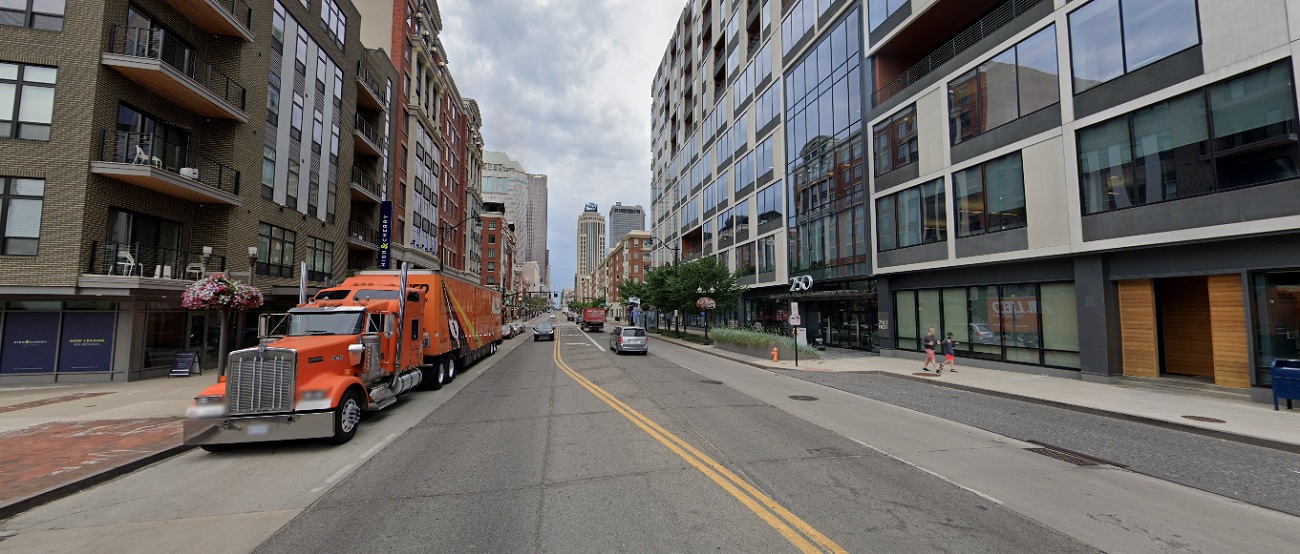
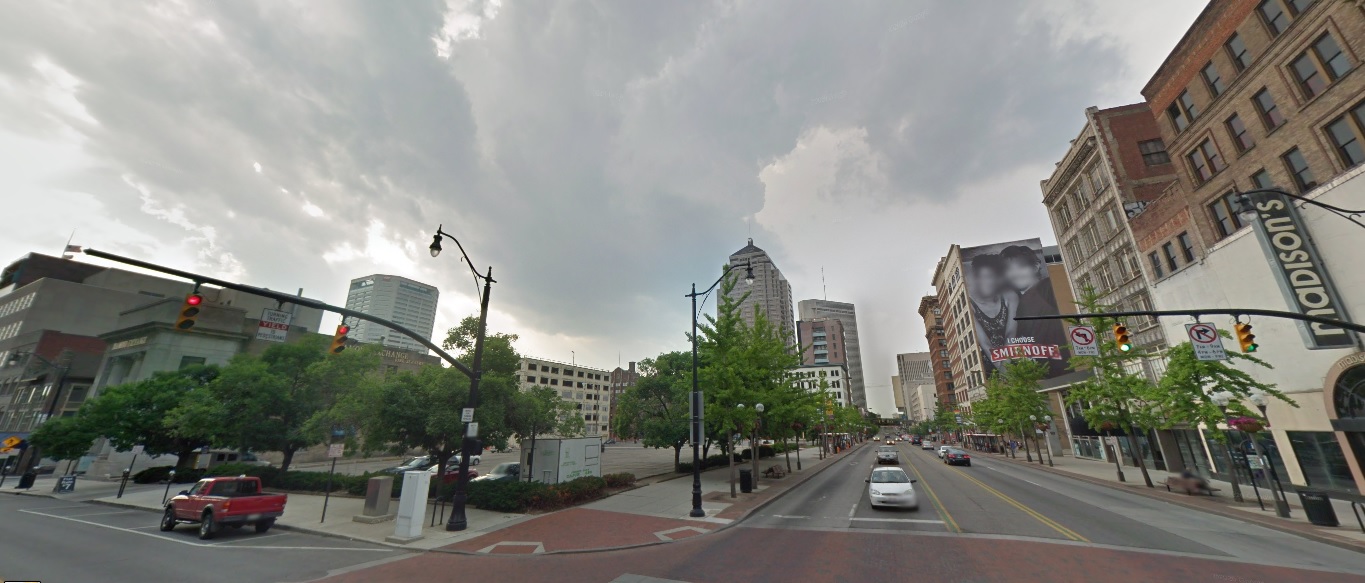
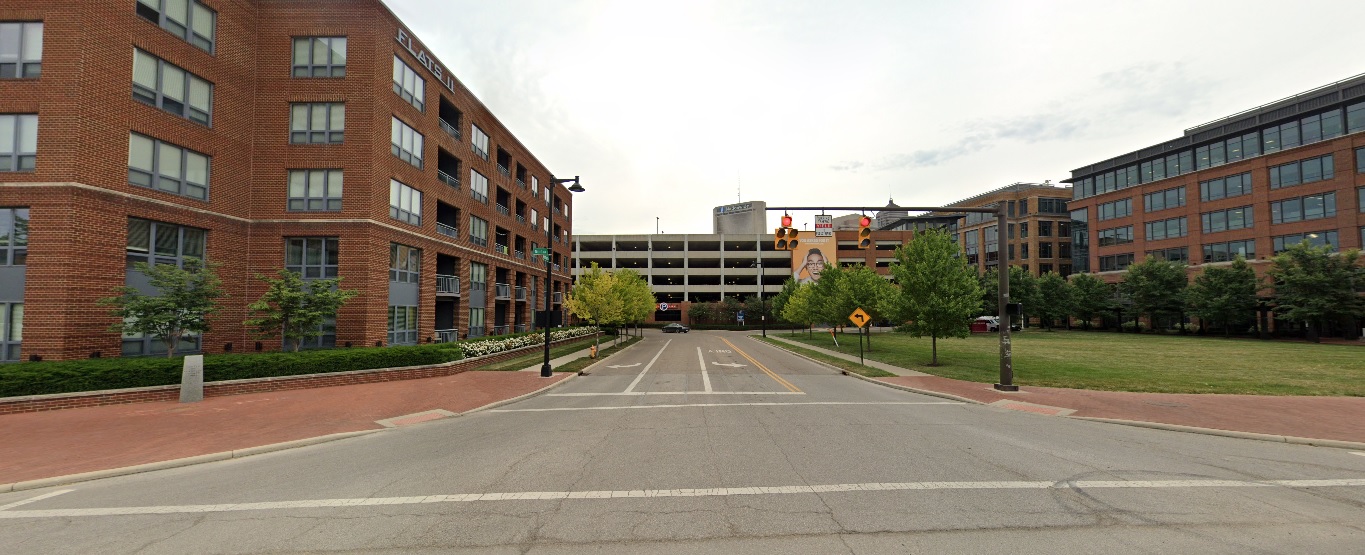
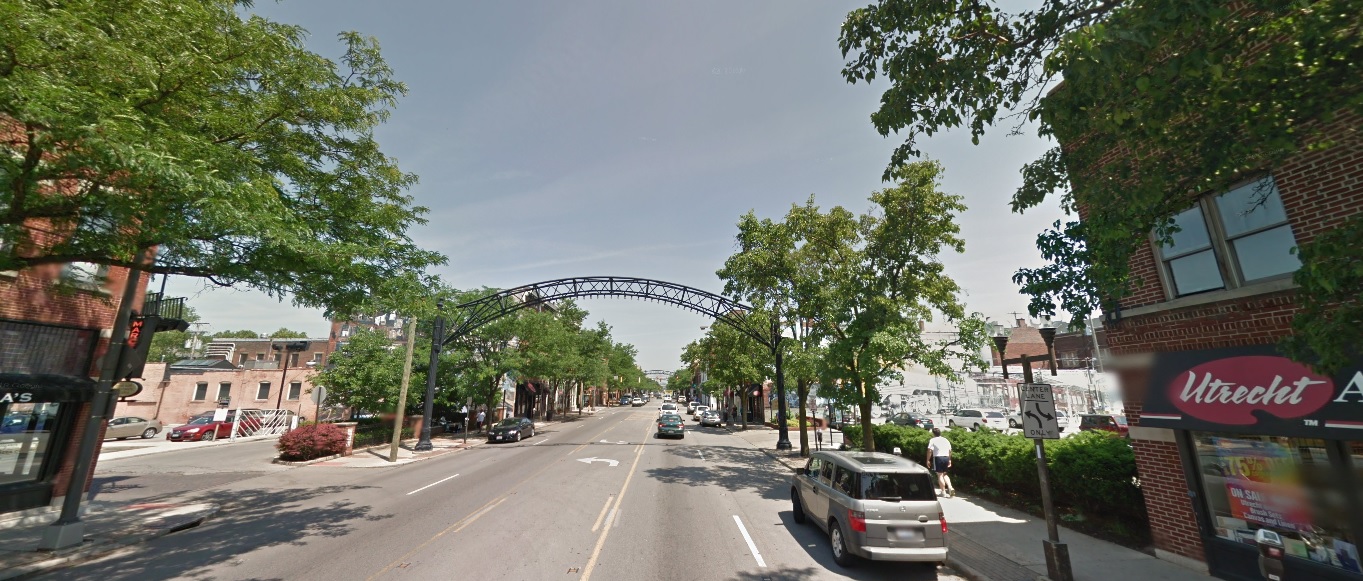
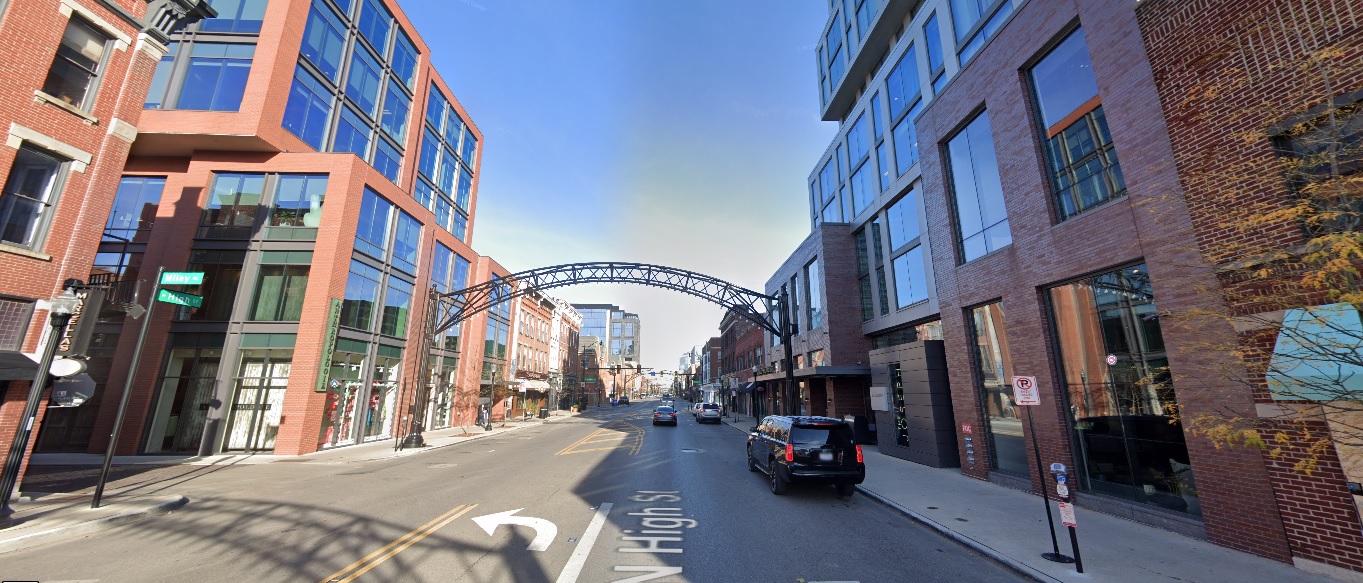
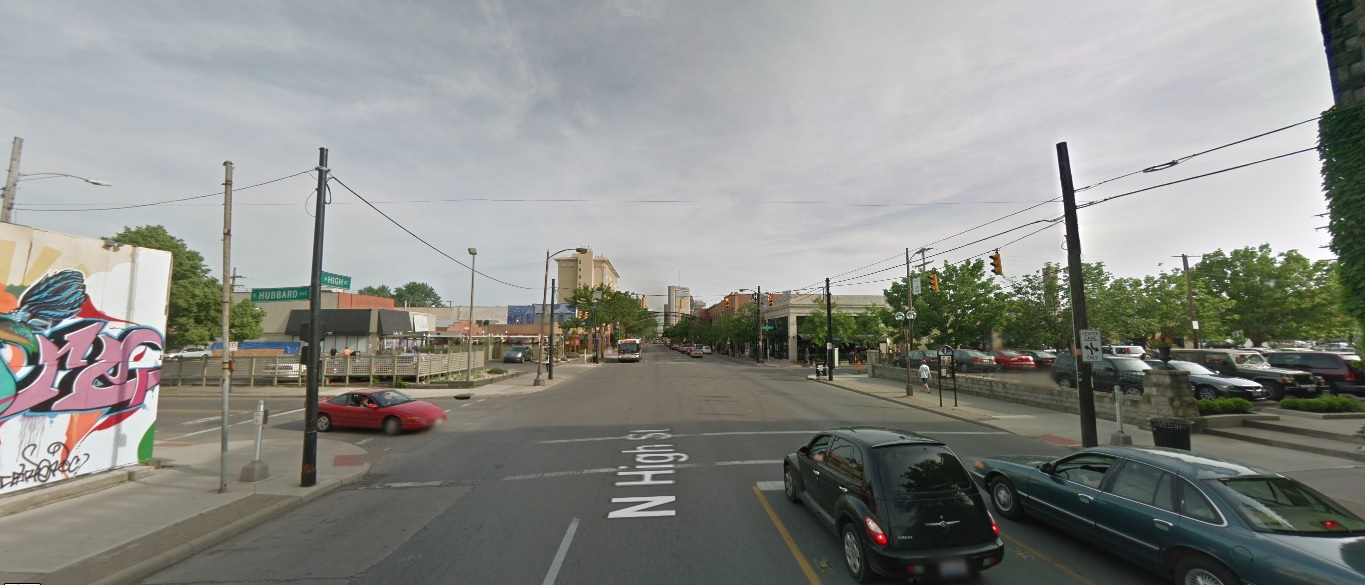
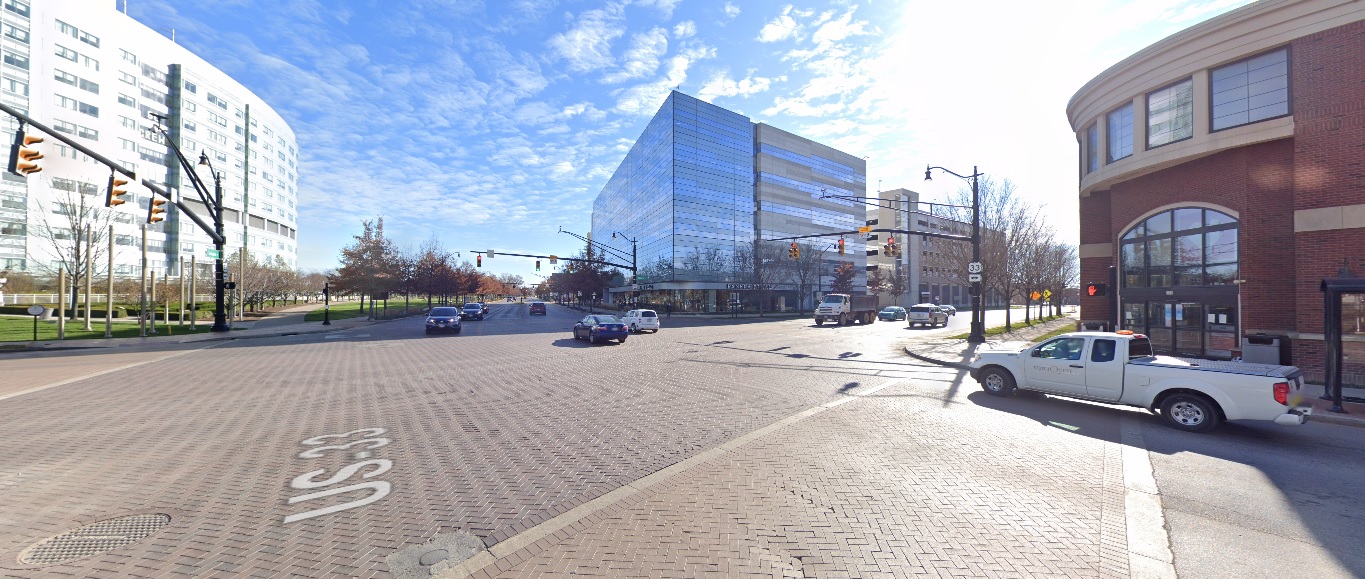
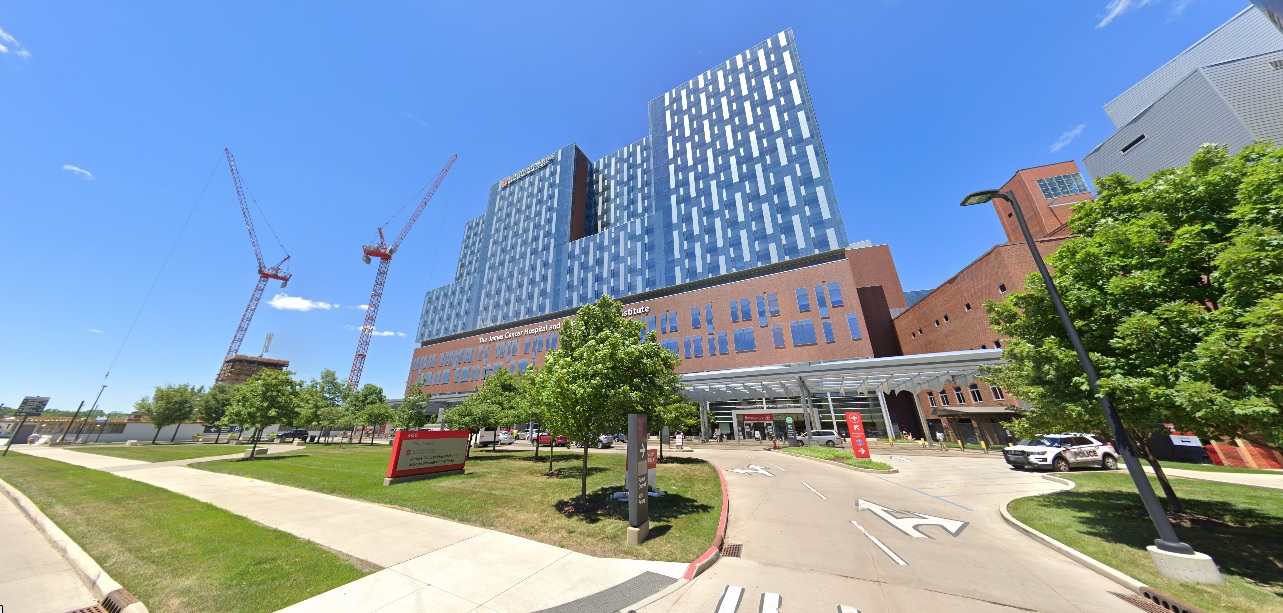
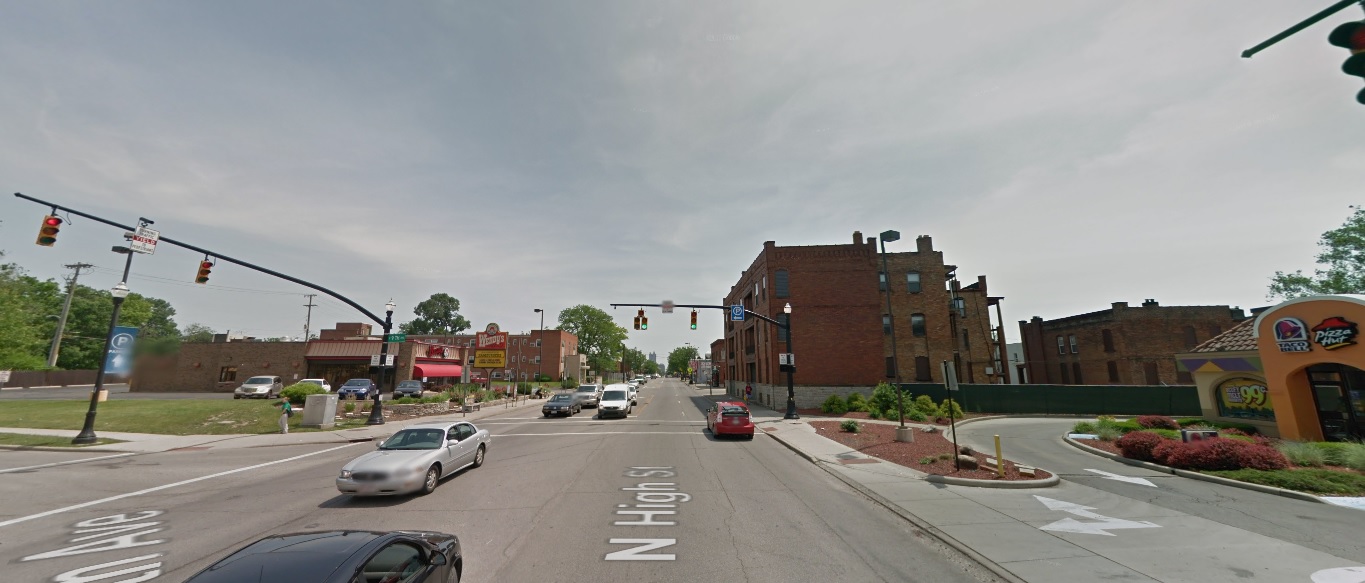
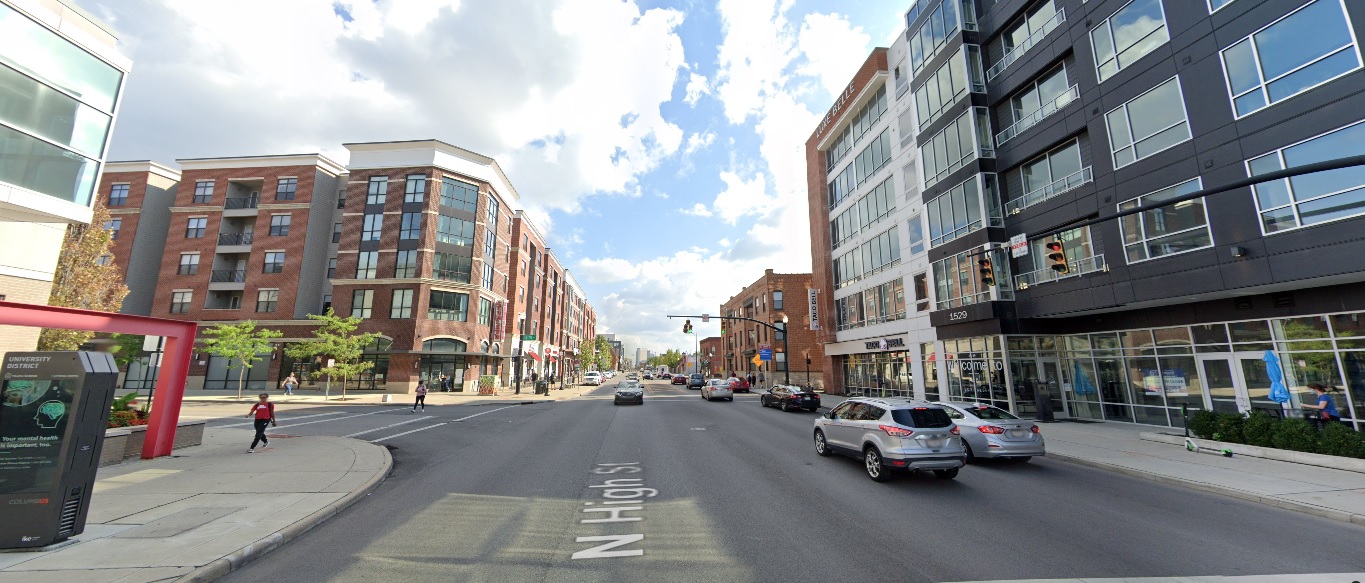
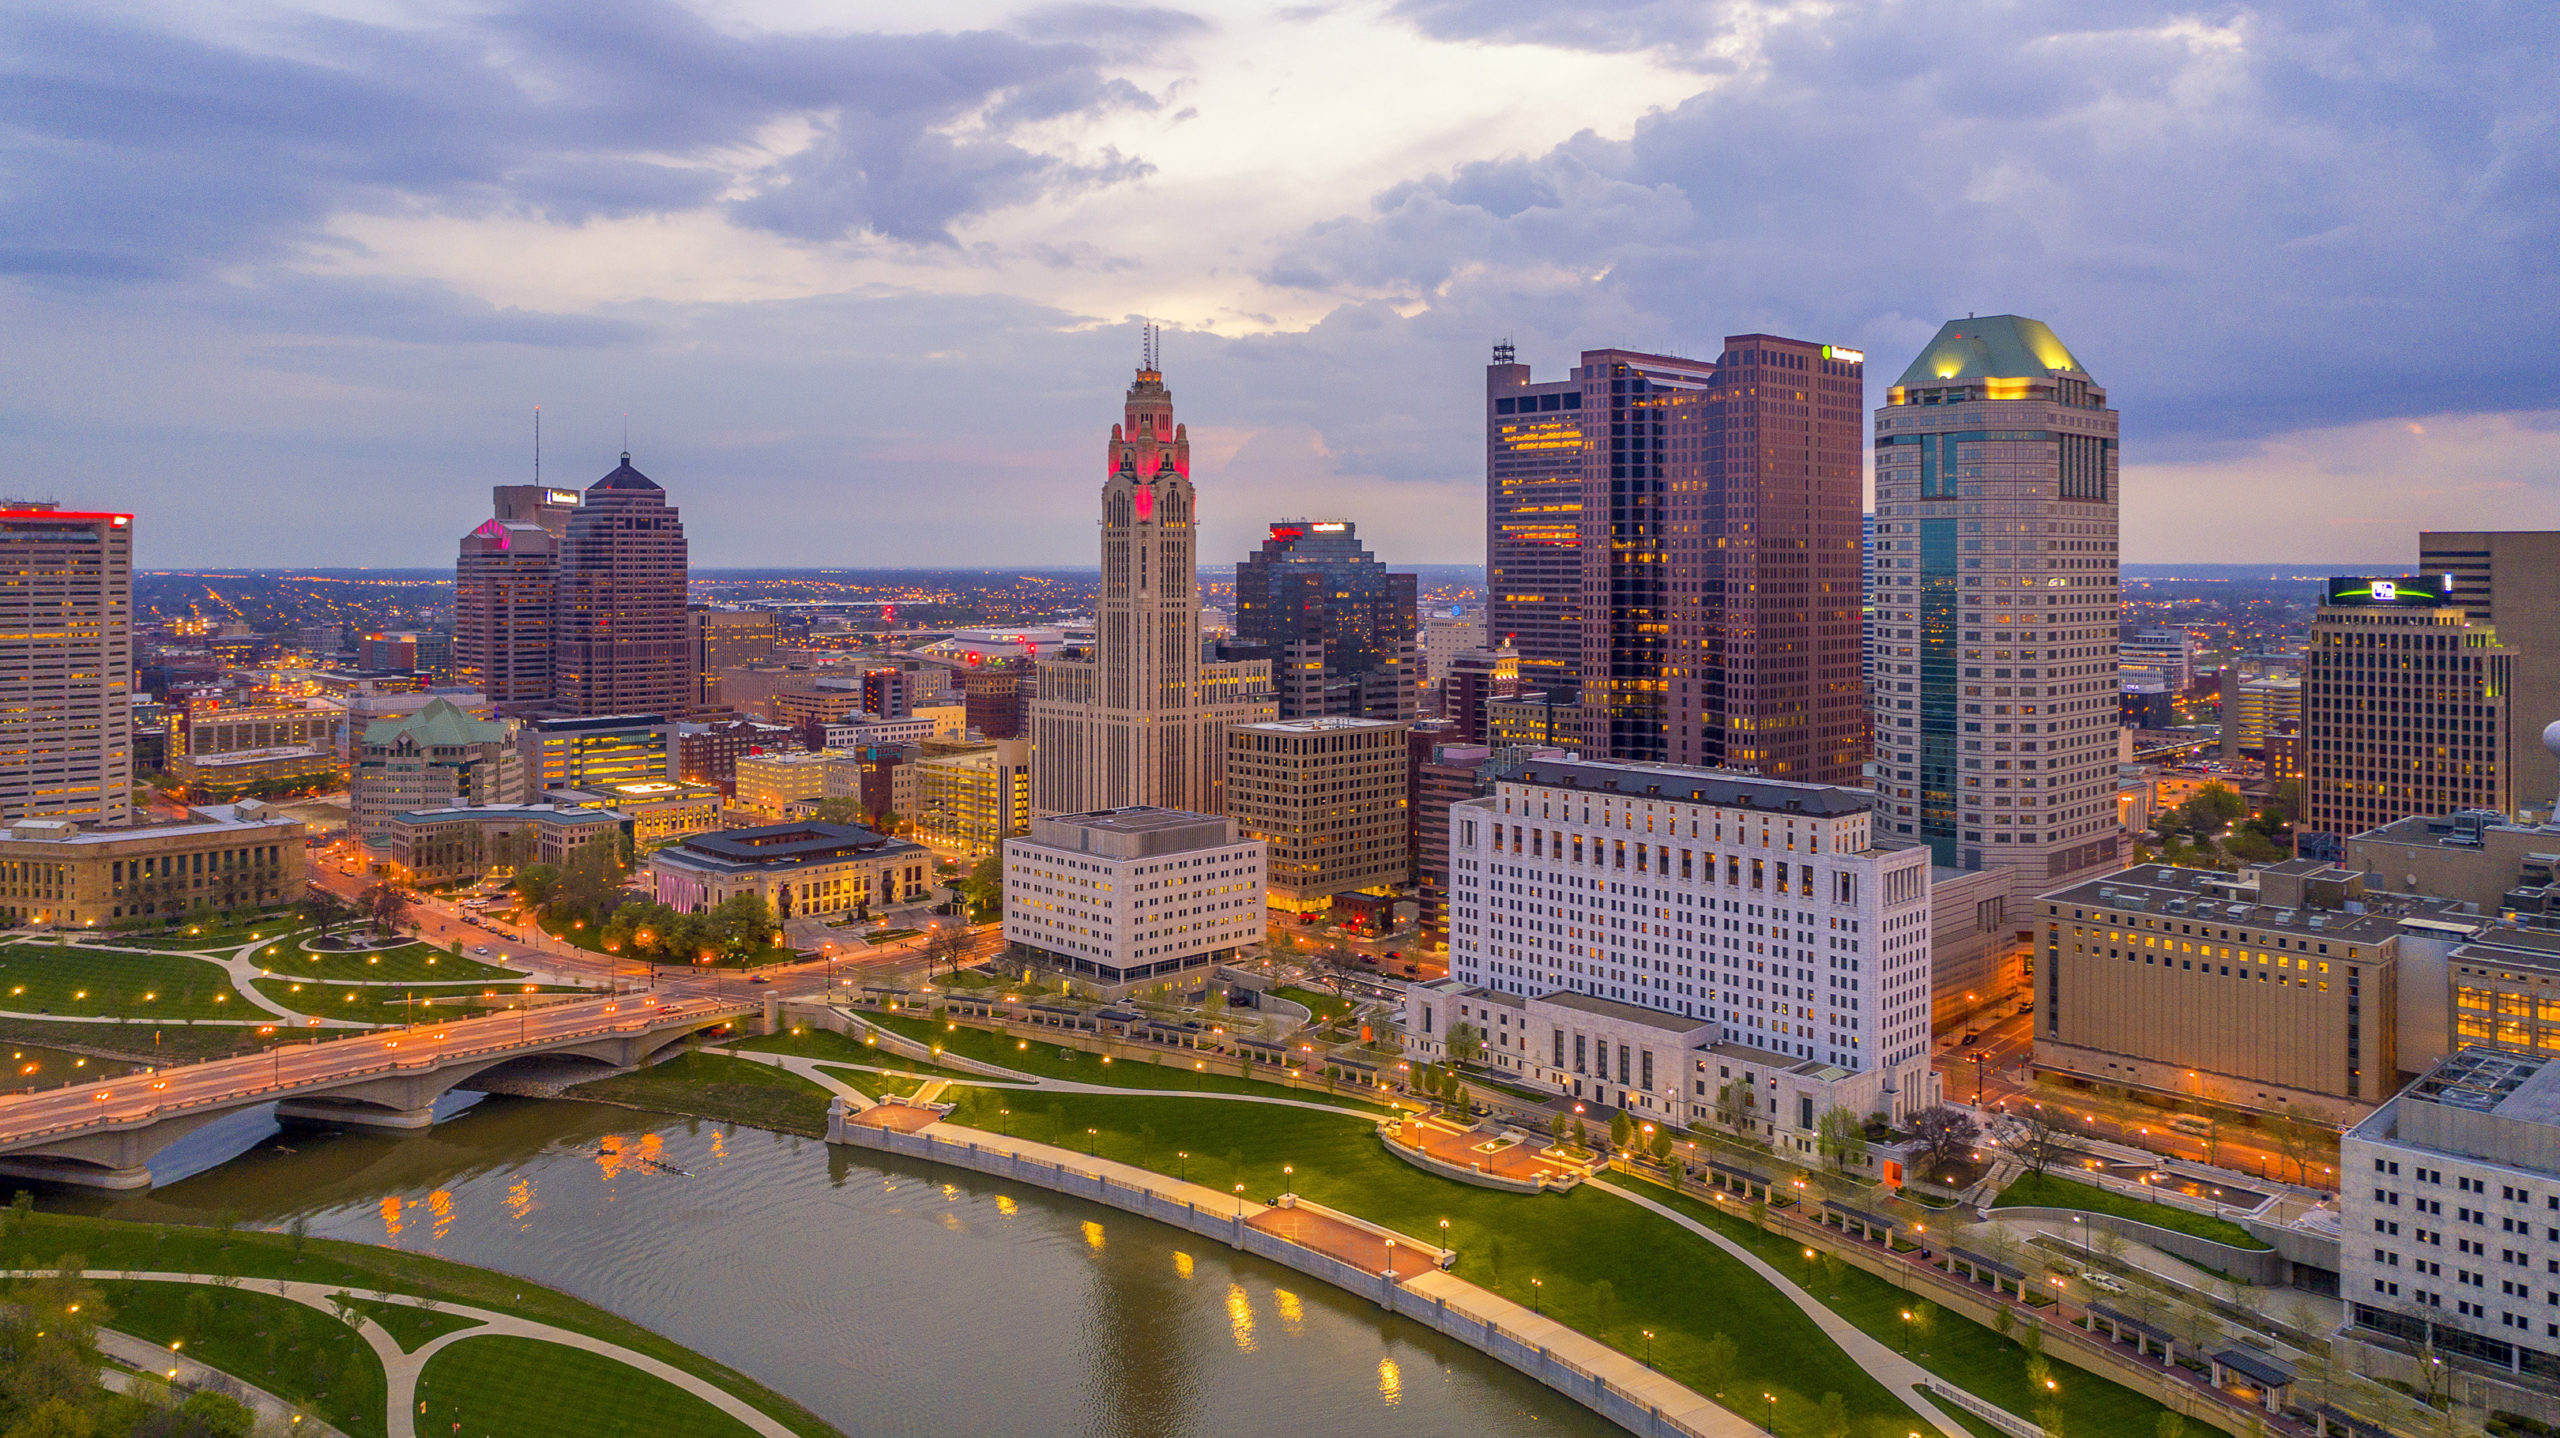
How Columbus has changed in 10 years is not always easily quantifiable. Columbus added more people in the past decade than during any previous similar period in its history. I’ve posted a lot about the 2020 Census data and updated many pages worth of information to the site. However, examining only population change through numbers is just one part of the story. How has that population growth manifested in terms of how the city appears in its built environment? This before and after look shows how the city has been transformed on a visual scale, and shows how some of the hottest neighborhoods have been radically altered in a short time.
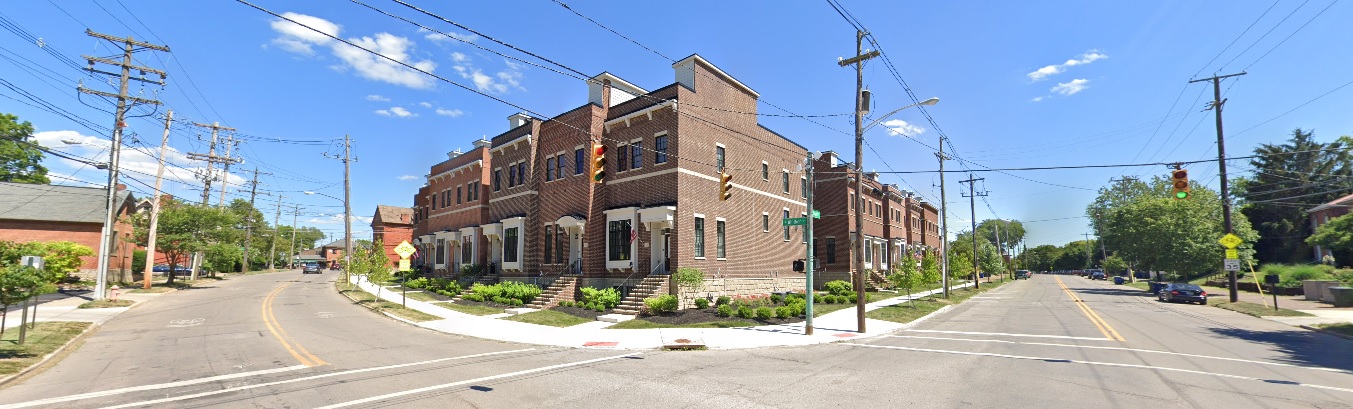
Downtown High Street, looking north from Rich Street Before: 2011 After: 2021 High Street, looking north from Gay Street Before: 2011 After: 2021
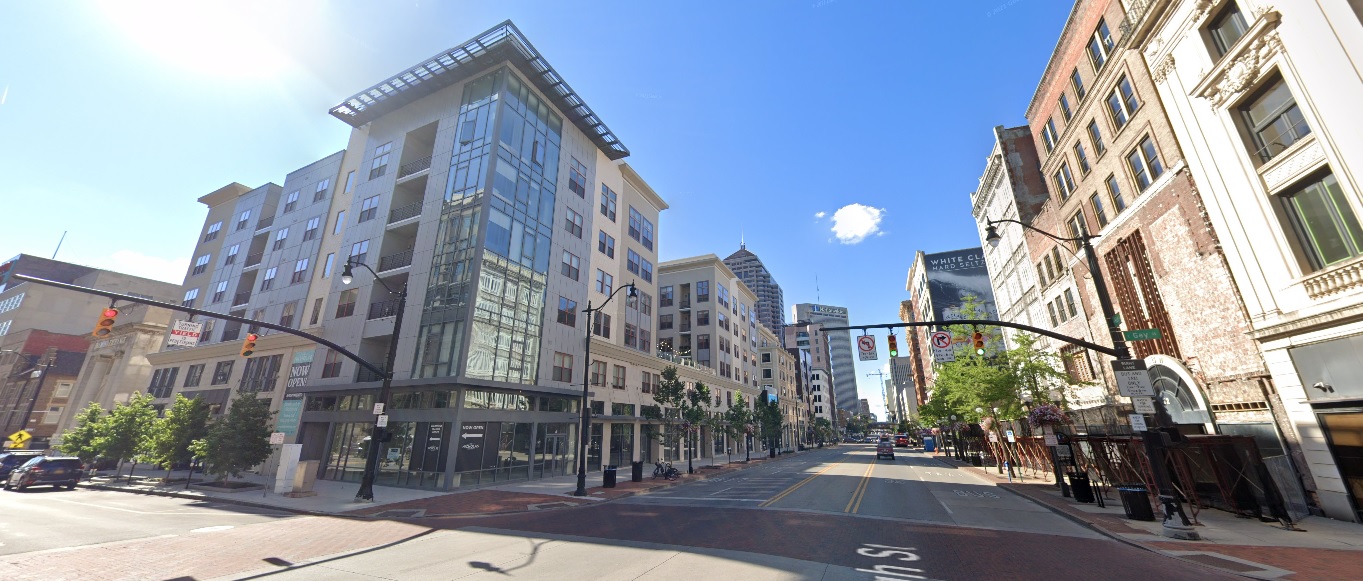
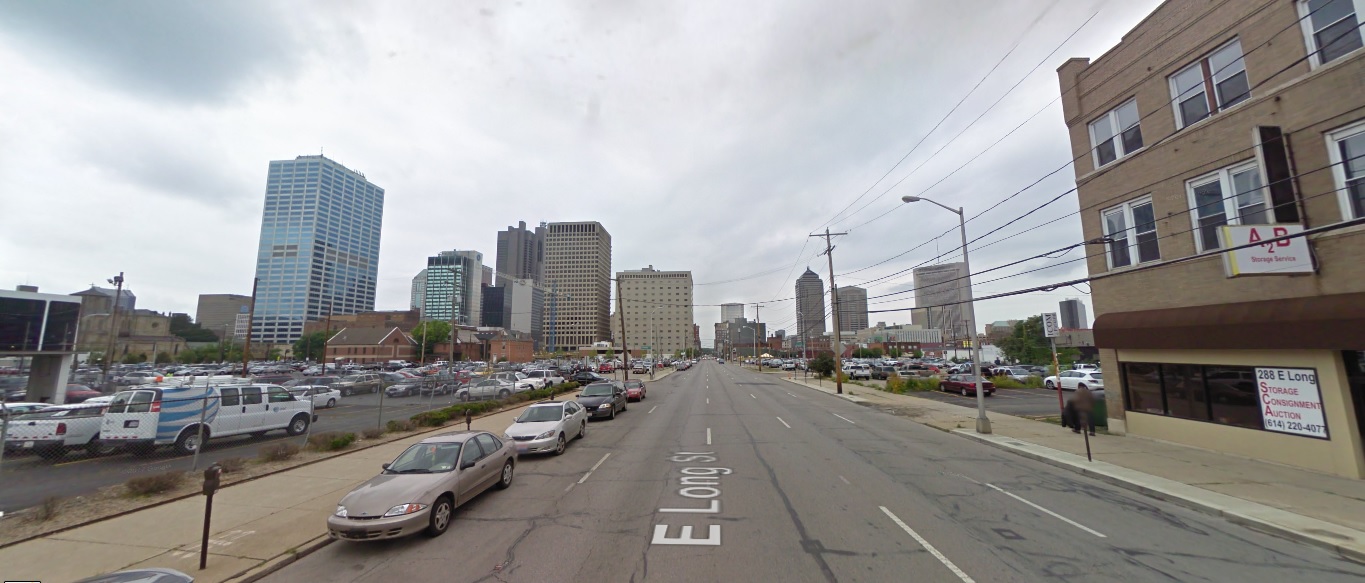
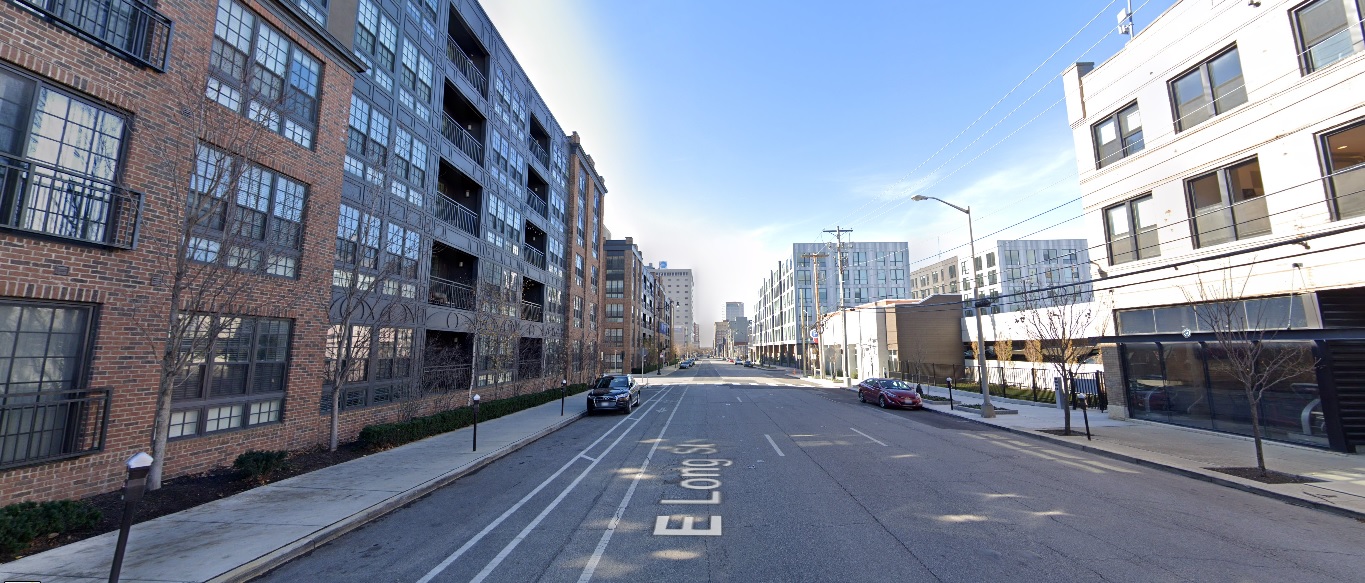
Long Street, looking east from 6th Street Before: 2011 After: 2020
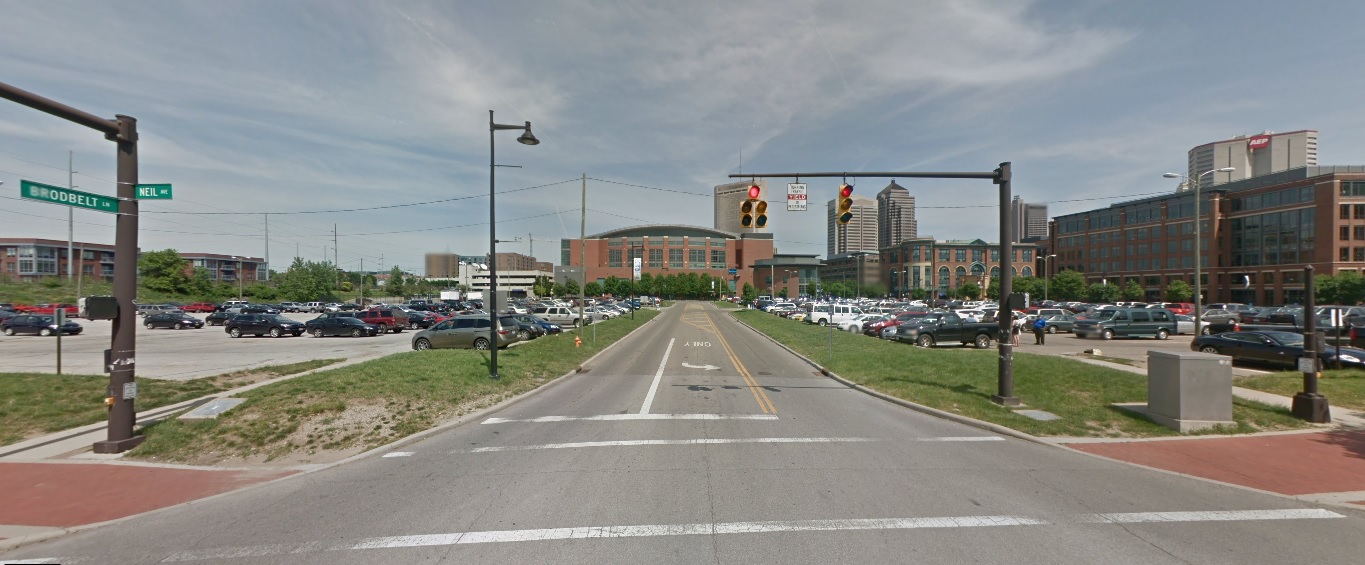
Neil Avenue, looking east at Broadbelt Lane Before: 2011 After: 2021
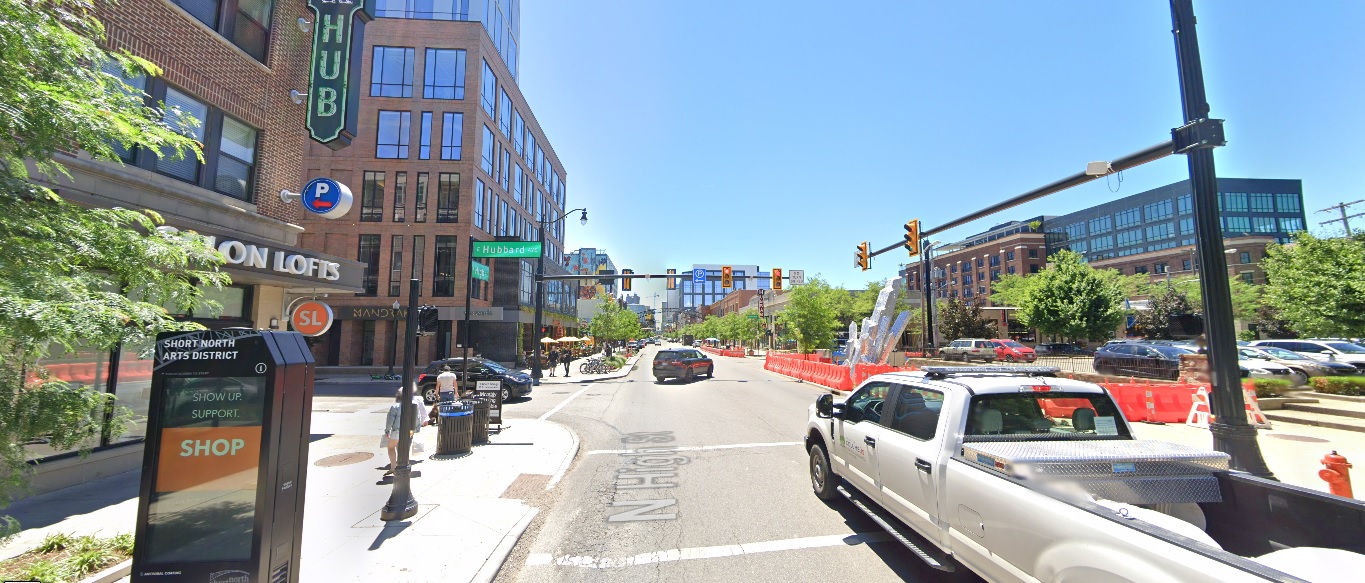
The Short North High Street, looking north from Milay Alley Before: 2011 After: 2020
High Street, looking south from Buttles Avenue Before: 2011 After: 2021
Fourth Street, looking east at Auden Avenue Before: 2011 Before: 2021
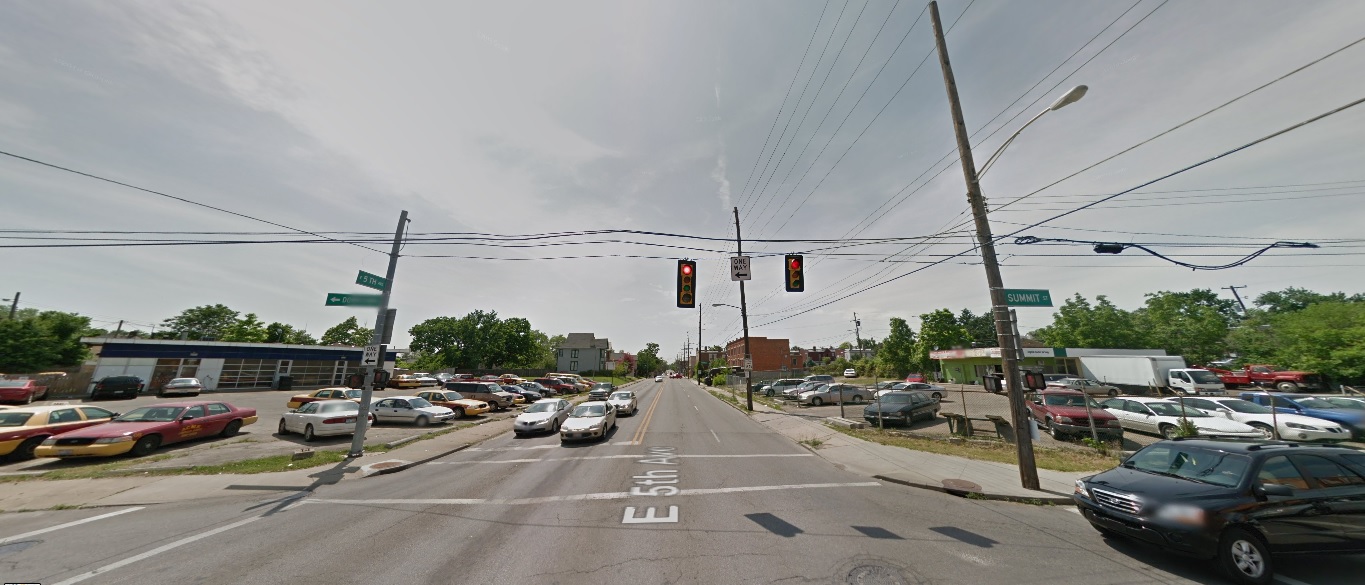
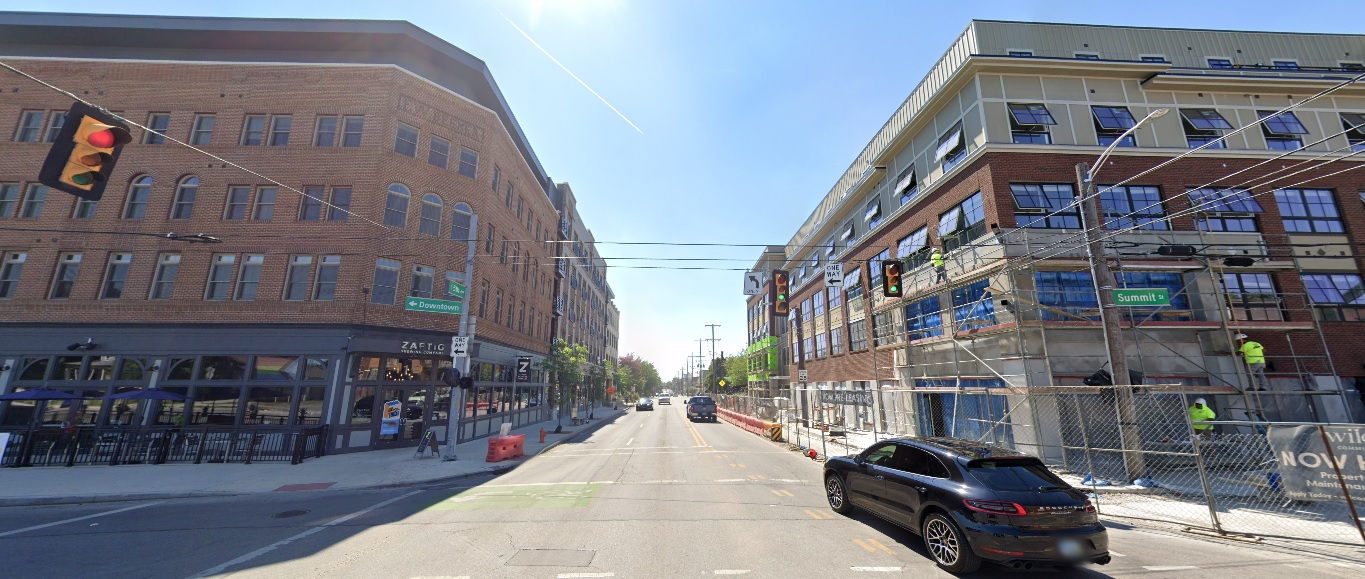
Summit Street, looking west at 5th Avenue Before: 2011 After: 2021
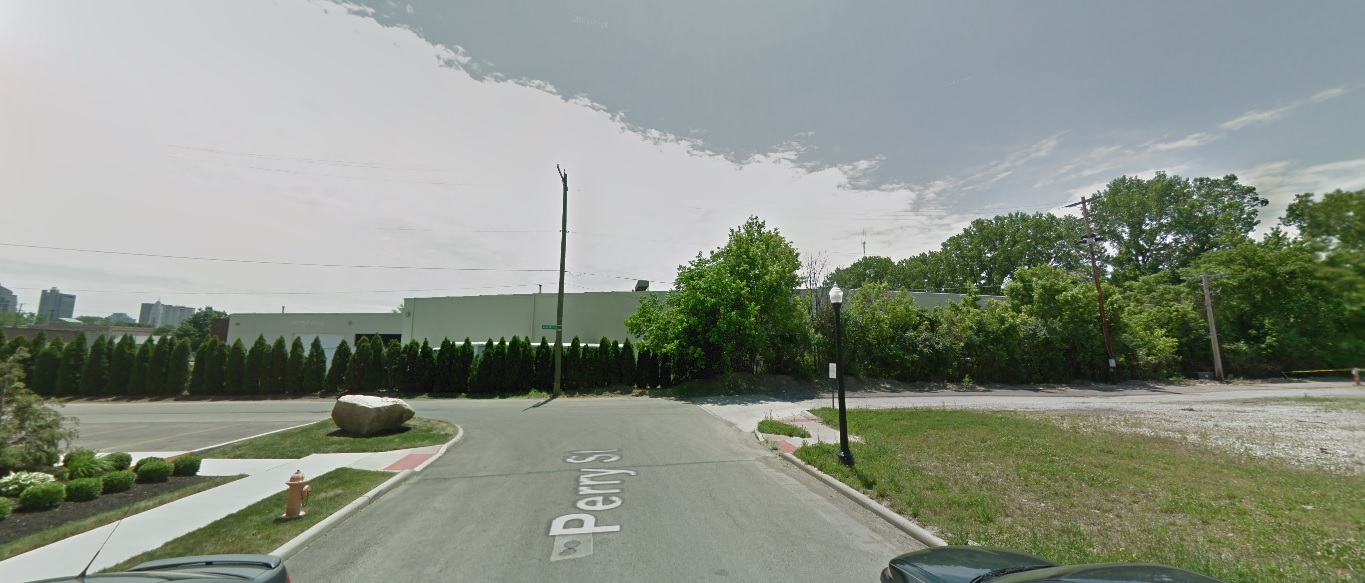
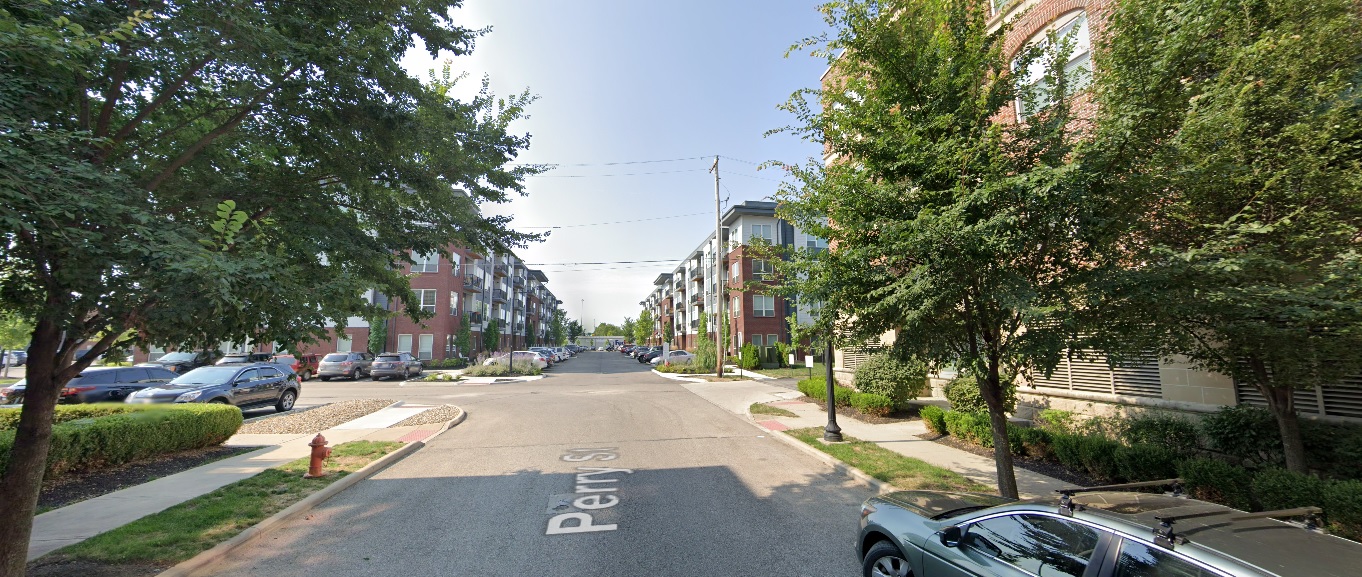
Perry Street, looking south at Quality Place Before: 2011 After: 2021
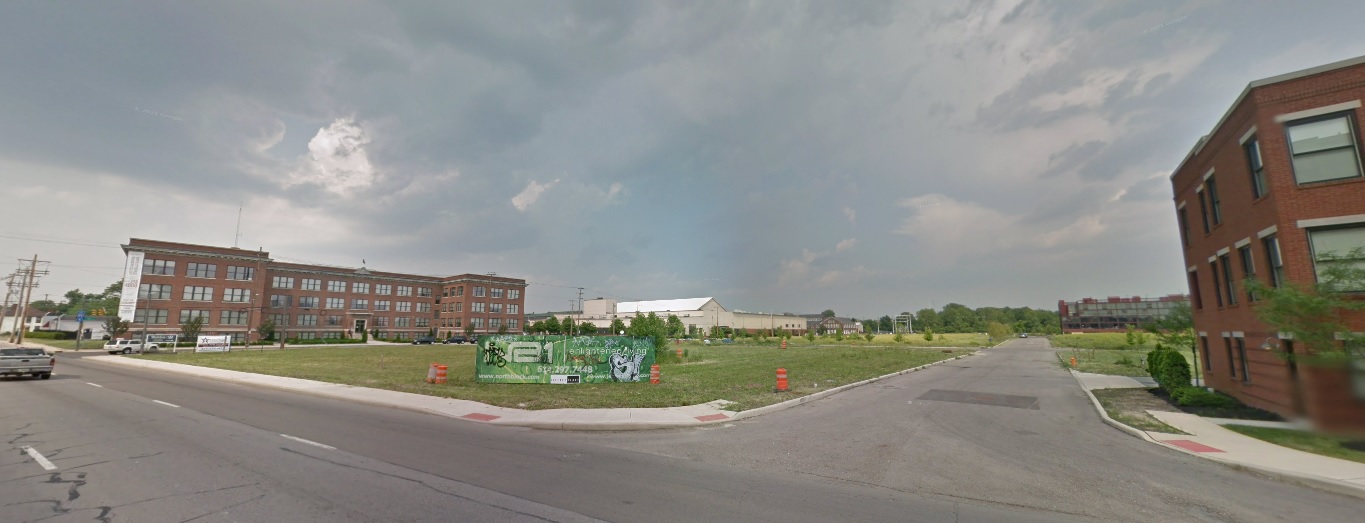
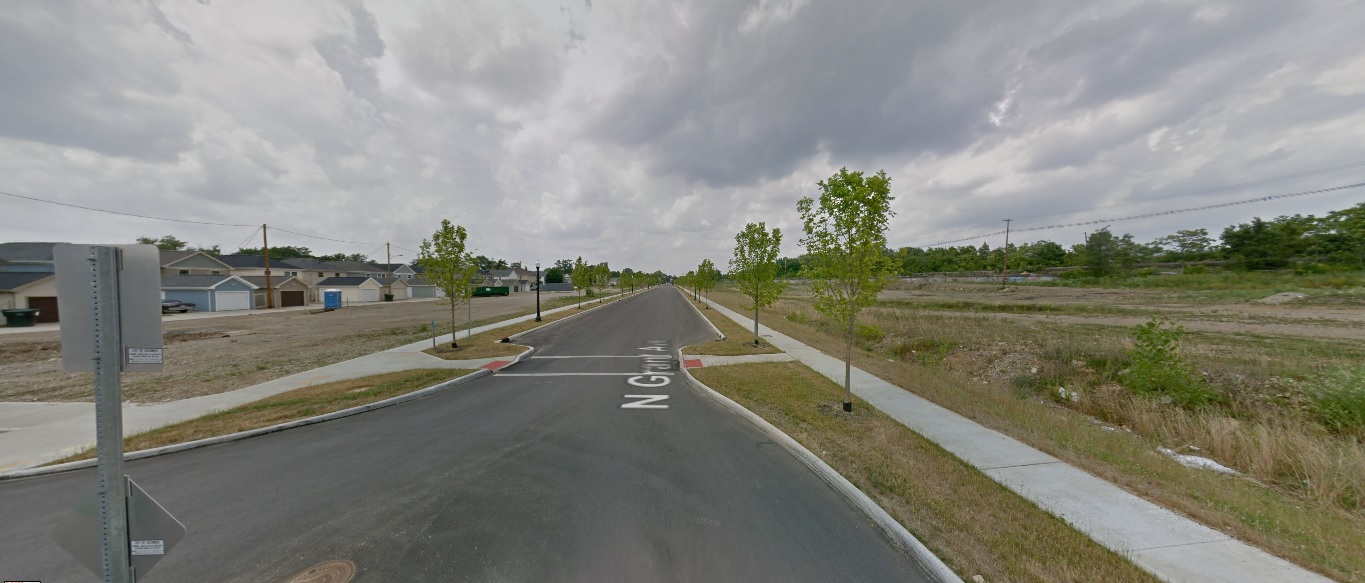
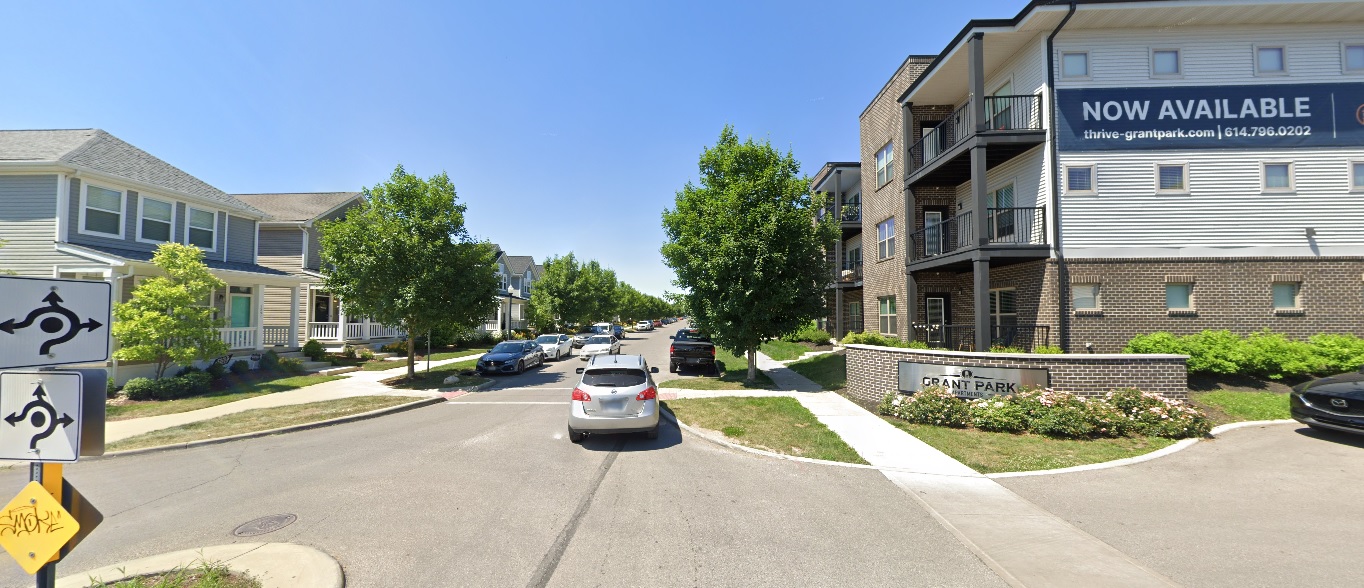
Weinland Park Grant Avenue, looking north from 7th Avenue Before: 2012 After: 2021
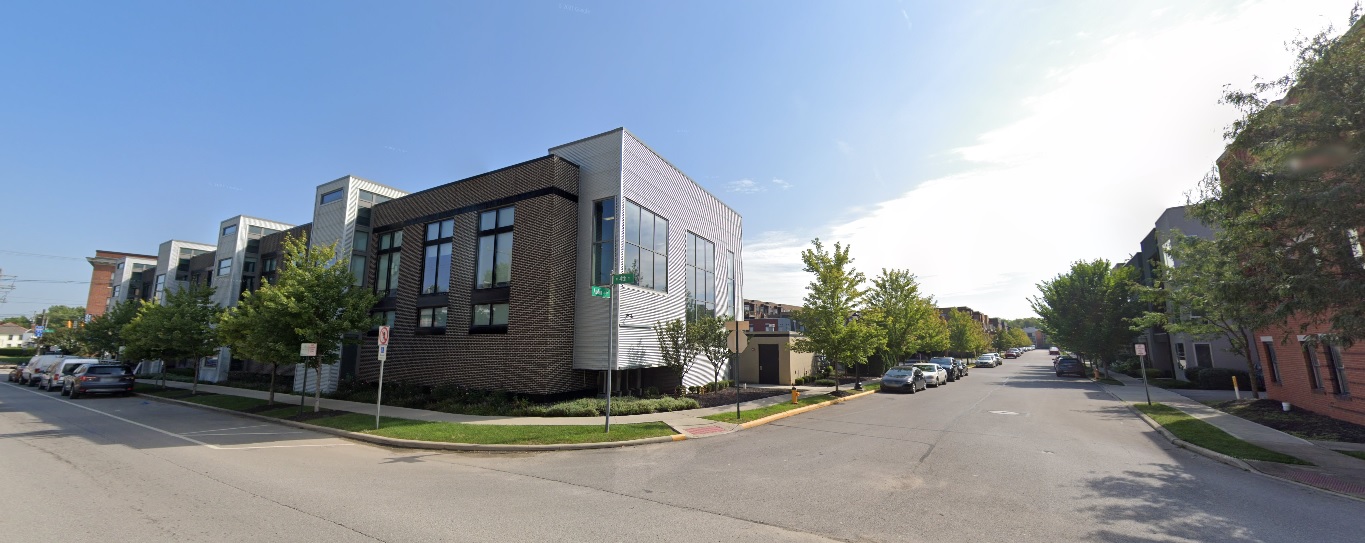
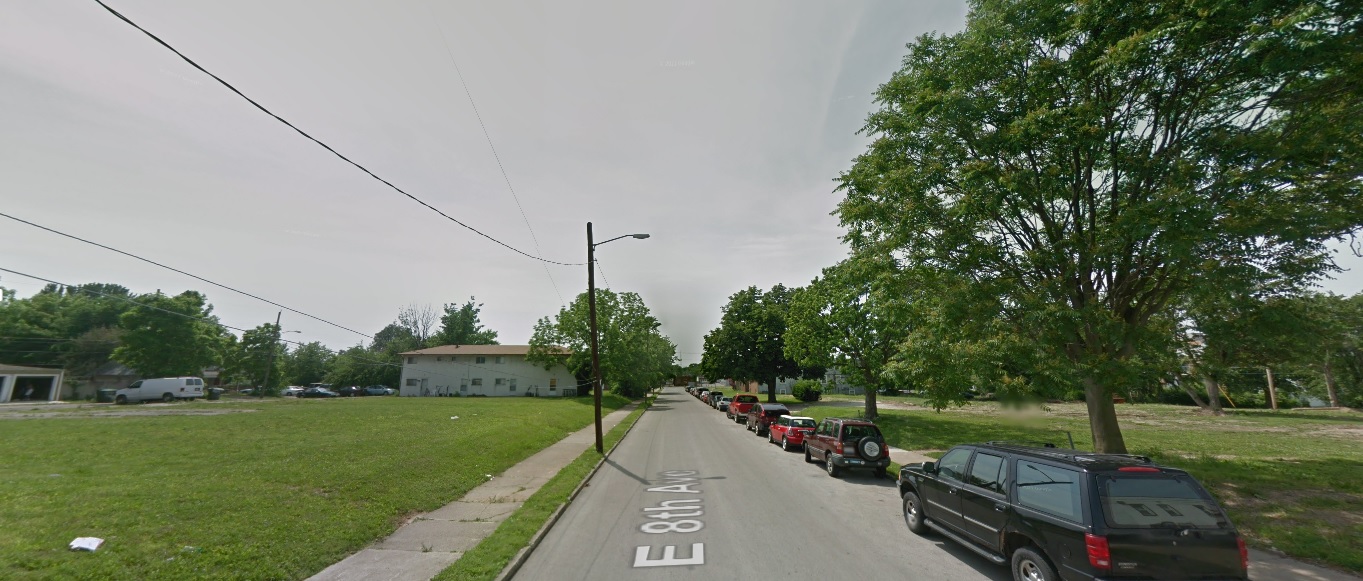
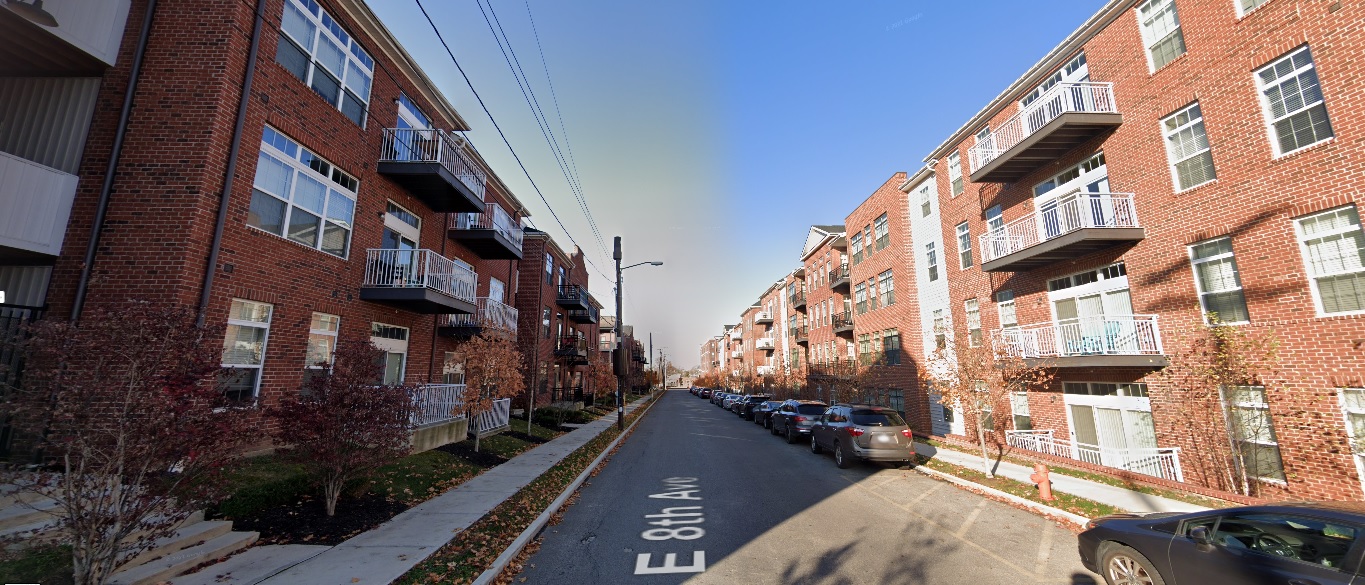
Eighth Avenue, looking west from Section Alley Before: 2011 After: 2020
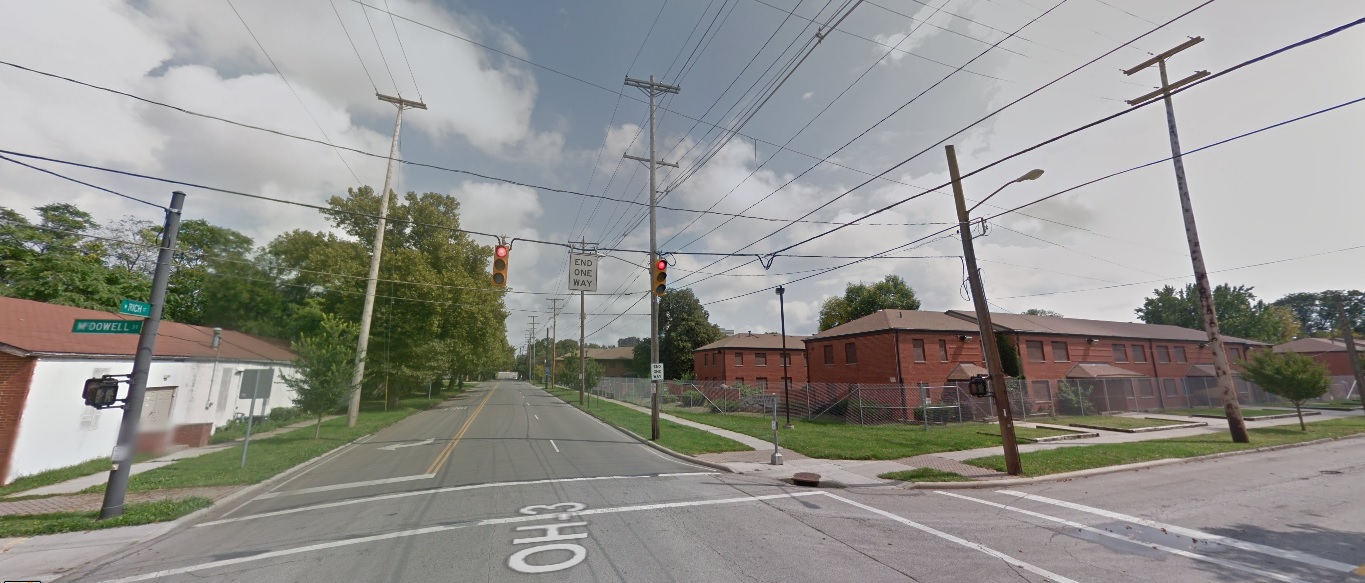
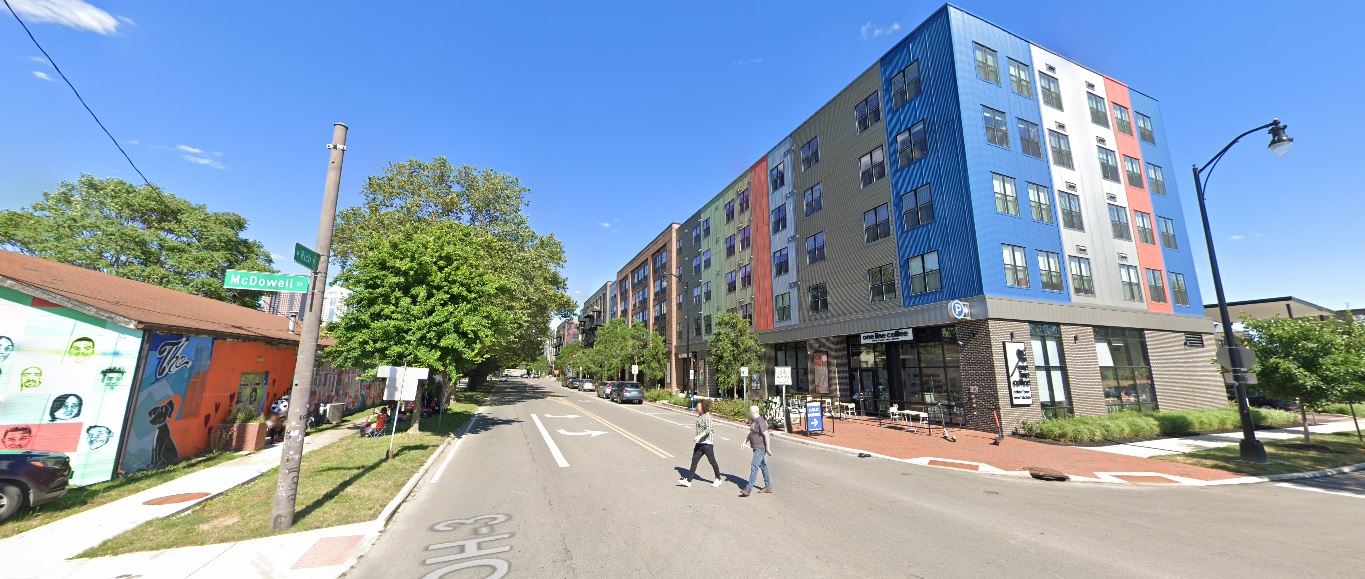
Franklinton Rich Street, looking east from McDowell Street Before: 2011 After: 2021
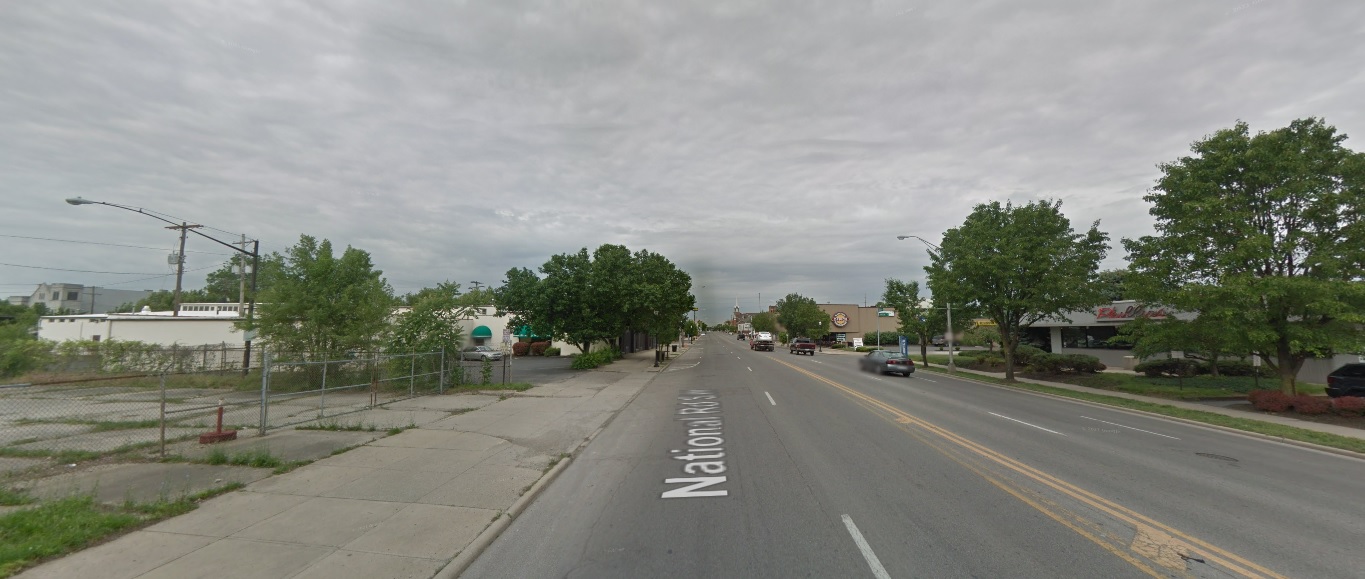
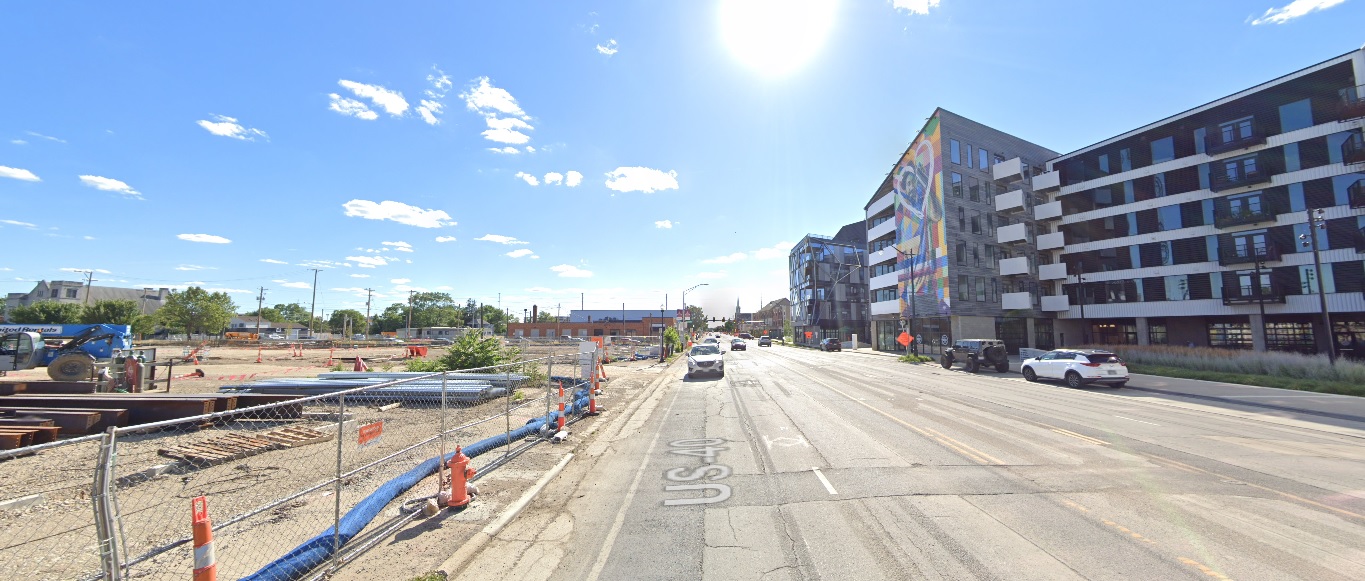
Broad Street, looking west from the railroad tracks. Before: 2011 After: 2021
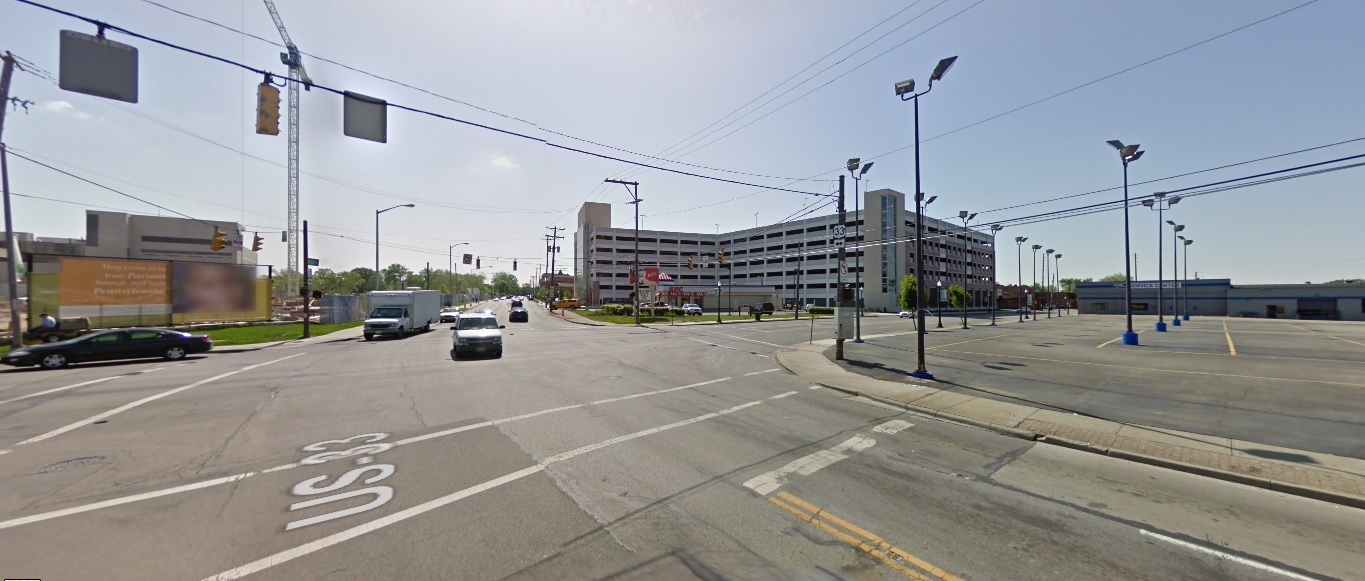
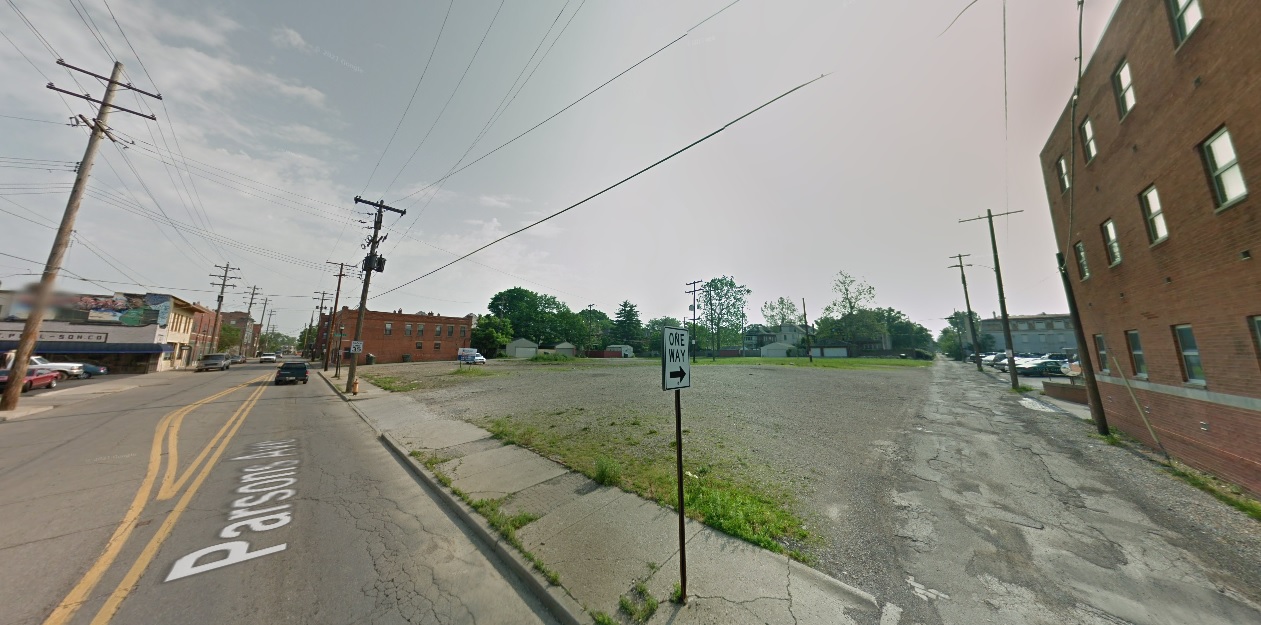
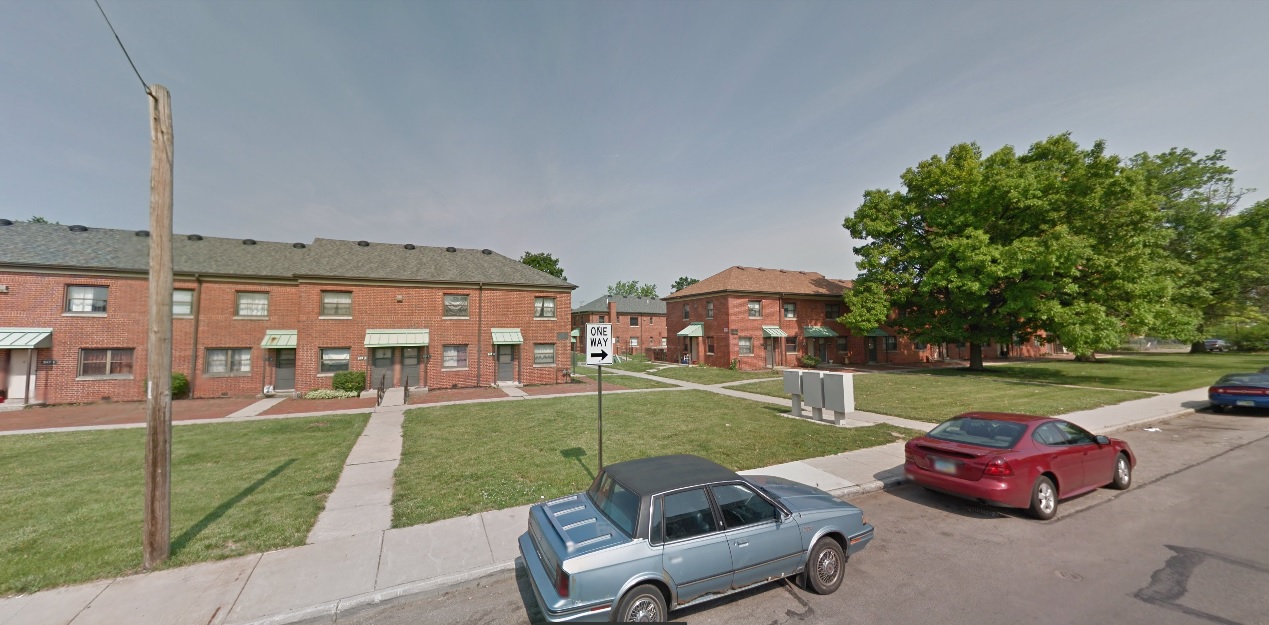
South Side Livingston Avenue, looking east at Parsons Avenue Before: 2009 After: 2020
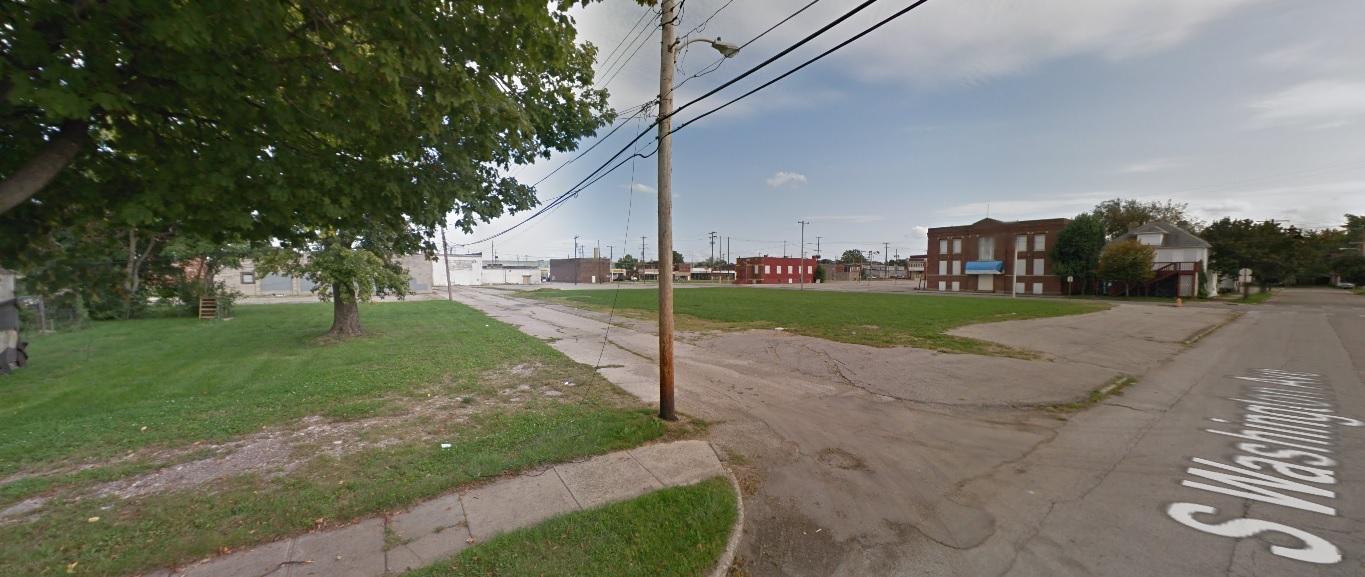
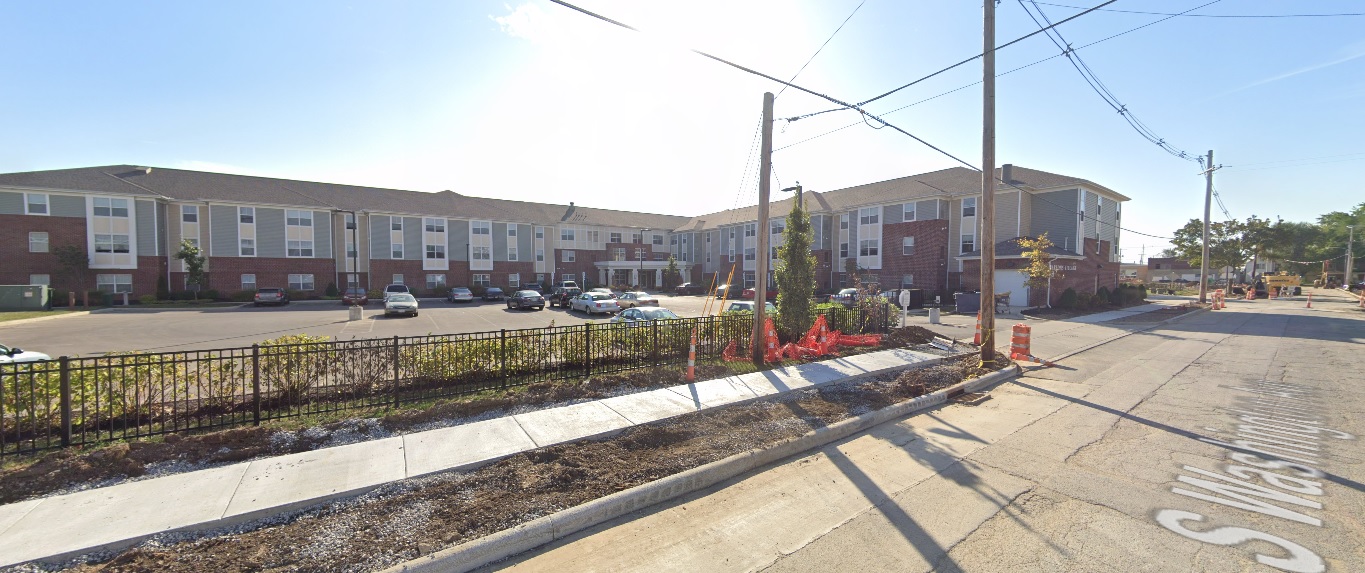
Washington Avenue, looking southeast from Innis Avenue Before: 2011 After: 2020
Front Street, looking south at Whittier Street Before: 2011 After: 2021
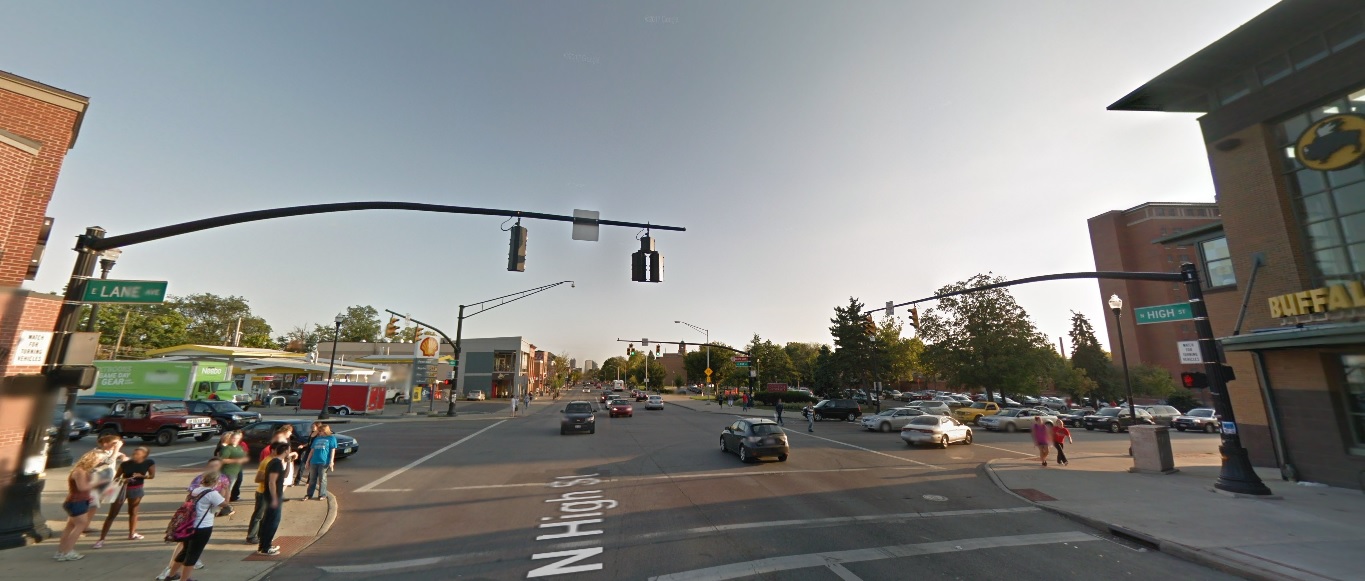
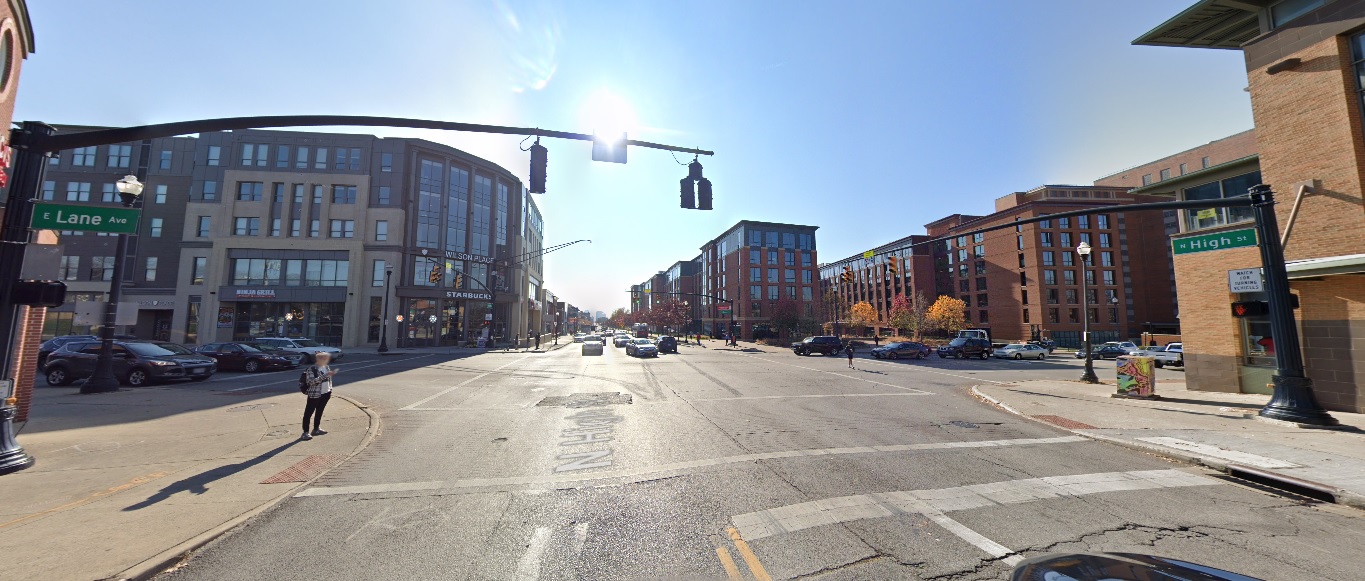
Campus High Street, looking south from Lane Avenue Before: 2011 After: 2020
High Street, looking south from 8th Avenue Before: 2011 After: 2021
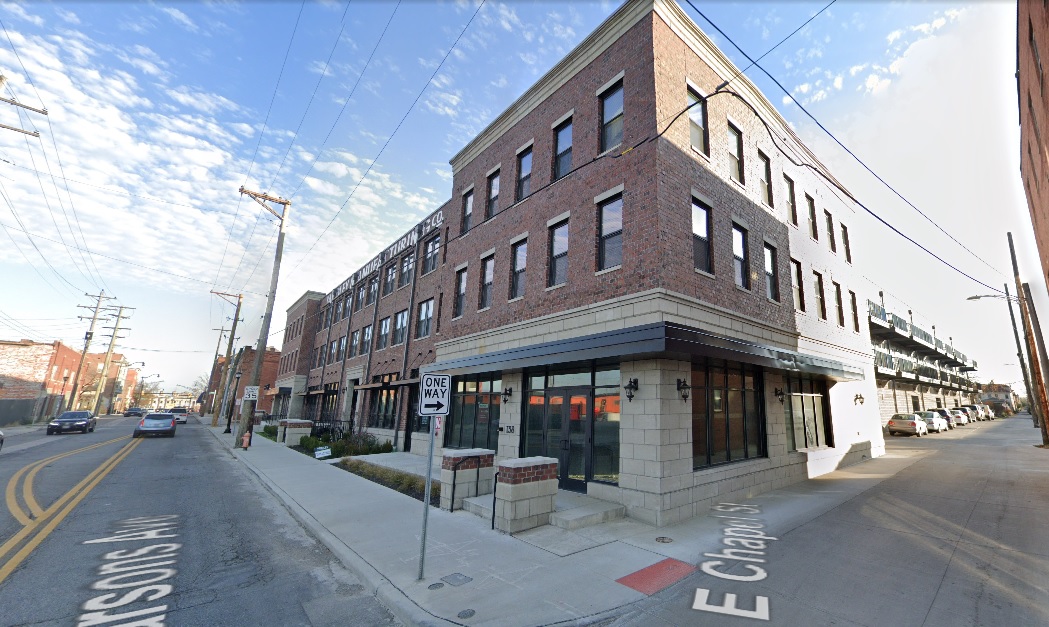
West Side Parsons Avenue, looking northeast from Chapel Street Before: 2011 After: 2020
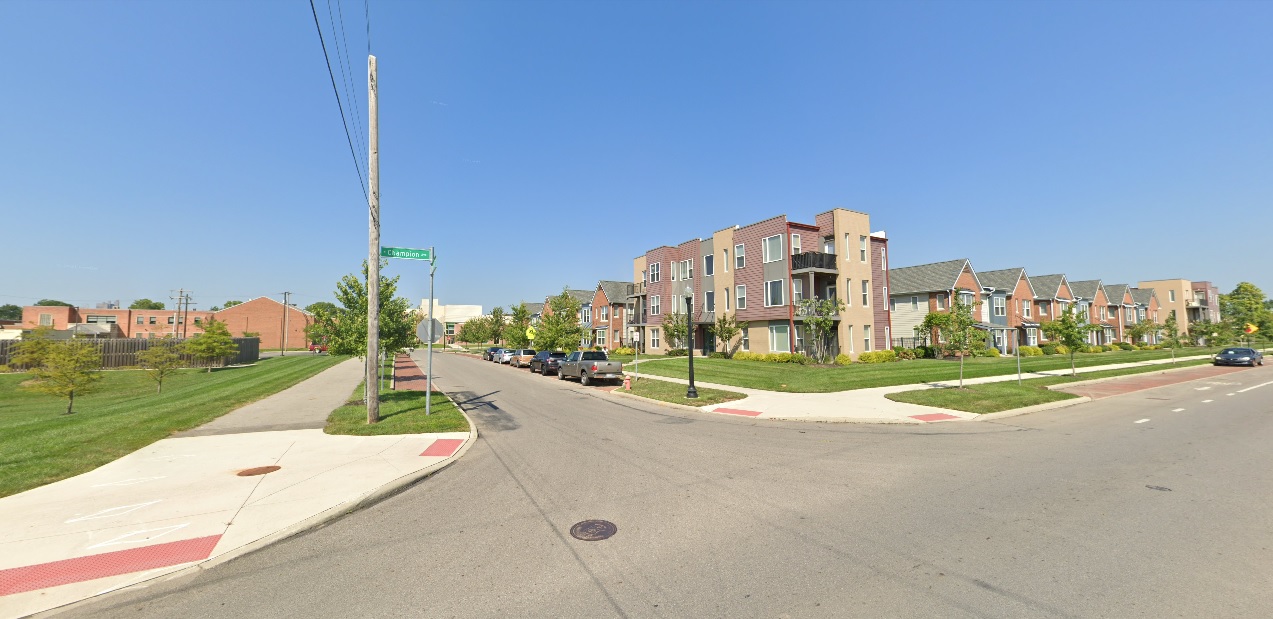
Champion Avenue, looking northwest at Phale D. Hale Drive Before: 2011 After: 2021
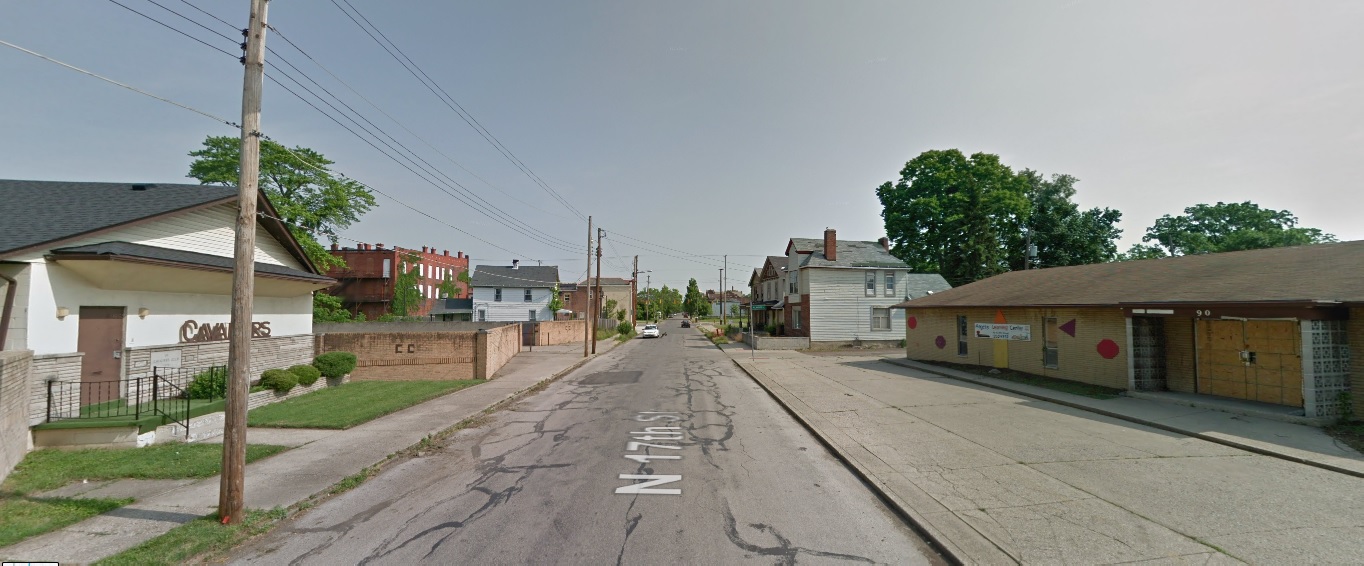
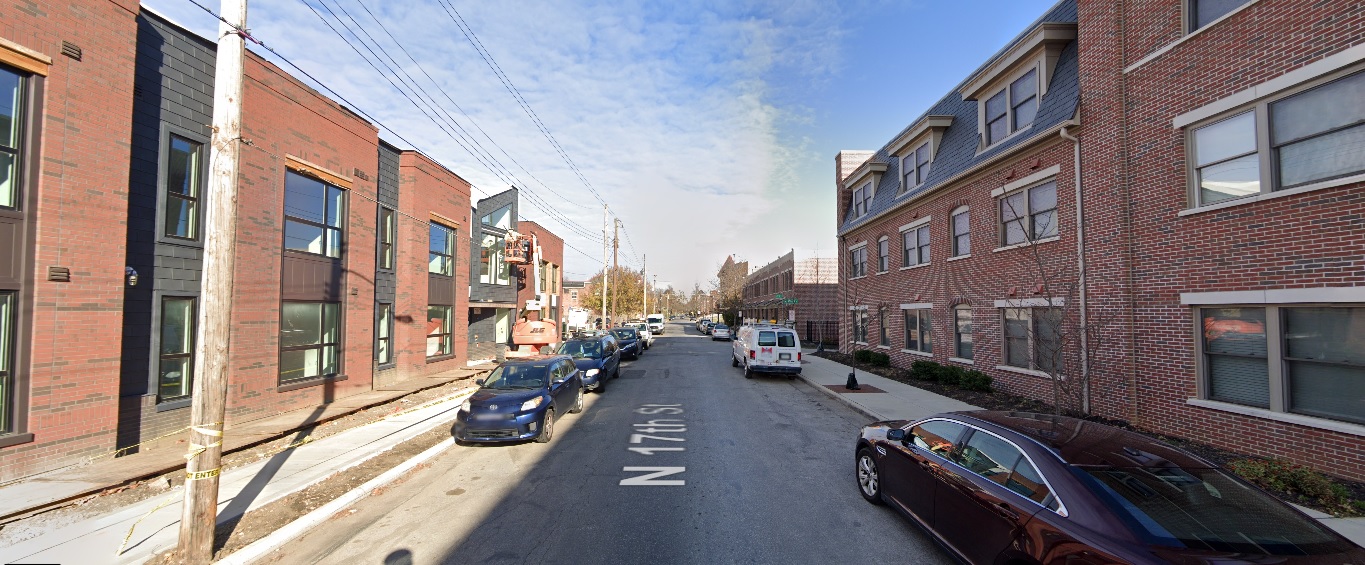
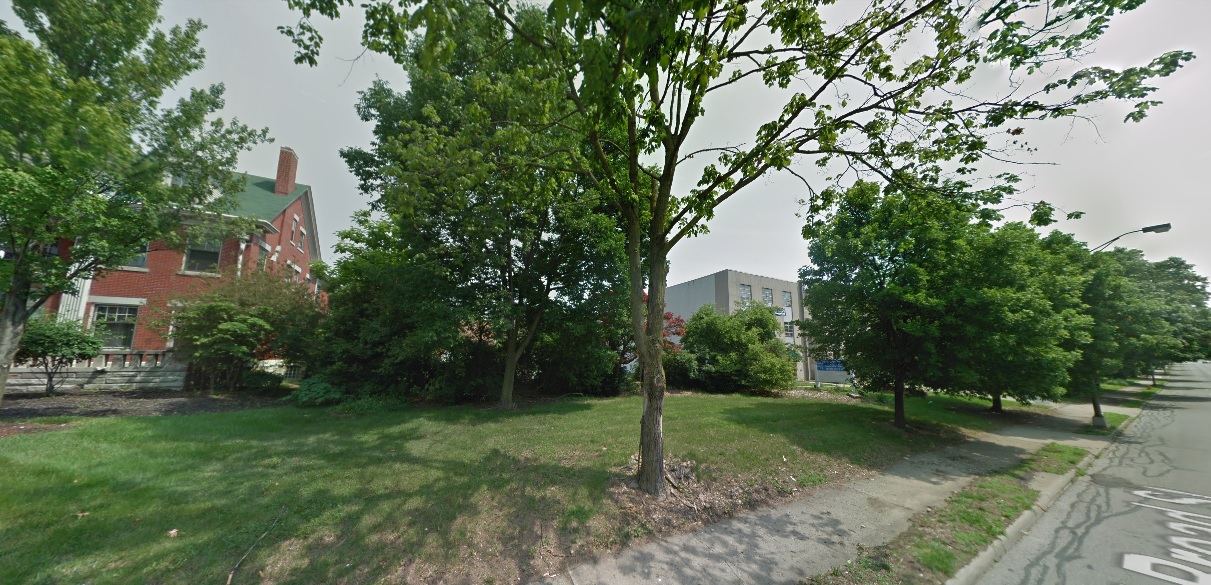
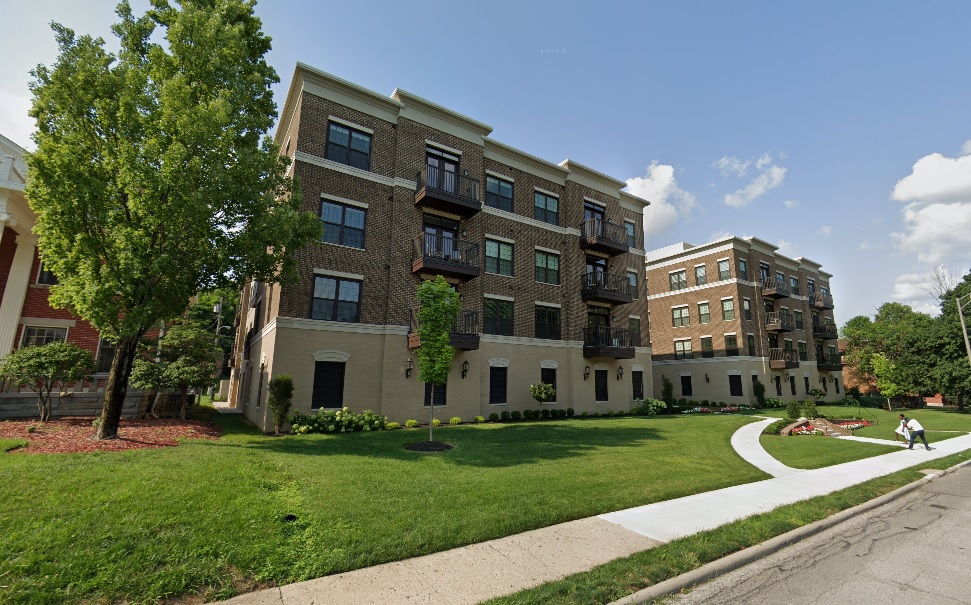
17th Avenue, looking north from Gay Street Before: 2011 After: 2020
Broad Street, looking northeast west of Woodland Avenue Before: 2011 After: 2021
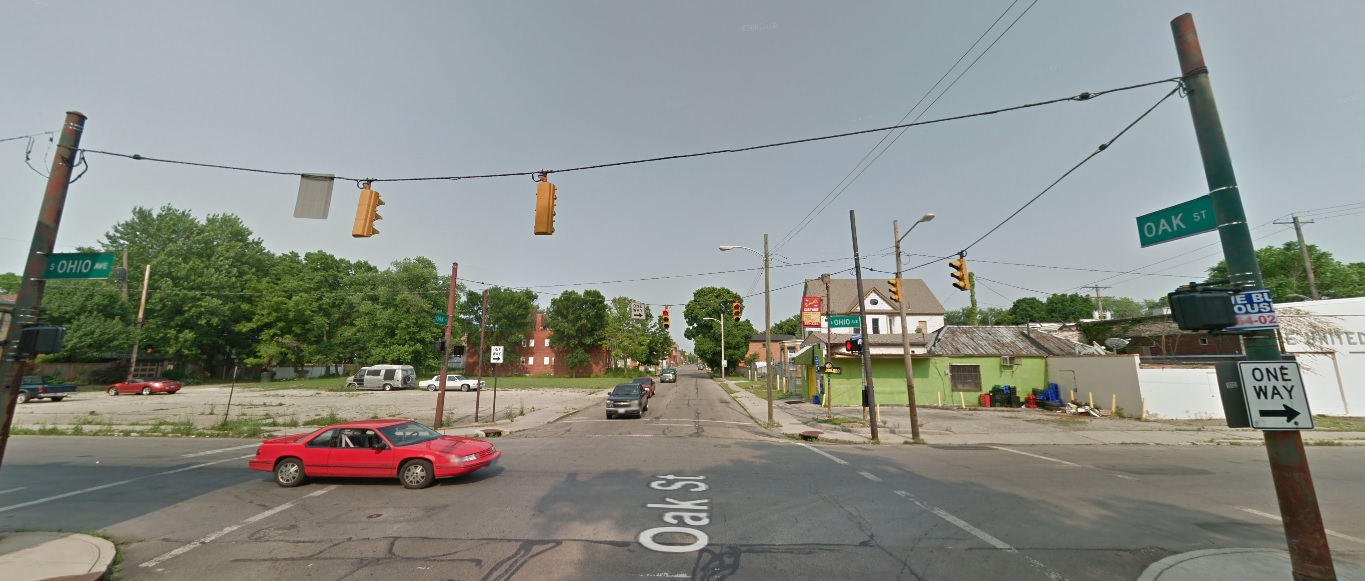
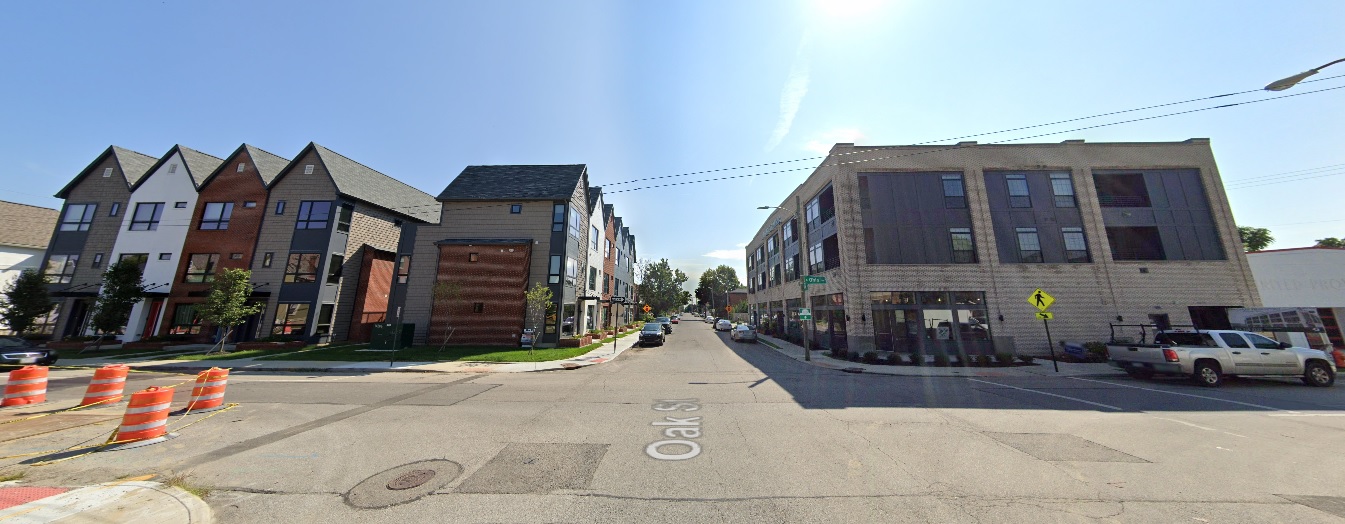
Oak Street, looking east from Ohio Avenue Before: 2011 After: 2021
These images represent just a small fraction of the development and changes that have occurred in and around the city, and don’t even include the large developments in suburban areas like Grandview Yard in Grandview or Bridge Park in Dublin. The next 10 years looks to be even more significant, with new mixed-use towers for Downtown, potential skyscrapers for Easton, and large numbers of infill development projects continuing in central neighborhoods from Franklinton to Linden to the South Side. With them, the city will continue to grow more dense and more vibrant and- with any luck- will also help spur much needed change to Columbus’ underwhelming transit system.
These Columbus development links show many of the projects seen in the photos, as well as projects that are still just in the proposal stages. The City provides a master list of area development commissions to keep track of the latest proposals.
In the last few decades, the Columbus Bhutanese community has grown into one of the largest in the world outside of Bhutan, itself. Many of these immigrants were resettled in other parts of Canada and the US, but an increasing number of them have made their way to Columbus and Central Ohio. According to the Bhutanese Community of Central Ohio, the area’s Bhutanese population now numbers upwards of 27,000, and projected to surpass 30,000 over the next few years.
This community has already made a local impact, opening new restaurants, shops and cultural and religious centers across the city and region.
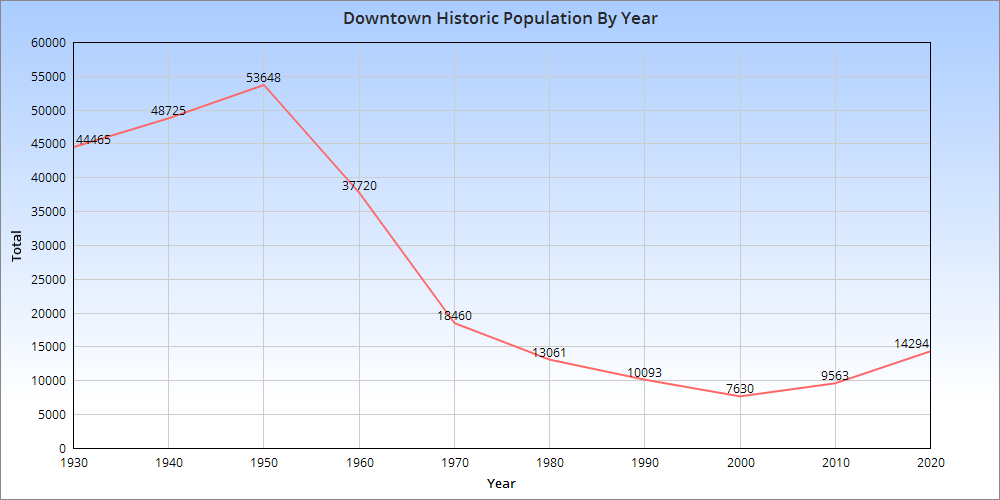
With the latest US Census data for 2020, we can once again take a closer look at how the Downtown area is doing.
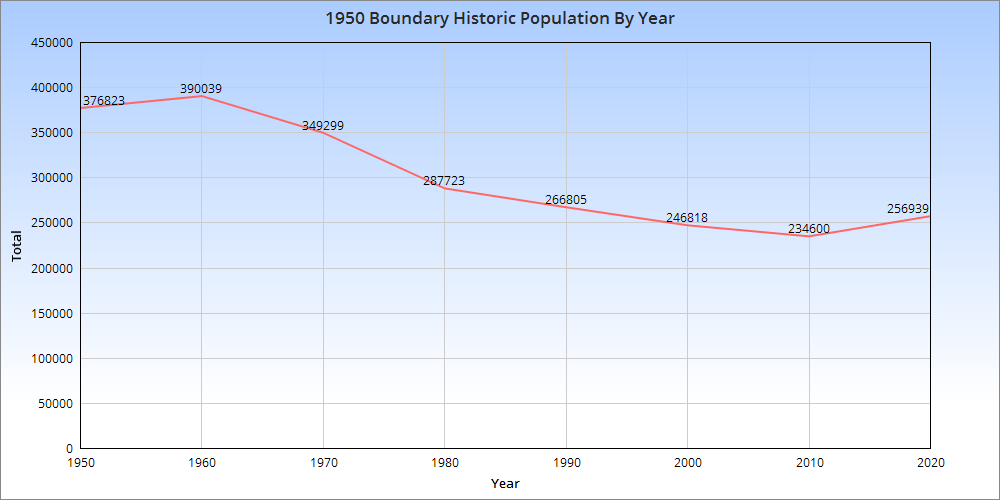
Looking at the graph above, we can see that the Downtown population peaked in 1950 and declined through 2000. The last 20 years have seen accelerating growth and the population was the highest in 2020 since 1970. One caveat with this is that the census tract boundaries that are used to make up this graph have changed some over the years. They haven’t changed significantly, but the area that’s being covered in 2020 is slightly different than it was in 1950. As such, it’s more of an approximation per year rather than exact figures based on the exact same area. Still, the rapid decline after 1950 is well-documented. Highways were either being planned or already under construction through the neighborhood during the 1950s, and this also helped the beginning stages of the suburban flight from the urban core.
The urban core of the city overall reached its population peak in 1950, and the 1950 boundaries represent the oldest, arguably most urban part of the city today. Let’s examine how the population within that boundary changed over the same time. The 1950 boundary peaked in 1960 and then declined through 2010. Between 2010-2020, the 1950 boundary area gained more than 22,000 new residents, a significant increase which puts the area back to where it was around 1995.
So in both cases, the urban core of Columbus is in recovery, though it is unlikely to ever regain its 1950 population. Average household size is much smaller now than it was 70 years ago, so it would require a massive amount of infill that would be far denser than much of what is getting built in recent years. Outdated zoning codes, among other reasons, have been limiting many projects in the urban core from reaching their potential.
Breaking things down a bit further, let’s look at the census tracts that made up the 1950 boundary in 2020 and rank them for population and growth.
Top 10 Fastest-Growing 1950 Boundary Census Tracts by Total 2010-2020 1. 1121: +4,831 The tract is the main OSU Campus. The explosive growth is mostly due to the recent requirement that sophomores also have to now live on Campus, prompting thousands of students to move to the tract from nearby neighborhoods. 2. 4002: +2,592 This new tract was split off of Tract 40 and includes the southwest area of Downtown, including RiverSouth. 3. 22: +2,428 This tract is the heart of Italian Village and includes the large, new Jeffrey Park development. 4. 1901: +2,028 Includes the 5th Avenue corridor to just east of 5thxNW. 5. 32: +1,353 This tract covers the southern part of Victorian Village/Harrison West, as well as the far western sections of the Arena District where the new White Castle HQ complex is. 6. 17: +1,290 Western Weinland Park, which has seen rapid revitalization in recent years. 7. 30: +1,084 This area includes all of the norther half of Downtown north of Broad Street and west to Neil Avenue in the Arena District. 8. 16: +717 Eastern Weinland Park, which has seen hundreds of new housing units constructed along and near Grant Avenue. 9. 1902: +653 Includes the 5th Avenue corridor through 5thxNW. 10. 21: +648 The heart of the High Street strip in the Short North continued to add people. It reached its highest population in 60 years.
Top 10 Tracts with the Highest Population Densities in 2020 1. 1121: 34,888.8 2. 1810: 28,351.1 3. 1302: 24,740.7 4. 1301: 20,549.1 5. 17: 20,158.6 6. 12: 20,069.6 7. 1110: 18,353.2 8. 10: 16,260.2 9. 16: 12,675.6 10. 21: 12,196.7 All of these tracts are either in the Short North or surrounding Ohio State’s campus. They include the highest densities anywhere in Ohio.
So there you have it. The urban core of Columbus is clearly on a positive path. So long as infill development continues, population growth should also continue to increase. Perhaps someday, this increasing population and density may facilitate the construction of more amenities, including rail lines, BRT and more biking infrastructure, all of which lags in the area. To see Census Tract data in map form, the Census Tract Maps page provides it.
Continuing with the data from the 2020 Census, we break down the population rank for every community and census-designated place in the Columbus metro area. Census-designated places are areas with concentrations of population, but are not part of incorporated villages, towns or cities.
The main story with the 2020 census numbers is that smaller communities in rural counties generally declined the past decade. This followed a similar story with non-metro counties, not only in Ohio, but nationally. Population continues to concentrate closer to more urban areas, which tend to be the job centers. If such population declines continue in the decades ahead, many of these small towns and villages may die out.
These trends also have potential impacts on the upcoming state redistricting. With conservative, rural areas emptying out and more liberal cities and urban areas growing, how will this affect how congressional districts get drawn?
Franklin blew away the competition, adding more than 4x as many people as 2nd place Delaware County. Delaware County may be called the state’s fastest-growing by percent, but it’s clear what the dominant destination is in Ohio.
Core counties in Northern Ohio, as well as pretty much all of Appalachia and rural counties saw large population losses. This pattern of urban/metro counties gaining while exurban and rural counties declined was repeated nationally. 52% of all US counties lost population, with the vast majority of them being exurban and rural. There was clearly a strong trend towards people moving to or near major cities.