Is Columbus Walkable?


Is Columbus Walkable

“Walkability” is the new buzzword when it comes to urban neighborhoods and what new generations want. Based on the WalkScore criteria, and with scores from 0-100 (100 being the most walkable), here are Columbus’ most walkable neighborhoods.

Top 25 Most Walkable Neighborhoods and Total Score
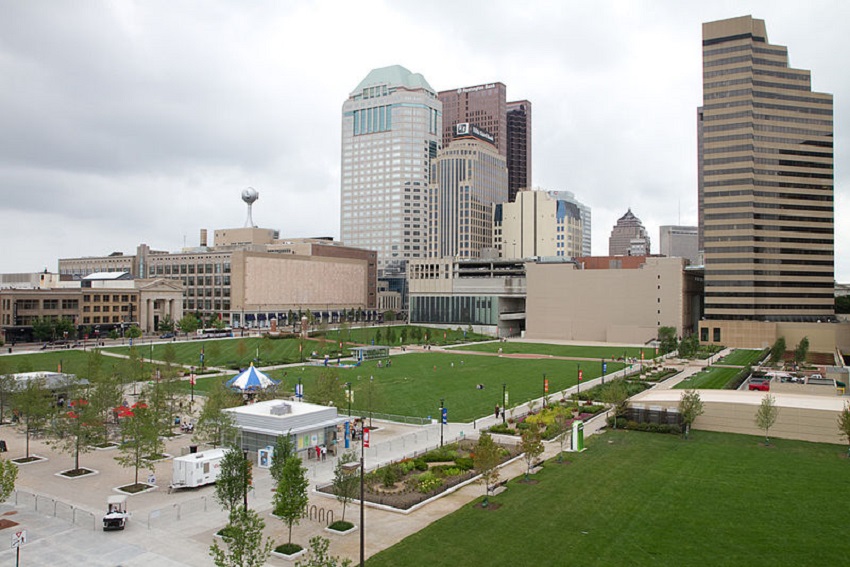
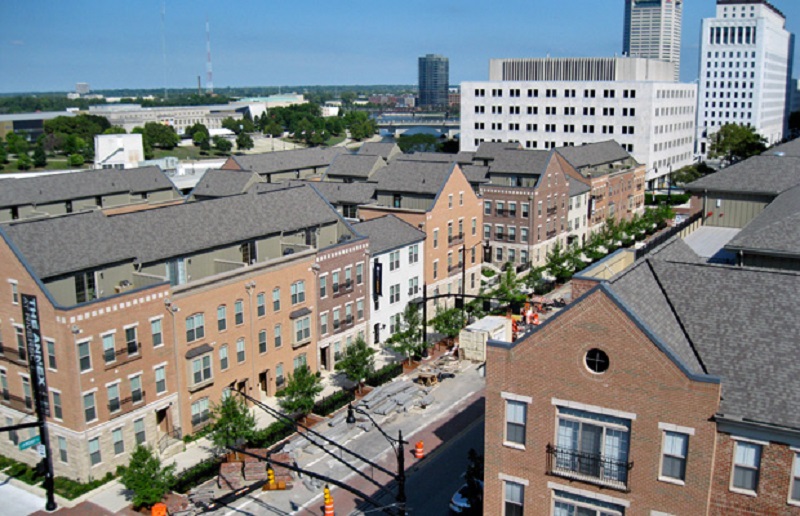
1. Downtown: 86
2. Dennison Place (Short North): 85
3. Italian Village (Short North): 85
4. Weinland Park (Just northeast of Short North): 85
5. Indiana Forest (Northeast Campus Area): 84
6. Necko (South Campus): 81
7. Victorian Village (Short North): 81
8. Old North Columbus: 80
9. Glen Echo (North Columbus): 80
10. North Campus: 80
11. German Village: 79
12. Tri-Village (5th Avenue West): 79
13. Brewery District: 78
14. OSU: 77
15. Iuka Ravine (North Columbus): 76
16. Clintonville: 75
17: King-Lincoln (Near East Side): 74
18. Schumacher Place (Near South Side): 73
19. Busch (Northwest Columbus): 72
20. Indianola Terrace (North Columbus): 71
21. Merion Village: 69
22. Governours Square (Bethel and Henderson): 68
23: Harrison West (Hilltop): 67
24. Old Beechwold (North Columbus): 67
25. Olde Towne East: 67

Together, the top 25 neighborhoods contain a little over 100,000 people.

Overall Columbus Neighborhood Walkability Score Breakdown
90-100 (Walker’s Paradise-daily errands do not require a car): 0
70-89 (Very Walkable- most errands can be done on foot): 20
50-69 (Somewhat Walkable- some errands cand be done on foot): 72
0-49 (Car Dependent- most or all errands require a car): 120
Average Columbus Score: 47

So less than half of Columbus’ neighborhoods are walkable, and only a small amount are very walkable, where most tasks do not require a car. The overall score shows that Columbus is still largely a car-dependent city.

Walkability, however, is just part of the picture. There are also scores for biking and mass transit access, both of which are also measured on the 0-100 scale.

Top 25 Bikeable Neighborhoods
1. North Campus: 89
2. Harrison West: 88
3. Northmoor (North Columbus): 80
4. Old North Columbus: 80
5. Clintonville: 77
6. OSU: 75
7. Brewery District: 74
8. Dennison Place: 74
9. Glen Echo: 74
10. Victorian Village: 74
11. Indiana Forest: 72
12. Iuka Ravine: 72
13. Necko: 71
14. Italian Village: 70
15. Merion Village: 68
16. Tri-Village: 68
17. Weinland Park: 67
18. Downtown: 66
19. Indianola Terrace (North Columbus): 66
20. North Hilltop: 66
21. Whetstone: 66
22. German Village: 64
23. Mount Vernon (Near East Side): 64
24. Riverview (North Columbus): 63
25. Schumacher Place: 63

The majority of Columbus’ most bikeable neighborhoods are also the most walkable.

Bikeable Neighborhood Score Breakdown
90-100: 0
70-89: 14
50-69: 45
0-49: 153
Average Columbus Bikeable Score: 45

Similar to its walkability, the majority of Columbus’ neighborhoods are not particularly bikeable. This has a lot to do with the further out and newer suburban areas of the city being built almost exclusively for cars. Only in the last 10 years has the city become more interested in promoting bike use. The city is adding several hundred miles of bike lanes and bike infrastructure, and it recently launched its own bike-share system.

Finally, we have the transit scores, which are based on access to mass transit options.

Top 25 Most Transit-Friendly Neighborhoods
1. Downtown: 64
2. Brewery District: 57
3. Italian Village: 57
4. German Village: 55
5. Victorian Village: 55
6. Dennison Place: 54
7. Weinland Park: 54
8. Necko: 52
9. Olde Towne East: 52
10. Schumacher Place: 52
11. Indiana Forest: 50
12. Harrison West: 49
13. King-Lincoln: 49
14. North Campus: 49
15. OSU: 49
16. Franklin Park (Near East Side): 49
17. Beechwood: 47
18. Iuka Ravine: 47
19. Milo-Grogan: 47
20. South of Main (Near East Side): 47
21. Livingston Park North (Near South Side): 46
22. Mount Vernon: 46
23. Old North Columbus: 46
24. Woodland Park (Near East Side): 46
25. Franklinton: 45

Transit Score Neighborhood Breakdown
90-100: 0
70-89: 0
50-69: 11
0-49: 201
Average Columbus Transit Score: 29

Clearly, based on these numbers, the city’s transit system needs a ton of improvement. COTA, or the city’s bus system, is really the only form of mass transit available, and beyond a few areas near Downtown, seems to struggle to provide access. The city is currently studying BRT (Bus Rapid Transit) with a first line proposed from Downtown and up along Cleveland Avenue to the North Side, with future lines coming after that. This will help, but there is still much to be done. Some type of rail system should also be part of near future development, as the city remains one of the largest in the US without any type of passenger rail.

So what is the overall picture of the city? First, that too much of the city is built for car use only. The boom in urban development has been significant, but the vast majority of it is occurring in areas that have the highest scores. Correlation or coincidence? Densification of neighborhoods further from the core is entirely possible, and these areas can and should be built with walkability and transit in mind. The city is taking steps for improvement, but it is, at least in my opinion, one of the weakest points of Columbus.


Rise of RiverSouth


The RiverSouth area of Downtown was, not that long ago, the epitome of the disastrous Urban Renewal policy so popular during much of the mid-latter part of the 20th century. Bounded to the east by High Street, north by State Street, west by the Scioto River and south by I-70, this area, by the mid-1990s, had become a sea of surface parking lots, old storage warehouses, underutilized or empty storefronts and ugly infrastructure. The construction of City Center Mall in 1989, with its location directly across High Street, was supposed to help bring this neighborhood back with new development. Instead, as the mall did with the rest of Downtown, it helped suck the life out what retail and business existed there. Worse, the concrete, prison-like exterior of the mall lacked any type of street-level connection, so it functioned to keep people off the sidewalks and the streets were as abandoned as ever even as thousands of shoppers flooded the new mall every weekend.

Rise of RiverSouth Columbus, Ohio

The imposing structure of City Center.


As newer suburban competition gradually killed City Center itself, the city was left with the task of figuring out what to do with its hulking core. Proposals were put for from everything to government buildings to redesigning the building itself into an Easton-like outdoor shopping town center. However, the money and interest for such proposals just weren’t there, and so the city came up with another, much different plan. The 10-15 year development plan called for the complete demolition of the mall complex, replacing it with a new city park complete with an entertainment stage, carousel and eateries.

City Center being demolished in 2010.


The mall was closed in 2009 and demolished the following year. This event seems to have marked the true beginning of the rise of RiverSouth. Columbus Commons and its 9 acres opened to the public in 2011. Despite a hugely negative expectation by some that the park would see little use and become a new place for vagrants and criminals, CC was an almost instant success. Hundreds of events were held there during its first year, and those numbers have grown every year since. Picnic with the Pops moved to the new park during the 2012 season, and the Columbus Food Truck Festival has attracted tens of thousands each of the last 2 years. The carousel, outdoor library and other events have been popular with kids and families. The park, with all its success, helped to bring about another important change to the area. It attracted development.

Columbus Commons before any development.


Originally, the park’s long-term plan was to have the grassy areas along High Street developed, but no one expected that to happen within a decade. Instead, a developer came forward less than a year after the park opened. High Point was that project, a pair of 6-story mixed-used buildings that would line the entire west side of the park from the corner of Rich and High. 302 new apartments, a handful of restaurants and ground floor retail lining High were all part of the project. Still under construction, this project should be complete in early 2014. Unfortunately, as the below pictures show (and the most flattering ones I could find at that) that the architecture is pretty horrendous. Despite that, the buildings will help fill in the gaps on High Street and bring hundreds of new residents, so the positives outweigh the negatives here.

Since the announcement of City Center’s demise, other projects have come about over the last few years that have helped raise the profile of RiverSouth.
-The Annex at RiverSouth replaced several surface parking lots along S. Front Street. This 214-unit, 4-story residential complex was originally planned to be a mix of condos and apartments, but became mostly apartments when the condo market died off. The complex was completed in 2010.

-The new Franklin County Courthouse, a $106 million, 7-story complex was completed in 2011 at the southwest corner of W. Main and S. High Streets.

-The Scioto Mile, the $44 million riverfront park, was completed in 2011 complete with fountains, a restaurant, paths and an entertainment stage.

Scioto Mile

-Main Street Bridge was replaced with a signature, $60 million arched span in 2011.

-The Rich Street Bridge was also replaced in 2012 with a new $26 million open span.

-The old Lazarus building, once connected to City Center by a massive skywalk, received a $60 million renovation in 2010 that converted the former retail building into an LEED green office building for the Ohio EPA and other organizations.

-Many of the streets in the area have been rebuilt with brick crossing and new landscaping.

So a lot has been done over the past few years, but what’s coming next? Beyond the High Point project, 3 more projects have recently been announced.

-The first is the conversion of the Secur-It warehouse building at the northeast corner of S. Front and W. Main Street. The century-old building was once used as a shoe factory, but was bricked over and used as a storage facility for many years. The current plan by Casto is to turn the building into about 90 residential units. The old warehouse windows will be restored, as well as the façade and interiors. The project should get started in the spring of 2014.

The current Secure-It building.


Proposed rendering for the Secure-It building.

-Second, we have Lifestyle Communities LC at RiverSouth project. This 8-story, 102-unit residential building will occupy the northwest corner of S. High and W. Rich Streets, directly across from Columbus Commons. Construction should begin this fall and complete in early 2015.

-And finally, we have the recently announced 250 High project. This $50 million, 12-story mixed-use tower would have ground floor retail, 4 floors of offices and 7 floors of residential totaling 156 units. This project will be built on the surface lot adjacent to the old City Center parking garage at 250 S. High Street. Construction on this project should also begin in the fall and complete sometime in early 2015.

These projects will no doubt spur others in the near future. Several surface lots still exist in RiverSouth, and a few of them are still along S. High Street just north of the new courthouse. Given the momentum of the neighborhood, expect to see development announcements on at least a few of these lots sooner than you think.


Columbus Housing Market August 2013


Columbus housing market August 2013

The Columbus housing market August 2013 data from Columbus Realtors shows that the area continued hot, with record August sales and potentially a record year still in the making. For the region, sales were up 11% for August and are were up almost 23% for the first 8 months of the year.

I looked at the 21 major areas of Franklin County (11 urban, 10 suburban). Here is what the August market looked like.

Top 10 August Sales Totals
1. Columbus: 1,027
2. Upper Arlington: 82
3. Dublin: 78
4. Clintonville: 75
5. Grove City: 72
6. Hilliard: 66
7. Westerville: 61
8. Gahanna: 52
9. Worthington: 37
10. Reynoldsburg: 35

Top 10 August Sales Increases Over August 2012
1. Minerva Park: +400.0%
2. Downtown: +66.7%
3. Gahanna: +48.6%
4. Upper Arlington: +34.4%
5. German Village: +25.0%
6. Clintonville: +21.0%
7. Grove City: +20.0%
8. Westerville: +15.1%
9. Columbus: +12.6%
10. Whitehall: +12.5%

Top 10 Total YTD Sales Through August
1. Columbus: 7,149
2. Dublin: 561
3. Upper Arlington: 533
4. Clintonville: 505
5. Grove City: 437
6. Westerville: 436
7. Hilliard: 409
8. Gahanna: 369
9. Reynoldsburg: 346
10. Pickerington: 236

Top 10 YTD Sales Increases Through over August 2012
1. Minerva Park: +52.9%
2. Whitehall: +37.4%
3. Hilliard: +37.2%
4. German Village: +34.5%
5. Bexley: +33.3%
6. Gahanna: +32.3%
7. Downtown: +31.7%
8. Clintonville: +31.2%
9. Pataskala: +31.1%
10. Reynoldsburg: +31.1%

Average Sales August 2013
Urban: 121.3
Suburban: 44.9
Urban without Columbus: 30.7

Average % Change August 2013 vs. August 2012
Urban: +49.5%
Suburban: -0.3%
Urban without Columbus: +53.2%

Average Sales YTD Through July
Urban: 826.2
Suburban: 330.0
Urban without Columbus: 193.9

Average % Change YTD vs. YTD 2012 (Through August)
Urban: +21.2%
Suburban: +24.0%
Urban without Columbus: +20.6%

Top 10 Average Sales Price August 2013
1. New Albany: $563,743
2. Upper Arlington: $391,739
3. Bexley: $379,746
4. Dublin: $316,481
5. Downtown: $280,630
6. German Village: $280,037
7. Worthington: $263,934
8. Grandview Heights: $240,743
9. Hilliard: $225,476
10. Canal Winchester: $197,671

Top 10 Average Sales Price % Increases vs. August 2012
1. Canal Winchester: +32.8%
2. Bexley: +27.4%
3. Pataskala: +19.0%
4. Worthington: +18.0%
5. Upper Arlington: +14.4%
6. Reynoldsburg: +11.1%
7. Columbus: +10.4%
8. New Albany: +8.8%
9. Gahanna: +5.4%
10. Hilliard: +3.5%

Top 10 Average Sales Price YTD
1. New Albany: $546,941
2. Upper Arlington: $360,574
3. Bexley: $352,910
4. Dublin: $330,887
5. German Village: $306,121
6. Downtown: $283,942
7. Worthington: $247,084
8. Grandview Heights: $222,795
9. Hilliard: $219,123
10. Gahanna: $200,988

Top 10 Average YTD Sales Price % Change vs. YTD 2012
1. Whitehall: +16.7%
2. Downtown: +15.5%
3. Upper Arlington: +12.6%
4. Gahanna: +12.3%
5. Minerva Park: +12.2%
6. Reynoldsburg: +9.6%
7. New Albany: +8.7%
8. Canal Winchester: +7.3%
9. Bexley: +6.2%
10. Worthington: +5.1%

Average Price August 2013
Urban: $223,076
Suburban: $230,864
Urban without Columbus: $231,445

Average Price % Change vs. August 2012
Urban: +1.4%
Suburban: +6.9%
Urban without Columbus: +0.5%

Average Price YTD
Urban: $215,558
Suburban: $224,012
Urban without Columbus: $224,254

Average Price % Change YTD vs. YTD 2012
Urban: +4.9%
Suburban: +4.9%
Urban without Columbus: +4.9%

Top 10 Fastest Selling Markets August 2013 (based on # of Days listings sell)
1. Gahanna: 32
2. Obetz: 32
3. Whitehall: 36
4. Bexley: 37
5. Upper Arlington: 37
6. Clintonville: 41
7. Worthington: 41
8. Grandview Heights: 42
9. Hilliard: 43
10. Westerville: 48

Top 10 Fastest Selling Markets YTD
1. Worthington: 38
2. Upper Arlington: 45
3. Grandview Heights: 46
4. Clintonville: 54
5. Hilliard: 55
6. Westerville: 55
7. Gahanna: 58
8. Bexley: 59
9. Dublin: 60
10. Grove City: 63

Average # of Days before Sale, August 2013
Urban: 49.4
Suburban: 66.8
Urban without Columbus: 48.6

Average # of Days before Sale, YTD
Urban: 62.7
Suburban: 62.4
Urban without Columbus: 62.4

Top 10 Lowest Housing Supplies (based on # of months to sell all listings), August 2013
1. Worthington: 2.1
2. Bexley: 2.3
3. Clintonville: 2.5
4. Grandview Heights: 2.5
5. Hilliard: 2.5
6. Westerville: 2.7
7. Upper Arlington: 2.8
8. Gahanna: 3.1
9. Dublin: 3.3
10. Pickerington: 3.9

Average # of Months to Sell All Listings
Urban: 3.6
Suburban: 4.1
Urban without Columbus: 3.5

Average % Change of Single-Family Home Sales, August 2013 vs. August 2012
Urban: +32.0%
Suburban: -1.8%
Urban without Columbus: +34.0%

Average % Change of Condo Sales, August 2013 vs. August 2012
Urban: +65.5%
Suburban: +51.0%
Urban without Columbus: +70.3%

Average % Change of Single-Family Home Sales YTD vs. YTD 2012
Urban: +12.9%
Suburban: +23.8%
Urban without Columbus: +11.5%

Average % Change of Condo Sales YTD vs. YTD 2012
Urban: +44.3%
Suburban: +29.5%
Urban without Columbus: +45.8%


Downtown Columbus Parking


Downtown Columbus parking Columbus, Ohio

Downtown Columbus parking is a problem… in that there is far too much of it. It’s long been common knowledge that Downtown had an abundance of parking lots and garages, but I’ve never seen it actually mapped or counted before. The following Google map shows what’s long been known in a bit more graphic detail.

http://goo.gl/maps/hWkCf”>Downtown Parking

Red pins are surface parking lots and blue pins are parking garages. I only tried to count surface lots with 10 spaces or more, and they could be city, business or other types of lots. Lots currently being developed were not counted, nor were underground garages.

The final tally? 310 surface lots and 27 garages! Remember that the next time someone says they can’t find somewhere to park Downtown.

Major Ohio State Housing Project


Ohio State University has been engaged in long-term housing developmentand improvements on its campus for a few years now, and is set to begin the next and largest phase to date.

The first phase along W. 11th Avenue, called the South Campus High Rise Renovation and Addition Project, is nearing completion. The $171 million project began in 2010 and focused on Stradley, Smith, Park, Steeb and Siebert Halls. The residential buildings, which were all constructed between 1957 and 1960, would see major changes.

-New 12-story additions would connect Park with Stradley and Steeb to Smith.
-10-story Siebert Hall would receive a major renovation.

Major Ohio State housing project Columbus, Ohio

Rendering of the additions between Park/Stradley and Steeb/Smith.


In addition to the building additions, air conditioning, new elevators, lobbies and other improvements were made. The air conditioning was provided by drilling 450 geothermal wells. The additions would bring an additional 360 student beds.

Also renovated and added to was the William H. Hall housing complex at W. 11th and Worthington Street. Opened in August 2012, the building added 530 new beds.

The South Campus High Rise Renovation and Addition Project will ultimately add about 900 new student beds, but this is a far cry from the project just beginning along Lane Avenue.

Announced around the same time as SCHRRAP, the North Campus Residential District Project began just this past week. This project focuses on the large cluster of dorms and other buildings at the southwest corner of N. High Street and W. Lane Avenue. Most were built in the 1960s and 1970s and look it.

North Campus in 2013.


The image above shows how the area looks currently. As the key says, the buildings in red are scheduled to be demolished. The road that goes through the complex, Curl Drive, is also scheduled to be removed.

The image above shows the first phases of construction through Spring 2014. As you can see, there will be 3 main areas of construction during this period.
-A new dorm will be constructed at the southeast corner of W. Lane and Neil Avenues. This area is currently a surface parking lot.
-Scott Hall will be demolished and the site will be replaced with a much larger building.
-Raney Commons will be demolished, and site preparation will take place for new buildings, as well as removing Curl Drive and other infrastructure.
-Once site preparation is complete, 3 new dorm buildings will be constructed at the corner of N. High and W. Lane.

The last image above shows the final phase of construction, from Fall 2015 to Summer 2016. During this period, several changes take place.
-4 row homes along W. Lane will be demolished, as well as North Commons, Houck, Blackburn and Nosker Halls, the Royer Student Activities building and the Jones Pool.
-5 new buildings will be built in this area, as well as new addtions to Taylor, Jones and Drackett Halls.
-A central pedestrian corridor will be completed through the entire complex.
-High and Lane will be landscaped, and park spaces will be created throughout.

Final rendering.


In the end, 3,200 new beds will be created in the $370 million project. This will drastically change the look and feel of this area, and will continue to add density to the campus area, already Columbus’ most dense.