Although not specific to Columbus, the link is a great global resource. It shows global forests change over time, all the way down practically to the individual tree. The map is so detailed that it shows the loss of trees at the Scioto Riverfront when they were removed to rebuild Bicentennial Park as part of the Scioto Mile. So check it out!
This link is continuously being updated because there are thousands and thousands of historic buildings in the Columbus area. I am focusing on just those within I-270. Information includes the address or name of the building, the year or approximate time built, height in stories, original and current uses, as well as whether or not it is on the National Register of Historic Buildings. If so, I included the year that it was added to the Register.
The buildings on the map go all the way back to 1804 and run through 1925.
Because this map is a work in progress, the link will be permanent under the City Resources links on the home page. Keep checking back to see more places being added over time.
The latest numbers for the Columbus housing market from Columbus Realtors.
LSD=Local school district CSD=City school district
Top 15 Most Expensive Locations by Median Sales Price in October 2013 1. New Albany: $445,900 2. Upper Arlington CSD: $358,000 3. Downtown: $330,000 4. Powell: $305,000 5. Dublin: $302,125 6. Jefferson LSD: $292,500 7. Olentangy LSD: $288,500 8. Granville CSD: $272,000 9. New Albany Plain LSD: $262,500 10. Worthington: $249,900 11. Buckeye Valley LSD: $246,250 12. Big Walnut LSD: $238,500 13. Beechwold/Clintonville: $230,000 14. Bexley: $225,875 15. German Village: $217,500
Top 15 Least Expensive Locations by Median Sales Price in October 2013 1. Whitehall: $42,500 2. Lancaster CSD: $75,250 3. Hamilton LSD: $83,450 4. Columbus CSD: $84,200 5. Newark CSD: $87,450 6. Groveport Madison LSD: $90,150 7. London CSD: $94,500 8. South-Western CSD: $95,000 9. Columbus: $104,500 10. Circleville CSD: $110,250 11. Blacklick: $134,251 12. Obetz: $134,950 13. Canal Winchester CSD: $135,000 14. Grove City: $135,000 15. Reynoldsburg CSD: $136,200
Overall Metro Median Sales Price in October 2013: $149,302 Median Sales Price Change October 2012-October 2013: -$3,183
Top 15 Locations with the Highest Median Sales Price % Growth Between October 2012-October 2013 1. Hamilton LSD: +85.4% 2. Jefferson LSD: +69.8% 3. Downtown: +63.8% 4. Reynoldsburg CSD: +54.4% 5. Obetz: +51.8% 6. Jonathan Alder LSD: +50.4% 7. Sunbury: +36.5% 8. Beechwold/Clintonville: +28.6% 9. Westerville CSD: +20.2% 10. Minerva Park: +19.4% 11. Marysville CSD: +19.4% 12. Lithopolis: +19.0% 13. Northridge LSD: +17.4% 14. Circleville CSD: +16.7% 15. Granville CSD: +15.6%
Top 15 Locations with the Lowest Median Sales Price % Growth Between October 2012-October 2013 1. German Village: -16.3% 2. Lancaster CSD: -16.3% 4. Buckeye Valley LSD: -14.9% 5. New Albany Plain LSD: -14.6% 6. Canal Winchester CSD: -14.6% 7. Grandview Heights: -14.2% 8. Hilliard: -12.8% 9. South-Western CSD: -11.4% 10. London CSD: -11.3% 11. Dublin CSD: -10.8% 12. Dublin: -10.3% 13. Whitehall: -7.6% 14. Gahanna Jefferson CSD: -5.6% 15. Johnstown Monroe LSD: -3.7%
Overall Metro Median Price % Change October 2012-October 2013: -2.1%
Top 10 Locations with the Most New Listings in October 2013 1. Columbus: 1,107 2. Columbus CSD: 691 3. Westerville CSD: 177 4. South-Western CSD: 169 5. Hilliard CSD: 158 6. Olentangy LSD: 157 7. Dublin CSD: 123 8. Groveport Madison LSD: 91 9. Worthington CSD: 79 10. Dublin: 73
Top 10 Locations with the Fewest New Listings in October 2013 1. Valleyview: 0 2. Lithopolis: 0 3. Minerva Park: 2 4. Jefferson LSD: 5 5. Obetz: 5 6. Sunbury: 5 7. Northridge LSD: 9 8. Jonathan Alder LSD: 9 9. German Village: 9 10. Grandview Heights: 10
Overall Metro New Listings in October 2013: 2,693 New Listings % Change October 2012-October 2013: +5.9%
Top 10 Fastest-Selling Locations by # of Days Homes Remain on the Market Before Sale in October 2013 1. Johnstown Monroe LSD: 30 2. Powell: 31 3. Buckeye Valley LSD: 32 4. Grandview Heights: 39 5. Minerva Park: 42 6. Beechwold/Clintonville: 45 7. Northridge LSD: 45 8. Olentangy LSD: 46 9. Westerville: 46 10. Jonathan Alder LSD: 47
Top 10 Slowest-Selling Locations by # of Days Homes Remain on the Market Before Sale in March 2013 1. Circleville CSD: 118 2. London CSD: 107 3. Lancaster CSD: 106 4. Obetz: 105 5. Hamilton LSD: 96 6. New Albany CSD: 91 7. Granville CSD: 84 8. Jefferson LSD: 82 9. Big Walnut LSD: 81 10. Hilliard: 78 11. Reynoldsburg: CSD: 78
Overall Metro Average # of Days on Market Before Sale: 74.7
Top 10 Locations with the Best Change in # of Days on the Market Before Sale October 2012-October 2013 1. Lithopolis: +522.2% 2. Minerva Park: -77.25 3. Johnstown Monroe LSD: -74.6% 4. Buckeye Valley LSD: -71.7% 5. Jonathan Alder LSD: -69.1% 6. Grandview Heights: -64.2% 7. Powell: -62.7% 8. German Village: -61.2% 9. Northridge LSD: -54.5% 10. Pickerington LSD: -47.0%
Top 10 Locations with the Worst Change in the # of Days on the Market Before Sale October 2012-October 2013 1. Hamilton LSD: +190.9% 2. Obetz: +150.0% 3. Lancaster CSD: +86.0% 4. Sunbury: +50.0% 5. Circleville CSD: +45.7% 6. London CSD: +27.4% 7. New Albany: +14.6% 8. Worthington: +13.7% 9. Granville CSD: +9.1% 10. New Albany CSD: +8.3%
Overall Metro # of Days on Market Before Sale % Change October 2012-October 2013: -24.9%
According to Columbus Realtors, September continued one of the Columbus area’s longest positive streaks when it came to housing sales, although sales were down a bit from earlier this year. Overall, sales were up 13.1% and prices were up 4.2%.
For the housing report, I look at the 21 major areas of the Franklin County area (11 urban, 10 suburban). Here is what the September market looked like.
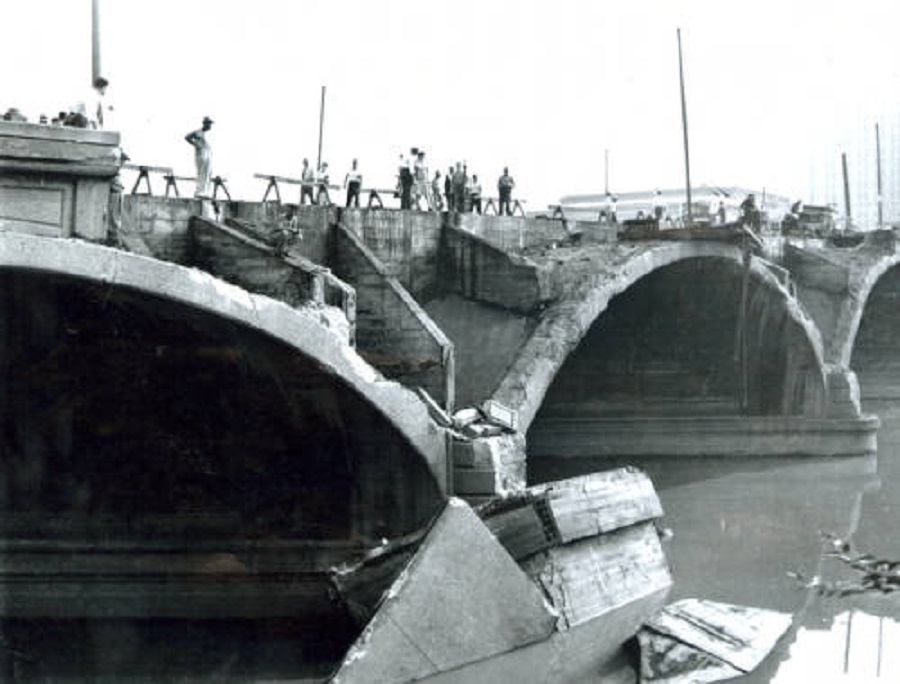
On the hot, summer day of August 21, 1947, a thunderstorm hit the Columbus area that would produce a memorable and tragic event. A bolt of lightning struck the southwestern corner of the Broad Street Bridge in Downtown. Perhaps because of the extreme heat or structural deficiencies, the lightning caused part of the bridge to seemingly explode, and large chunks of the bridge collapsed into the Scioto River. While no cars fell off the bridge as a result, 4 pedestrians did. One of those pedestrians died the following day from sustained injuries. The bridge itself had been built as the replacement for the one destroyed during the great flood of 1913. After the incident in 1947, the bridge was repaired and continued to serve as the main Scioto River crossing at Downtown for another 43 years. In 1990, it was demolished and replaced by the current (and very similar looking) Discovery Bridge, completed in 1992 in time for the celebration of the 500th anniversary of the “discovery” of America by the city’s namesake, Christopher Columbus.