With temperatures predicted to fall to near freezing for the first time this week for the fall season, I thought it might be interesting to take a look at the incidence of early season cold, and the average on when it tends to arrive.
Here are the earliest dates on record for the following:
Average Date of First Under-40 Temp By Decade (1878-2014) 2010s: October 11th 2000s: October 8th 1990s: October 2nd 1980s: September 30th 1970s: October 1st 1960s: September 25th 1950s: September 25th 1940s: September 30th 1930s: October 11th 1920s: October 2nd 1910s: October 9th 1900s: October 5th 1890s: October 1st 1880s: October 2nd 1870s: October 1st
Average Date of First 32 or Below High By Decade 2010s: December 4th 2000s: December 2nd 1990s: December 7th 1980s: November 28th 1970s: November 29th 1960s: November 23rd 1950s: November 26th 1940s: December 2nd 1930s: November 27th 1920s: November 28th 1910s: November 22nd 1900s: November 30th 1890s: November 25th 1880s: November 30th 1870s: December 4th
Average Date of First 32 or Below Low By Decade 2010s: October 24th 2000s: October 26th 1990s: October 22nd 1980s: October 17th 1970s: October 17th 1960s: October 8th 1950s: October 22nd 1940s: November 3rd 1930s: October 24th 1920s: October 28th 1910s: October 31st 1900s: October 24th 1890s: October 20th 1880s: October 20th 1870s: October 26th
This occasional series on failed and canceled projects around the city today talks about an unassuming parking garage that was originally supposed to be much more.
Beginning in 1984 and continuing into 1985, a parking garage/city office tower was being tossed around to house an increasing number of city office works. Space had become tight and many existing buildings were more than 50 years old and required extensive renovations. The Daimler Group started construction on the 10-story garage part of the project at the southeast corner of W. Gay and N. Front in late 1984. The 16-story office project that would’ve been built on top (for a total 26-story building) was just one of 3 options the city was considering to alleviate its office problems. The other two options consisted of a $75 million civic center about a block north of City Hall, or simply renovating the existing buildings.
In the end, it was deemed that there were too many other problems to spend public dollars on. At the time, there was quite an issue with road maintenance funding, and the city deemed that it was not the right time to build a brand new tower for city workers. By April 1985, the project was dead, although the garage was finished and remains to this day.
The Gay and Front garage in 2015.
Ironically, within a few years, the city would have several much larger office towers. 5 new towers were built between 1986 and 1991, though not all were specifically built for city offices. Renovation of existing buildings has been ongoing since.
This Random Columbus Photos 3 edition looks at a Downtown icon, the Columbus Athletic Club..
Photo Date: November 1, 1914 Location: 136 E. Broad Street
The photo shows the ongoing excavation of the Columbus Athletic Club. It was conceived a few years prior as a social club by a group of wealthy Columbus businessmen in 1912. The organization was originally housed in the Atlas Building at Gay and High, but the club wanted their own building. Construction began in early 1914, and the 6-story building was dedicated in 1915. The 100-year-old institution, now on the National Register of Historic Places, looks pretty much the same as it did when it was first built, and it remains a private club to this day. Over the years, the club has had many prominent members, including politicians and even a president, Warren G. Harding.
I’ve compared Columbus to peer cities nationally in terms of density and population, but I’ve never made a Midwest cities historic population and density comparison overall. For the following, I used the top 15 largest Midwest cities as of 2014.
Red indicates a fallen ranking while blue indicates a rise. Black is no change.
Historic Population Rankings 1840 1. Cincinnati: 46,338 2. St. Louis: 16,469 3. Detroit: 9,102 4. Cleveland: 6,071 5. Columbus: 6,048 6. Chicago: 4,470 7. Indianapolis: 2,695 8. Milwaukee: 1,700 9. Toledo: 1,222 10. Kansas City: Not incorporated. 11. Lincoln: Not incorporated. 12. Minneapolis: Not incorporated. 13. Omaha: Not incorporated. 14. St. Paul: Not incorporated. 15. Wichita: Not incorporated.
1850 1. Cincinnati: 115,435 2. St. Louis: 77,860 3. Chicago: 29,963 4. Detroit: 21,019 5. Milwaukee: 20,061 6. Columbus: 17,882 7. Cleveland: 17,034 8. Indianapolis: 8,091 9. Toledo: 3,829 10. St. Paul: 1,112 11. Kansas City: Not incorporated. 12. Lincoln: Not incorporated. 13. Minneapolis: Not incorporated. 14. Omaha: Not incorporated. 15. Wichita: Not incorporated.
Columbus seems poised to take the #2 spot from Indianapolis around or just after 2020. Also, 11 of 15 would’ve seen growth 2010-2020. Cleveland, Toledo, St. Louis and Detroit would be the only cities that still lost.
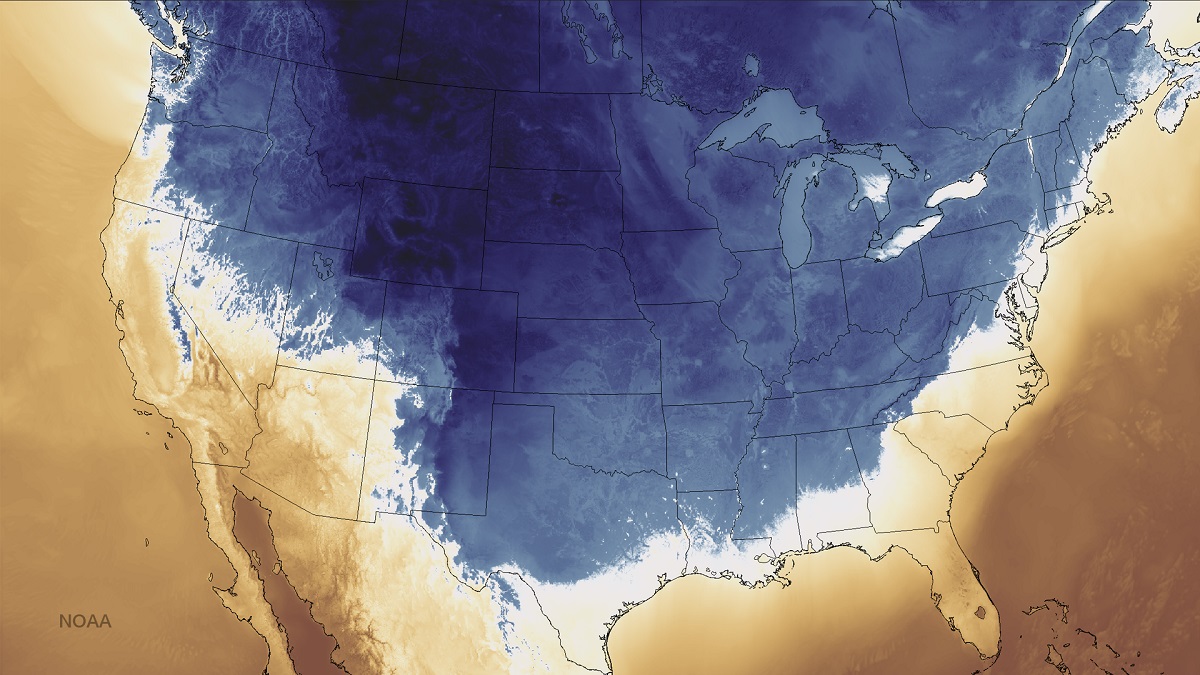
The mid-November 2014 cold wave that kickstarted a historic winter.
The Winter 2014-2015 Review details the historic season, with its bouts of extreme cold and heavy snowfall occurring in all months except December.
Temperature and snowfall ranking data goes back to the winter of 1878-1879. Snow depth ranking data goes back to 1940.
December-February Only Average High: 34.8 19th Coldest Average Low: 19.3 14th Coldest Mean: 27.1 15th Coldest Precipitation: 7.27″ 57th Driest Snowfall: 23.9″ 33rd Snowiest Average Daily Snow Depth: 0.9″ 15th Highest Largest Snowstorm: 6.8″ on February 21st 32 or Below Highs: 36 14th Most 32 or Below Lows: 76 13th Most Measurable Precipitation Days: 36 12th Fewest Measurable Snowfall Days: 15 11th Fewest Deepest Snow Depth: 6″ on February 21st Days with 1″+ Snow Depth: 30 16th Most
Entire Cold Season: October-April Average High: 46.6 14th Coldest Average Low: 29.4 14th Coldest Mean: 38.0 14th Coldest Precipitation: 19.51″ 67th Wettest Snowfall: 33.4″ 28th Snowiest Average Snow Depth: 0.6″ 7th Lowest Largest Snowstorm: 6.8″ on February 21st 32 or Below Highs: 43 12th Most 32 or Below Lows: 116 17th Most Measurable Precipitation Days: 89 16th Most Measurable Snowfall Days: 22 13th Fewest Deepest Snow Depth: 6″ on February 21st Days with 1″+ Snow Depth: 45 8th Most
Average High By Month October 2014: 63.4 32nd Coldest November 2014: 45.7 9th Coldest December 2014: 42.1 33rd Warmest January 2015: 33.8 32nd Coldest February 2015: 28.6 5th Coldest March 2015: 47.6 37th Coldest April 2015: 63.5 34th Warmest
Average Low By Month October 2014: 45.4 37th Warmest November 2014: 30.0 6th Coldest December 2014: 29.9 19th Warmest January 2015: 18.1 33rd Coldest February 2015: 10.0 3rd Coldest March 2015: 28.1 22nd Coldest April 2015: 42.9 28th Warmest
Mean By Month October 2014: 54.4 35th Coldest November 2014: 37.9 7th Coldest December 2014: 36.0 27th Warmest January 2015: 26.0 31st Coldest February 2015: 19.3 2nd Coldest March 2015: 37.9 33rd Coldest April 2015: 53.2 28th Warmest
Precipitation By Month October 2014: 2.77″ 42nd Wettest November 2014: 1.46″ 22nd Driest December 2014: 2.70″ 63rd Driest January 2015: 2.87″ 51st Wettest February 2015: 1.70″ 45th Driest March 2015: 3.92″ 45th Wettest April 2015: 4.09″ 37th Wettest
Snowfall By Month October 2014: Trace 2nd Least Snowy November 2014: 4.1″ 15th Snowiest December 2014: Trace 2nd Least Snowy January 2015: 8.4″ 48th Snowiest February 2015: 15.5″ 8th Snowiest March 2015: 5.4″ 23rd Snowiest April 2015: 0.0″ 1st Least Snowy
Average Snow Depth By Month October 2014: 0″ November 2014: 0.4″ December 2014: 0″ January 2015: 0.8″ February 2015: 3.3″ March 2015: 1.1″ April 2015: 0″
Maximum High By Month October 2014: 86 on the 2nd November 2014: 69 on the 11th December 2014: 61 on the 1st January 2015: 59 on the 3rd February 2015: 56 on the 8th March 2015: 69 on the 16th April 2015: 79 on the 13th and 18th
Minimum High By Month October 2014: 49 on the 31st November 2014: 19 on the 18th December 2014: 26 on the 31st January 2015: 13 on the 7th February 2015: 8 on the 15th and 19th March 2015: 23 on the 5th and 6th April 2015: 50 on the 23rd
Minimum High Records -The 33 on November 14th was a record for the day, beating the old record of 34 set in 1900, 1908, 1911 and 1916. -The 19 on November 18th tied the record for the day set in 1904. -The 8 on February 15th was a record for the day, beating the old record of 12 set in 1920. -The 10 on February 16th was a record for the day, beating the old record of -The 8 on February 19th was a record for the date, beating the old record of 10 set in 1885. -The 18 on February 27th tied the record for the date set in 1888 and 1934. -The 25 on February 28th was a record for the date, beating the old record of 26 set in 1986.
Maximum Low By Month October 2014: 58 on the 13th and 14th November 2014: 47 on the 4th December 2014: 44 on the 23rd January 2015: 34 on the 18th and 21st February 2015: 41 on the 8th March 2015: 43 on the 16th April 2015: 57 on the 19th
Maximum Low Records -The 54 on November 30th was a record for the date, beating the old record of 53 set in 1998 and 2006.
Minimum Low By Month October 2014: 38 on the 4th, 26th and 31st November 2014: 12 on the 18th December 2014: 15 on the 15th January 2015: -6 on the 8th February 2015: -11 on the 24th March 2015: 4 on the 6th April 2015: 28 on the 24th
Minimum Low Records -The -11 on February 24th was a record for the date, beating the old record of -1 set in 1914. -The 0 on February 28th was a record for the date, beating the old record of 2 set in 1934. -The 28 on April 24th tied the record for the date set in 1930.
Highest Daily Precipitation By Month October 2014: 0.57″ on the 6th November 2014: 0.39″ on the 17th December 2014: 0.82″ on the 6th January 2015: 1.46″ on the 3rd February 2015: 0.55″ on the 1st March 2015: 0.63″ on the 14th April 2015: 0.66″ on the 2nd
Highest Daily Snowfall By Month October 2014: Trace on the 4th November 2014: 3.8″ on the 17th December 2014: Trace on the 10th, 17th, 18th, 19th, 20th and 31st January 2015: 3.7″ on the 6th February 2015: 6.8″ on the 21st March 2015: 3.6″ on the 1st April 2015: 0.0″
Snowfall Records -The 6.8″ on February 21st was a record for the day, beating the old record of 5.8″ set in 1893. -The 3.6″ on March 1st was a record for the date, beating the old record of 3.5″ set in 1954.
Deepest Snow Depth By Month October 2014: 0″ November 2014: 3″ on the 18th and 19th December 2014: 0″ January 2015: 3″ on the 6th, 7th and 9th February 2015: 6″ on the 21st March 2015: 6″ on the 1st and 2nd April 2015: 0″