The Biggest Snowstorms of All Time


The biggest snowstorms of all time Columbus, Ohio

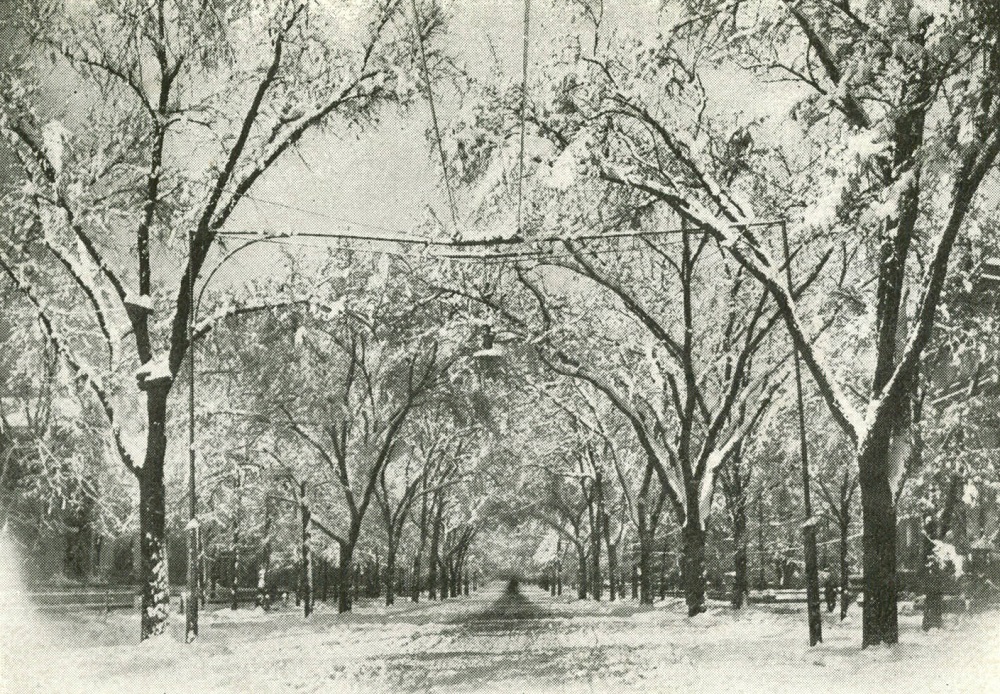
East Broad Street after a snowstorm in March, 1906.

In light of yesterday’s strange storm that challenged local forecasters, I thought it might be time to look at the biggest snowstorms of all time in Columbus, or at least since records began in 1878. I looked up the total snowfall over different periods of time.

Top 20 Largest Single Snowstorms of Any Duration
1. 3/7-3/8/2008: 20.5″
2. 2/14-2/17/2003: 15.5″
3. 2/16-2/19/1910: 15.3″
4. 11/23-11/29/1950: 15.2″
5. 1/6-1/7/1910: 12.7″
6. 4/3-4/5/1987: 12.6″
7. 1/7-1/9/1884, 2/11-2/12/1910: 10.6″
8. 2/15-2/16/2010, 2/4-2/5/2014: 10.4″
9. 3/19-3/20/1906, 1/13-1/14/1917: 10.0″
10. 2/7-2/8/1971, 1/16-1/17/1978, 2/5-2/6/2010: 9.9″
11. 1/6-1/7/1996: 9.8″
12. 1/13-1/15/1968, 2/27-2/28/1984: 9.5″
13. 2/13-2/14/1914: 9.3″
14. 3/5-3/6/1962: 9.2″
15. 12/19-12/20/1960: 8.8″
16. 1/14-1/15/1918: 8.5″
17. 2/25-2/26/1934: 8.4″
18. 1/31-2/1/1881, 2/25-2/26/2014: 8.3″
19. 3/11-3/12/1906: 8.2″
20. 12/3-12/4/1957: 8.1″

Top 12 Largest 1-Day Snowfalls
1. 3/8/2008: 15.5″
2. 4/4/1987: 12.3″
3. 1/6/1910: 11.9″
4. 2/15/2010: 9.7″
5. 3/19/1906: 9.6″
6. 2/5/2010: 9.0″
7. 2/8/1971, 2/16/2003: 8.9″
8. 1/7/1996: 8.8″
9. 3/5/1962: 8.6″
10. 1/8/1884: 8.5″
11. 2/16/1910: 8.2″
12. 12/3/1957: 7.9″

Top 12 Largest 2-Day Snowfalls
1. 3/7-3/8/2008: 20.5″
2. 3/8-3/9/2008: 15.5″
3. 2/16-2/17/1910: 15.0″
4. 1/6-1/7/1910: 12.7″
5. 4/4-4/5/1987: 12.5″
6. 4/3-4/4/1987: 12.4″
7. 2/15-2/16/2003: 12.0″
8. 1/5-1/6/1910: 11.9″
9. 2/16-2/17/2003: 10.8″
10. 2/11-2/12/1910, 2/4-2/5/2014: 10.6″
11. 2/15-2/16/2010: 10.4″
12. 1/8-1/9/1884: 10.2″

Top 12 Largest 3-Day Snowfalls
1. 3/6-3/8/2008, 3/7-3/9/2008: 20.5″
2. 3/8-3/10/2008: 15.5″
3. 2/16-2/18/1910: 15.3″
4. 2/15-2/17/1910: 15.0″
5. 2/15-2/17/2003: 13.9″
6. 2/14-2/16/2003: 13.6″
7. 1/5-1/7/1910, 1/6-1/8/1910: 12.7″
8. 4/3-4/5/1987: 12.6″
9. 4/4-4/6/1987: 12.5″
10. 4/2-4/4/1987: 12.4″
11. 1/4-1/6/1910, 1/7-1/9/1996: 11.9″
12. 11/25-11/27/1950: 11.5″

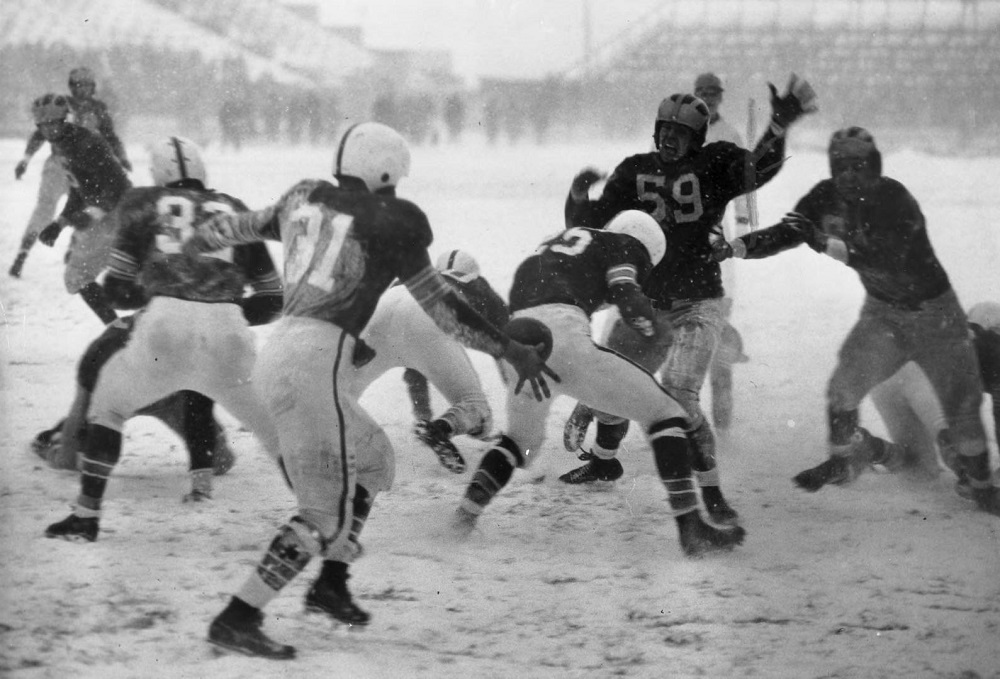
Players struggle during the infamous Ohio State-Michigan Snow Bowl game on November 27, 1950.


Top 12 5-Day Snowfalls
1. 3/4-3/8/2008, 3/5-3/9/2008: 21.2″
2. 3/6-3/10/2008, 3/7-3/11/2008: 20.5″
3. 1/16-1/20/1978: 17.6″
4. 3/31-4/4/1987: 16.4″
5. 2/15-2/19/2003: 15.9″
6. 4/2-4/6/1886: 15.7″
7. 2/13-2/17/2003, 2/14-2/18/2003, 3/8-3/12/2008: 15.5″
8. 2/14-2/18/1910, 2/15-2/19/1910, 2/16-2/20/1910: 15.3″
9. 2/13-2/17/1910: 15.0″
10. 4/3-4/7/1886, 2/12-2/16/1910, 2/5-2/9/2010: 14.3″
11. 1/17-1/21/1978: 14.2″
12. 2/12-2/16/2003: 14.0″

Top 12 Largest 7-Day Snowfalls
1. 2/11-2/17/1910: 25.6″
2. 2/12-2/18/1910: 21.4″
3. 3/2-3/8/2008, 3/3-3/9/2008, 3/4-3/10/2008, 3/5-3/11/2008: 21.2″
4. 3/6-3/12/2008, 3/7-3/13/2008: 20.5″
5. 1/14-1/20/1978: 19.0″
6. 2/10-2/16/1910: 18.8″
7. 3/30-4/5/1987: 18.3″
8. 3/29-4/4/1987: 18.1
9. 1/15-1/21/1978, 1/16-1/22/1978: 17.8″
10. 2/13-2/19/2003, 2/14-2/20/2003: 17.5″
11. 2/10-2/16/2003: 17.0″
12. 4/1-4/7/1886, 4/2-4/8/1886: 16.9″

Top 12 10-Day Snowfalls
1. 2/9-2/18/1910: 28.4″
2. 2/8-2/17/1910: 28.1″
3. 2/10-2/19/1910, 2/11-2/20/1910: 25.9″
4. 3/11-3/20/1906: 23.5″
5. 3/10-3/19/1906: 23.1″
6. 2/28-3/8/2008, 2/29-3/9/2008: 21.7″
7. 2/12-2/21/1910: 21.4″
8. 2/7-2/16/1910: 21.3″
9. 3/1-3/10/2008, 3/2-3/11/2008, 3/3-3/12/2008, 3/4-3/13/2008, 3/5-3/14/2008: 21.2″
10. 2/10-2/19/2003: 20.9″
11. 1/12-1/21/1978, 1/2-1/11/1996: 20.8″
12. 1/11-1/20/1978: 20.6″

Top 12 Largest 15-Day Snowfalls
1. 2/8-2/22/1910, 2/9-2/23/1910: 28.8″
2. 2/3-2/17/1910: 28.5″
3. 2/4-2/18/1910, 2/5-2/19/1910, 2/6-2/20/1910, 2/7-2/21/1910: 28.4″
4. 2/10-2/24/1910, 2/11-2/25/1910: 26.3″
5. 2/2-2/16/2010: 25.8″
6. 1/7-1/21/1978, 1/8-1/22/1978: 25.7″
7. 1/6-1/20/1978, 2/3-2/17/2010, 2/4-2/18/2010, 2/5-2/19/2010: 25.5″
8. 1/12-1/26/1978: 25.2″
9. 2/1-2/15/2010: 25.1″
10. 3/10-3/24/1906, 3/11-3/25/1906, 1/13-1/27/1978: 24.8″
11. 1/14-1/28/1978, 2/10-2/24/2003: 24.5″
12. 3/6-3/20/1906, 3/7-3/21/1906: 23.8″

Top 12 Largest 30-Day Snowfalls
1. 1/20-2/18/1910, 1/21-2/19/1910: 37.9″
2. 1/19-2/17/1910: 37.6″
3. 1/22-2/20/1910: 35.3″
4. 1/2-1/31/1978, 1/3-2/1/1978, 1/4-2/2/1978, 1/5-2/3/1978: 34.0″
5. 1/8-2/6/1978: 33.8″
6. 1/1-1/30/1978, 1/7-2/5/1978: 33.6″
7. 12/30/1977-1/28/1978, 12/31/1977-1/29/1978: 33.4″
8. 12/29/1977-1/27/1978: 32.8″
9. 12/28/1977-1/26/1978: 32.5″
10. 1/6-2/4/1978: 32.0″
11. 2/8-3/8/2008: 31.8″
12. 1/24-2/22/1910, 1/25-2/23/1910, 1/26-2/24/1910, 1/27-2/25/1910, 1/28-2/26/1910, 1/29-2/27/1910, 1/30-2/28/1910, 1/26-2/24/2003: 30.7″

Certain years show up on all the lists, including 1906, 1910, 1978, 2003, 2008 and 2010. These winters all had periods of extreme snowfall and are considered “historic”.
Check out more winter and other local weather data with the following links.
Winter Storms
Winter Season Records
Annual Weather Records
Wilmington National Weather Service


Ohio Had a Very Wet 2018


very wet 2018

If your yard has been a swampy no man’s land all year, there’s a reason for it. 2018 was one of the wettest years ever across the state. In some cities, almost every month featured above normal precipitation. Let’s take a look across the state to see how places fared in this extraordinary and very wet 2018.

Here were the final 2018 totals in major Ohio cities and how they rank since their records began.
Cincinnati: 55.90″ 3rd wettest since 1871.
Columbus: 55.18″ 1st wettest since 1878.
Cleveland: 51.47″ 4th wettest since 1871.
Youngstown: 50.97″ 2nd wettest since 1896.
Dayton: 48.99″ 10th wettest since 1893.
Akron: 48.46″ 5th wettest since 1896.
Toledo: 38.01″ 22nd wettest since 1871.

In big cities in Ohio, only Toledo managed to avoid having a top 10 wettest year. Columbus had its wettest on record, beating the previous record of 54.96″ set just a few years ago in 2011.

Locally in the Columbus metro, here were some other totals.
Newark: 56.01″
Marysville: 51.12″
Lancaster: 50.51″
Circleville: 46.66″
OSU Campus: 46.66″

Biggest Individual Precipitation Day and Rank
Cincinnati: 5.02″ on 8/16/2018, 2nd highest since 1871.
Youngstown: 3.50″ on 9/9/2018, 11th highest since 1896.
Dayton: 2.88″ on 4/3/2018, 24th highest since 1893.
Akron: 2.50″ on 9/9/2018, unranked.
Cleveland: 2.12″ on 11/1/2018, unranked.
Columbus: 2.06″ on 4/15/2018, unranked.
Toledo: 1.62″ on 3/1/2018, unranked.

Cincinnati had 2 days in the top 10, but most other cities had just constant rain rather than exceptionally high individual totals.

Total 2018 Measurable Precipitation Days and Rank
Youngstown: 191 1st most since 1896.
Akron: 180 1st most since 1896.
Cleveland: 177 8th most since 1871.
Columbus: 162 6th most since 1878.
Cincinnati: 151 7th most since 1871.
Dayton: 148 10th most since 1893.
Toledo: 142 16th most since 1871.

3 cities saw more than half their days with measurable precipitation. Columbus came in at just under 50%. This also had the unfortunate result of making most of the year feel unusually gloomy. Traditionally sunny months in the summer and fall were much cloudier than normal.


Total 2018 1″+ Precipitation Days and Rank
Columbus: 15 1st most since 1878.
Cleveland: 13 2nd most since 1871.
Cincinnati: 12 7th most since 1871.
Dayton: 11 6th most since 1893.
Akron: 10 5th most since 1896.
Toledo: 7 7th most since 1871.
Youngstown: 5 9th most since 1896.

Columbus had the most 1″ days of any year on record, and even beat every other major Ohio city.

Wettest 2018 Months
Cincinnati: 8.21″ in August
Youngstown: 7.91″ in September
Akron: 7.26″ in September
Dayton: 6.72″ in September
Columbus: 6.71″ in June
Cleveland: 6.68″ in July
Toledo: 5.91″ in May

No cities saw any of their months be even close to the wettest ever. There were not really any events with heavy flooding, either, except in February in Cincinnati, when the Ohio River reached the highest since the 1997 flood. There was also some scattered flooding from some tropical system remnants that passed through, particularly in September, but for the most part, it was just constantly wet from beginning to end in most places.

Flooding in Cincinnati in February, 2018.


One might ask if 2018 was merely a blip or part of a long-term trend in the state. Climate scientists have actually looked at this, and the state has indeed been getting both warmer and wetter over the last century or so, but the pace of both the warming and the increase in precipitation has been much faster since the 1970s. Many of the Ohio’s wettest years on record have occurred since 1990.


Today in History Armistice Day in Columbus


100 years ago today, World War 1 came to an end. Known as the Armistice, the agreement was officially completed on November 11, 1918. As in the rest of the nation, the mood in Columbus was celebratory.
In what was then said to be the “Greatest Demonstration in History”, Columbus citizens were up before dawn on that Monday morning, consumed in riotous celebration. At least 200,000 people marched through the streets of Downtown on Armistice Day, the crowd completely ignoring the ongoing Spanish Flu pandemic. An article on the event described the scene in poetic detail:

The lid that throttled pentup enthusiasm during the last few fateful days was blown off with a bang. Bellowing whistles, screeching sirens and jubilant shouts of early risers ushered in the greatest Monday in the world’s history. With each passing minute the pandemonium became greater.
An expanding, bulging, distending, heaving, heightening, thrilling crowd that by mid-morning numbered itself in the thousands, swirled, swayed and twisted itself in one long line of humanity through the ins and outs of High Street.
From every nook and cranny of the city’s far-lying borders came added increments of men, women and children, mad with joy, delirious with triumph, exalted as never before.

Armistice Day in Columbus.

The Armistice being celebrated on High Street, November 11, 1918.

WWI had lasted from July 28, 1914 to November 11, 1918 and had taken about 20 million lives.


The Week in Review 3


The Week in Review 3 includes some big news that has me very excited. The Columbus Metropolitan Library announced that it had reached an agreement with The Columbus Dispatch and its parent company to purchase the rights to its entire newspaper collection, which it will make available in digital form on its website as early as November. The Columbus Dispatch has been publishing since 1871, but the library has had Dispatch content from 1985-present only, and only in text format for a limited number of articles. The agreement will allow the library to offer every issue of the paper online since 1871 in its entirety, including its enormous photograph collection.
This is an massive win and game-changer for researchers and history buffs alike. This information has largely been difficult to access. Microfilm at the library was impossible to search through unless you knew the exact date of an article. The digital collection will allow for easy searching for any content with just a simple search box, as it has with its other digital collections.

The other news this week was the ongoing saga with the North Market Tower project. A few weeks back, I posted renderings that were released, perhaps be accident, on an architect’s website. Well, this week we saw yet another rendering, seen below:

All I can say is… I hope to god this isn’t the final design. Not only is it shorter (and the planners promised that the project would absolutely NOT be reduced in height regardless of the final design), but it has none of the interesting architecture of any previous renderings. It’s just another box on top of another box. I call this style Modern Vanilla. It’s so painfully boring and architecturally sterile that to see this being built would remove all the excitement from this project. The height reduction would be pure Columbus.

The Week in Review 2


In Week in Review 2, we find that the FBI has finally released the full crime numbers for 2017 for all cities. How did Columbus fare? Well, it was a decidedly mixed bag. Total murders were their highest ever, at 143, but the rate fell quite short of the record set back in 1991. So far for 2018, murder is behind 2017’s rate by about 22%, so it’s a good improvement, but still not even close to where it should be.

Other violent crime figures 2016 to 2017
-Rape continued its multi-year rise in the city, reaching 919 incidents. This was a 6% increase over 2016.
-Assaults were up 4% over 2016, but in the context of still being one of the lowest totals in the past 30 years.
-Robberies were down almost 8.5% over 2016.
-Despite the rises in most types of violent crime, the drop in robberies meant overall violent crime dropped by about 0.5%.
Property crime figures 2016 to 2017
-Burglaries were down more than 8%.
-Larceny thefts were down about 2.9%
-Motor vehicle thefts were up 17.6%, so not a good trend, but still less than half the rate it was 15-20 years ago.
-Overall property crime was down about 2% versus 2016.

And if you think this year’s been particularly wet, you are right! Through October 1st, Columbus is having its 3rd wettest year on record. Only 1882 and 1890 are ahead of 2018 at this point, and by barely 1″. 2018 at this point is running almost 14″ above normal.
Top 10 Wettest Years Through October 1st
1. 1882: 44.55″
2. 1890: 43.56″
3. 2018: 43.31″
4. 1979: 42.17″
5. 2003: 41.58″
6. 2011: 41.12″
7. 1990: 39.10″
8. 1949: 38.54″
9. 2004: 38.46″
10. 1996: 37.46″
It is surprising how many recent years are on this list. Still with 3 months to go, the pattern could break, but it’s very unlikely that 2018 doesn’t end up in the top 10. Here are the top 10 wettest full years.
1. 2011: 54.96″
2. 1990: 53.16″
3. 1882: 51.30″
4. 1890: 50.73″
5. 2004: 49.27″
6. 1979: 49.17″
7. 2003: 49.03″
8. 1883: 48.88″
9. 1881: 46.99″
10. 2017: 46.61″

I guess it could always be worse…
The week in review 2 Columbus, Ohio