In this first Week in Review series, we will do a quick rundown of the past week in Columbus.
First, in terms of development, we had a few updates. -The Market Tower project at the North Market has apparently gotten a new design. It’s gone from this-
To this-
The new design may actually be at least 40 stories instead of the originally-proposed 35. No official announcements on the height increase have been released, but I suspect we’ll be hearing something soon on this.
-The Gravity 2.0 project in Franklinton got its initial approvals from the neighborhood development commission, including approval on the 12-story tower, which has also gotten an updated rendering, seen below.
Given that the 2017 demographic information was released yesterday by the US Census, it’s time to revisit this Columbus foreign-born population comparison and update it with the new data.
First up, let’s take a look at total foreign-born populations. I have looked at this topic some in the past, but I have never done a full-scale comparison for this topic.
Total Foreign-Born Population Rank by City 2000, 2010 and 2017 2000—————————————-2010———————————-2017 1. Chicago, IL: 628,903———–1. Chicago: 557,674—————1. Chicago: 563,688 2. San Jose, CA: 329,750——–2. San Jose: 366,194————-2. San Jose: 417,148 3. San Antonio, TX: 133,675—-3. San Antonio: 192,741———-3. San Antonio: 212,109 4. Austin, TX: 109,006————4. Austin: 148,431——————4. Austin: 177,844 5. Las Vegas, NV: 90,656——-5. Las Vegas: 130,503————-5. Charlotte: 147,074 6. Sacramento, CA: 82,616—–6. Chalotte: 106,047—————6. Las Vegas: 139,790 7. Portland, OR: 68,976———7. Sacramento: 96,105————-7. Sacramento: 111,904 8. Charlotte, NC: 59,849——–8. Columbus: 86,663—————-8. Columbus: 105,826 9. Minneapolis, MN: 55,475—–9. Portland: 83,026—————–9. Indianapolis: 89,465 10. Columbus: 47,713———–10. Indianapolis: 74,407———–10. Portland: 89,050 11. Milwaukee, WI: 46,122—–11. Nashville: 73,327—————11. Nashville: 86,271 12. Detroit, MI: 45,541———–12. Minneapolis: 57,846———–12. Minneapolis: 69,567 13. Providence, RI: 43,947—–13. Milwaukee: 57,222————-13. Orlando: 68,811 14. St. Paul, MN: 41,138——-14. Providence: 52,920————14. St. Paul: 64,056 15. Nashville, TN: 38,936——-15. St. Paul: 50,366—————-15. Milwaukee: 59,443 16. Indianapolis, IN: 36,067—-16. Orlando: 43,747—————-16. Providence: 54,520 17. Virginia Beach, VA: 28,276–17. Virginia Beach: 40,756—–17. Omaha: 51,041 18. Wichita, KS: 27,938———18. Omaha: 39,288—————18. Virginia Beach: 42,319 19. Orlando, FL: 26,741——–19. Wichita: 39,128—————–19. Detroit: 41,374 20. Omaha, NE: 25,687———-20. Kansas City: 35,532———20. Wichita: 40,427 21. Kansas City, MO: 25,632—21. Detroit: 34,307—————-21. Kansas City: 37,833 22. Cleveland: 21,372————22. Madison: 24,929————–22. Madison: 32,066 23. Grand Rapids, MI: 20,814—23. St. Louis: 23,011————23. Des Moines: 29,876 24. St Louis, MO: 19,542——–24. Lincoln: 22,214—————24. Pittsburgh:26,504 25. Pittsburgh, PA: 18,874——-25. Des Moines: 20,798——–25. Grand Rapids: 26,014 26. Madison, WI: 18,792———26. Pittsburgh: 18,698———–26. Lincoln: 25,689 27. Des Moines, IA: 15,713—–27. Cleveland: 17,739————27. St. Louis: 23,659 28. Lincoln, NE: 13,246———-28. Grand Rapids: 16,615——-28. Fort Wayne: 22,186 29. Cincinnati: 12,461————29. Cincinnati: 16,531————29. Cleveland: 21,992 30. Fort Wayne, IN: 10,187—–30. Fort Wayne: 15,286———30. Cincinnati: 19,085 31. Toledo: 9,475——————31. Toledo: 11,159—————31. Akron: 13,423 32. Akron: 6,911——————-32. Akron: 8,524——————-32. Toledo: 11,260 33. Dayton: 3,245—————–33. Dayton: 5,102——————33. Dayton: 6,743 34. Youngstown: 1,605———-34. Youngstown: 3,695———–34. Youngstown: 1,401
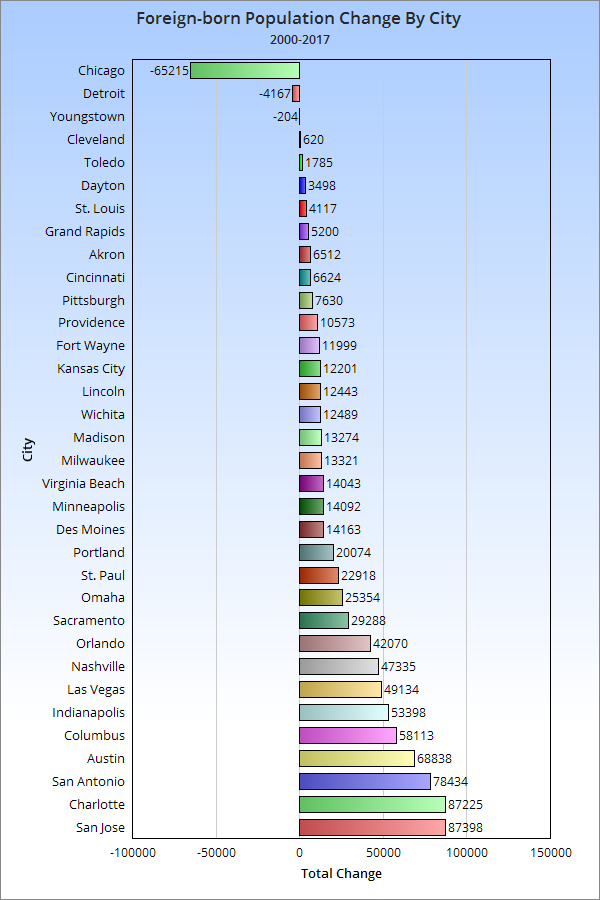
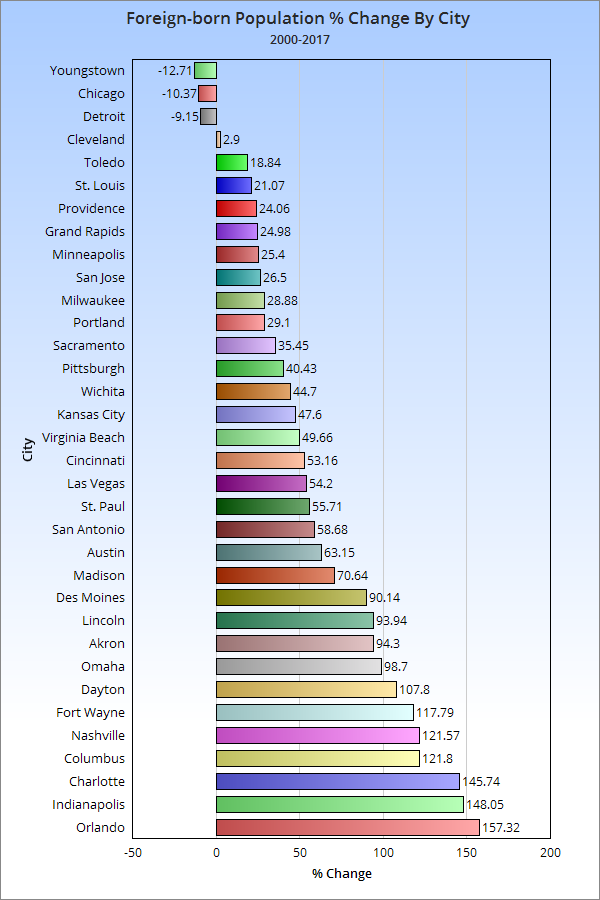
Here’s the 2000-2017 total change. And the 2000-2017 change by %.
So Columbus has had above average total and % growth compared to its peers nationally since 2000. What about more recently?
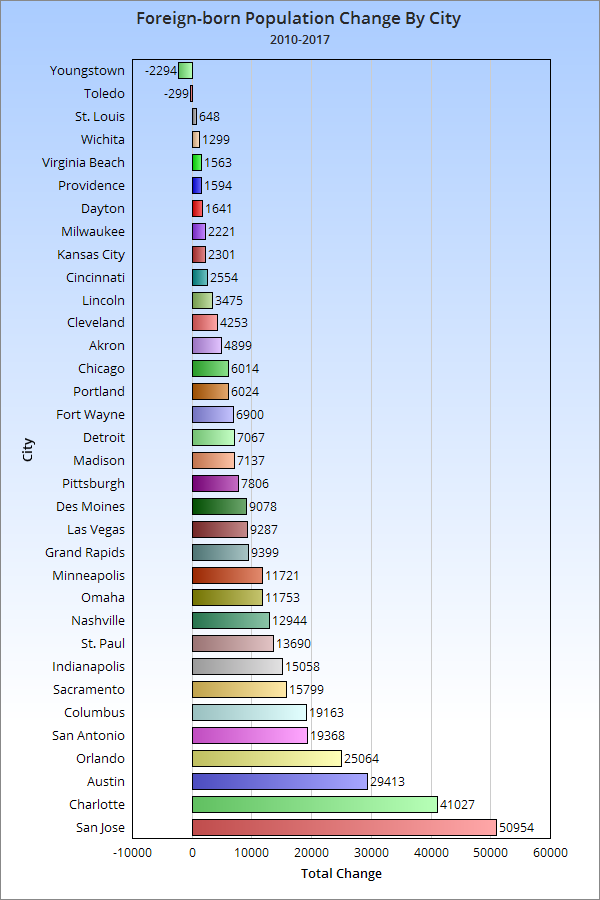
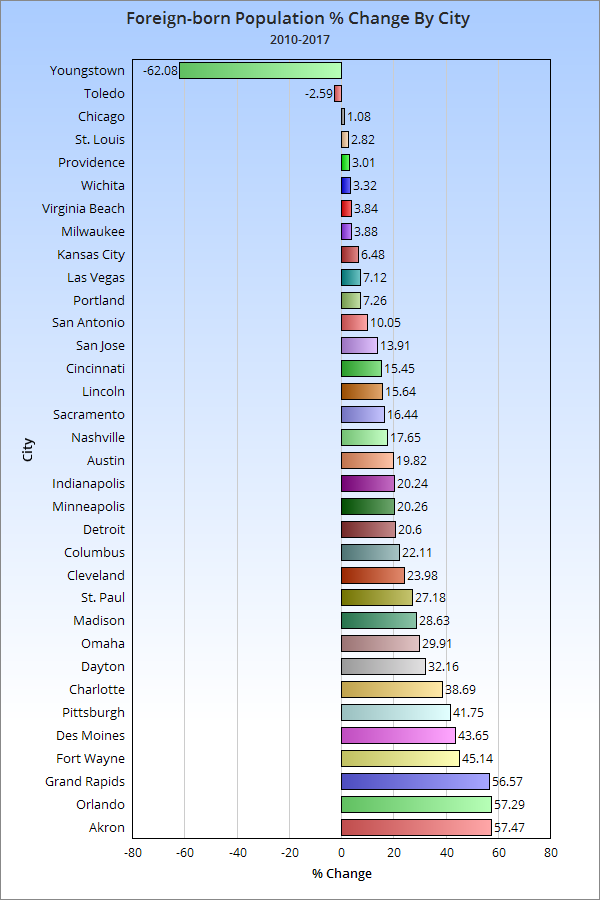
Total change 2010-2017. And the 2010-2017 change by %. So now that we know how many foreign-born immigrants are arriving, let’s take a look at where they are coming from.
Total Foreign-Born Residents From Europe in 2000 and 2017 2000———————————————–2017 1. Chicago: 145,462———————1. Chicago: 96,656 2. San Jose: 21,904———————2. San Jose: 25,147 3. Portland: 17,572———————-3. Portland: 16,548 4. Las Vegas: 9,070———————4. Austin: 13,337 5. Cleveland: 8,796———————-5. Charlotte: 9,775 6. St. Louis: 8,543———————–6. Las Vegas: 8,536 7. San Antonio: 8,323——————7. San Antonio: 7,852 8. Sacramento: 8,204——————8. Virginia Beach: 7,368 9. Milwaukee: 7,841——————–9. Columbus: 6,860 10. Charlotte: 7,487——————–10. Indianapolis: 6,344 11. Austin: 7,474————————11. Sacramento: 6,008 12. Pittsburgh: 7,413——————-12. Nashville: 5,778 13. Columbus: 7,017——————-13. Orlando: 5,516 14. Indianapolis: 6,543—————-14. Minneapolis: 5,477 15. Virginia Beach: 6,333————-15. Milwaukee: 4,388 16. Detroit: 5,600————————16. Pittsburgh: 4,265 17. Minneapolis: 5,409—————–17. Providence: 4,022 18. Providence: 5,126——————18. Lincoln: 3,908 19. Nashville: 4,859——————–19. St. Louis: 3,680 20. Cincinnati: 3,851——————-20. Cincinnati: 3,556 21. Grand Rapids: 3,396————–21. Omaha: 3,483 22. Omaha: 3,320———————–22. Cleveland: 3,399 23. St. Paul: 3,255———————-23. Kansas City: 3,362 24. Des Moines: 3,216—————-24. Madison: 2,867 25. Kansas City: 2,985—————-25. St. Paul: 2,394 26. Madison: 2,871——————–26. Detroit: 2,393 27. Lincoln: 2,701———————-27. Fort Wayne: 2,388 28. Akron: 2,687———————–28. Des Moines: 2,156 29. Orlando: 2,509——————–29. Wichita: 1,660 30. Fort Wayne: 2,076—————30. Grand Rapids: 1,517 31. Toledo: 2,020———————31. Akron: 1,286 32. Wichita: 2,004———————32. Toledo: 1,242 33. Dayton: 901———————–33. Dayton: 877 34. Youngstown: 870—————-34. Youngstown: 173
Columbus had a high number of Europeans versus most peers, but almost all cities saw drops in this demographic between 2000 and 2017, some quite drastic. Columbus’ drop was relatively minor.
Total Foreign-born Population from Asia 2000 and 2017 2000————————————————–2017 1. San Jose: 182,712—————————1. San Jose: 262,208 2. Chicago: 112,932—————————-2. Chicago: 140,434 3. Sacramento: 40,253————————-3. Austin: 57,584 4. Portland: 26,271——————————4. Sacramento: 53,731 5. Austin: 25,036——————————–5. Charlotte: 46,698 6. St. Paul: 23,245——————————6. Columbus: 43,706 7. Columbus: 22,354—————————7. San Antonio: 40,642 8. Minneapolis: 17,376————————8. Portland: 38,224 9. Las Vegas: 17,062————————–9. Las Vegas: 35,087 10. San Antonio: 15,840———————-10. St. Paul: 34,678 11. Charlotte: 15,734————————–11. Nashville: 26,155 12. Virginia Beach: 15,176——————-12. Indianapolis: 23,934 13. Detroit: 15,114——————————13. Virginia Beach: 23,625 14. Nashville: 12,573—————————14. Madison: 18,795 15. Milwaukee: 12,114————————-15. Detroit: 18,681 16. Wichita: 10,826—————————–16. Milwaukee: 17,838 17. Madison: 9,736—————————–17. Minneapolis: 15,967 18. Indianapolis: 9,190————————-18. Pittsburgh: 15,873 19. Pittsburgh: 7,938—————————-19. Wichita: 15,466 20. Providence: 7,871————————–20. Omaha: 14,504 21. Kansas City: 7,312————————-21. Lincoln: 13,804 22. Lincoln: 6,691——————————-22. Kansas City: 12,043 23. St. Louis: 6,425—————————–23. Fort Wayne: 10,972 24. Omaha: 6,302——————————-24. Des Moines: 10,691 25. Cleveland: 6,213—————————25. St. Louis: 9,632 26. Des Moines: 5,239————————26. Orlando: 8,122 27. Orlando: 4,530—————————–27. Akron: 7,862 28. Cincinnati: 4,326————————–28. Cleveland: 7,450 29. Toledo: 3,847——————————29. Providence: 6,668 30. Grand Rapids: 3,206———————30. Grand Rapids: 6,585 31. Akron: 3,099——————————-31. Toledo: 6,196 32. Fort Wayne: 2,792————————32. Cincinnati: 6,002 33. Dayton: 903———————————33. Dayton: 1,614 34. Youngstown: 338————————–34. Youngstown: 448
Columbus ranks even higher with its foreign-born Asian population.
Total Foreign-born Population from Africa 2000 and 2017 2000—————————————————2017 1. Minneapolis: 12,765——————–1. Columbus: 33,607 2. Chicago: 12,613————————-2. Chicago: 26,995 3. Columbus: 9,530————————3. Minneapolis: 25,286 4. San Jose: 5,189————————-4. Nashville: 18,387 5. Charlotte: 4,722————————–5. Charlotte: 18,234 6. St. Paul: 4,697—————————-6. Indianapolis: 17,452 7. Nashville: 4,183————————–7. St. Paul: 15,926 8. Detroit: 3,249—————————–8. Omaha: 7,496 9. Providence: 3,138———————–9. San Jose: 7,400 10. Indianapolis: 2,650——————–10. Portland: 7,059 11. Portland: 2,430————————-11. Austin: 6,469 12. Austin: 2,263—————————-12. Des Moines: 6,124 13. Kansas City: 2,192——————–13. San Antonio: 5,718 14. Cincinnati: 1,781———————–14. Kansas City: 5,051 15. St. Louis: 1,500————————-15. St. Louis: 4,977 16. Omaha: 1,497—————————16. Providence: 4,697 17. San Antonio: 1,358——————–17. Milwaukee: 4,423 18. Milwaukee: 1,332———————-18. Cincinnati: 4,207 19. Cleveland: 1,075———————–19. Grand Rapids: 3,754 20. Sacramento: 1,051——————–20. Sacramento: 2,955 21. Des Moines: 1,038——————–21. Pittsburgh: 2,731 22. Madison: 991—————————22. Cleveland: 2,728 23. Orlando: 983—————————23. Orlando: 2,552 24. Wichita: 946—————————-24. Akron: 2,311 25. Las Vegas: 916———————–25. Madison: 2,180 26. Pittsburgh: 905————————26. Wichita: 2,142 27. Virginia Beach: 840——————27. Las Vegas: 1,846 28. Grand Rapids: 718——————-28. Lincoln: 1,680 29. Toledo: 638—————————-29. Dayton: 1,397 30. Lincoln: 637—————————30. Detroit: 1,082 31. Dayton: 522—————————-31. Virginia Beach: 847 32. Fort Wayne: 384———————-32. Fort Wayne: 628 33. Akron: 197—————————–33. Toledo: 615 34. Youngstown: 50———————-34. Youngstown: 0
Columbus has claimed the number 1 spot in its foreign-born African population, passing previous top city Minneapolis.
And finally, the total foreign-born population from the Americas in 2000 and 2017 2000—————————————————-2017 1. Chicago: 357,235————————–1. Chicago: 297,926 2. San Jose: 117,989————————2. San Antonio: 157,629 3. San Antonio: 107,906——————–3. San Jose: 120,657 4. Austin: 73,935——————————4. Austin: 99,482 5. Las Vegas: 63,277————————5. Las Vegas: 93,693 6. Charlotte: 31,625————————–6. Charlotte: 72,211 7. Sacramento: 28,927———————-7. Orlando: 52,421 8. Providence: 27,649———————–8. Sacramento: 42,632 9. Milwaukee: 24,781————————9. Indianapolis: 41,554 10. Detroit: 21,527—————————10. Providence: 39,093 11. Portland: 20,939————————-11. Nashville: 35,719 12. Minneapolis: 19,648——————–12. Milwaukee: 32,630 13. Orlando: 18,639————————-13. Portland: 25,417 14. Indianapolis: 17,530——————–14. Omaha: 25,385 15. Nashville: 17,125————————15. Minneapolis: 22,688 16. Omaha: 14,467————————–16. Columbus: 21,578 17. Wichita: 13,988—————————17. Wichita: 20,983 18. Grand Rapids: 13,477——————18. Detroit: 19,143 19. Kansas City: 12,948———————19. Kansas City: 17,377 20. St. Paul: 9,804—————————-20. Grand Rapids: 14,158 21. Columbus: 8,596————————21. St. Paul: 10,878 22. Des Moines: 6,201———————-22. Des Moines: 10,627 23. Virginia Beach: 5,754——————23. Virginia Beach: 10,415 24. Cleveland: 5,192————————24. Cleveland: 8,386 25. Madison: 5,080————————–25. Fort Wayne: 8,198 26. Fort Wayne: 4,930———————-26. Madison: 8,031 27. Lincoln: 3,106—————————-27. Lincoln: 6,190 28. St. Louis: 2,961————————–28. Cincinnati: 5,320 29. Toledo: 2,942—————————-29. St. Louis: 5,008 30. Pittsburgh: 2,463————————30. Pittsburgh: 3,443 31. Cincinnati: 2,432————————31. Toledo: 3,207 32. Dayton: 919——————————32. Dayton: 2,855 33. Akron: 891——————————-33. Akron: 1,699 34. Youngstown: 333———————–34. Youngstown: 780
Columbus does the worst with this group, but even here it moved up 5 spots in the rankings.
The rest of the foreign-born population is made up of small groups of people from Oceania- or basically island nations.
Okay, so a link on Census record transcribing may not be the coolest I’ve put on this site, but it may be one of the most important. The US Census records go back all the way to the 1700s, and a lot of these records have either not been digitized at all, or only rough copies exist in many different formats. Due to age, use, insect and water damage, etc., some of these records are in danger of disappearing forever. Many others are difficult to use because of the varying formats. Because of this, transcribing them into a standardized digital form is critical. This site allows anyone from the general public to choose individual records and volunteer to transcribe them digitally. No experience necessary! The site gives basic walkthroughs and other how-to information, so anyone can do it, and at their own speed in their free time. Just click on the state and area of your choice and go from there.
So once again, 2017 Ohio city population estimates came out today from the Census. As has been the case for a long time now, Columbus is rocketing upward at record pace. The 2016 comparison numbers have been adjusted by the Census for the 2017 update.
Some milestones include Grove City and Lancaster passing 40,000 for the first time and Johnstown passing the 5,000 mark. 11 places lost population, 8 stayed the same and 83 gained population. The growing portions of the Columbus metro continue to encompass the vast majority of incorporated places.
Nationally, here were the top 20 fastest-growing cities by numerical change between July 1, 2016 and July 1, 2017 1. San Antonio, Texas: +24,208 2. Phoenix, Arizona: 24,036 3. Dallas, Texas: +18,935 4. Fort Worth, Texas: +18,664 5. Los Angeles: 18,643 6. Seattle, Washington: +17,490 7. Charlotte, North Carolina: +15,551 8. Columbus: +15,429 9. Frisco, Texas: +13,470 10. Atlanta, Georgia: +13,323 11. San Diego, California: +12,834 12. Austin, Texas: +12,515 13. Jacksonville, Florida: +11,169 14. Irvine, California: +11,068 15. Henderson, Nevada: +10,534 16. Las Vegas, Nevada: 9,966 17. Denver, Colorado: 9,844 18. Washington, DC: 9,636 19. Tampa, Florida: 9,383 20. Mesa, Arizona: 9,025
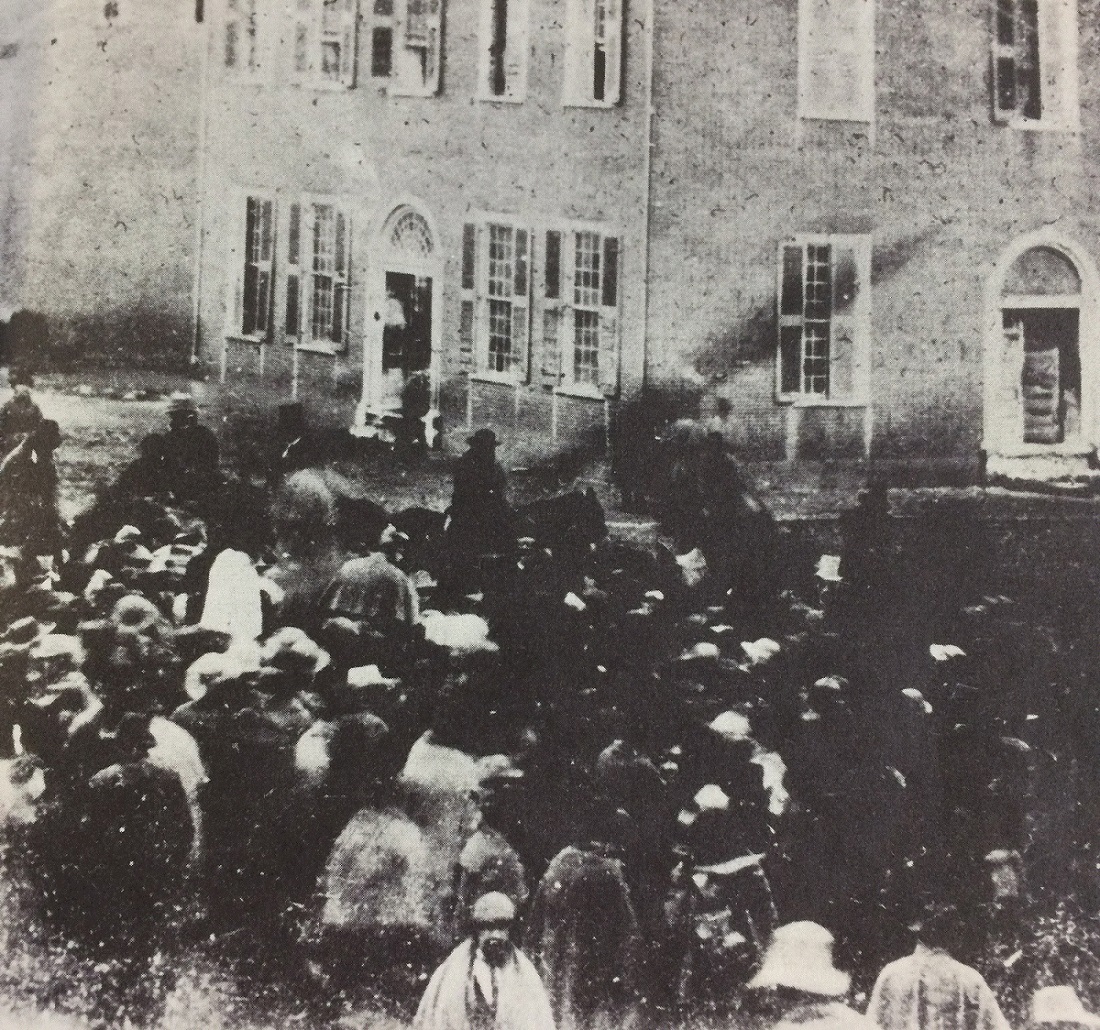
Photo Location: Broad and High Photo Date: Sometime in 1849 Photo History: Random Columbus photo 5 is one of the earliest ever known to have been taken in Columbus, and shows a group of bystanders looking at several people on horseback. The year this was taken, 1849, is significant in that it references the events taking place. 1849, of course, was the year that gold was discovered in California. The men on horseback are 49-ers, getting ready to depart Columbus to join the great California Gold Rush, and the crowd was gathered to see them off.
Click on the image for a better look.
Unfortunately, not much else is known about the photo, who the people were, or in what direction the photo was even taken.