100 years ago today, World War 1 came to an end. Known as the Armistice, the agreement was officially completed on November 11, 1918. As in the rest of the nation, the mood in Columbus was celebratory. In what was then said to be the “Greatest Demonstration in History”, Columbus citizens were up before dawn on that Monday morning, consumed in riotous celebration. At least 200,000 people marched through the streets of Downtown on Armistice Day, the crowd completely ignoring the ongoing Spanish Flu pandemic. An article on the event described the scene in poetic detail:
The lid that throttled pentup enthusiasm during the last few fateful days was blown off with a bang. Bellowing whistles, screeching sirens and jubilant shouts of early risers ushered in the greatest Monday in the world’s history. With each passing minute the pandemonium became greater. An expanding, bulging, distending, heaving, heightening, thrilling crowd that by mid-morning numbered itself in the thousands, swirled, swayed and twisted itself in one long line of humanity through the ins and outs of High Street. From every nook and cranny of the city’s far-lying borders came added increments of men, women and children, mad with joy, delirious with triumph, exalted as never before.
The Armistice being celebrated on High Street, November 11, 1918.
WWI had lasted from July 28, 1914 to November 11, 1918 and had taken about 20 million lives.
The Week in Review 3 includes some big news that has me very excited. The Columbus Metropolitan Library announced that it had reached an agreement with The Columbus Dispatch and its parent company to purchase the rights to its entire newspaper collection, which it will make available in digital form on its website as early as November. The Columbus Dispatch has been publishing since 1871, but the library has had Dispatch content from 1985-present only, and only in text format for a limited number of articles. The agreement will allow the library to offer every issue of the paper online since 1871 in its entirety, including its enormous photograph collection. This is an massive win and game-changer for researchers and history buffs alike. This information has largely been difficult to access. Microfilm at the library was impossible to search through unless you knew the exact date of an article. The digital collection will allow for easy searching for any content with just a simple search box, as it has with its other digital collections.
The other news this week was the ongoing saga with the North Market Tower project. A few weeks back, I posted renderings that were released, perhaps be accident, on an architect’s website. Well, this week we saw yet another rendering, seen below:
All I can say is… I hope to god this isn’t the final design. Not only is it shorter (and the planners promised that the project would absolutely NOT be reduced in height regardless of the final design), but it has none of the interesting architecture of any previous renderings. It’s just another box on top of another box. I call this style Modern Vanilla. It’s so painfully boring and architecturally sterile that to see this being built would remove all the excitement from this project. The height reduction would be pure Columbus.
In Week in Review 2, we find that the FBI has finally released the full crime numbers for 2017 for all cities. How did Columbus fare? Well, it was a decidedly mixed bag. Total murders were their highest ever, at 143, but the rate fell quite short of the record set back in 1991. So far for 2018, murder is behind 2017’s rate by about 22%, so it’s a good improvement, but still not even close to where it should be.
Other violent crime figures 2016 to 2017 -Rape continued its multi-year rise in the city, reaching 919 incidents. This was a 6% increase over 2016. -Assaults were up 4% over 2016, but in the context of still being one of the lowest totals in the past 30 years. -Robberies were down almost 8.5% over 2016. -Despite the rises in most types of violent crime, the drop in robberies meant overall violent crime dropped by about 0.5%. Property crime figures 2016 to 2017 -Burglaries were down more than 8%. -Larceny thefts were down about 2.9% -Motor vehicle thefts were up 17.6%, so not a good trend, but still less than half the rate it was 15-20 years ago. -Overall property crime was down about 2% versus 2016.
And if you think this year’s been particularly wet, you are right! Through October 1st, Columbus is having its 3rd wettest year on record. Only 1882 and 1890 are ahead of 2018 at this point, and by barely 1″. 2018 at this point is running almost 14″ above normal. Top 10 Wettest Years Through October 1st 1. 1882: 44.55″ 2. 1890: 43.56″ 3. 2018: 43.31″ 4. 1979: 42.17″ 5. 2003: 41.58″ 6. 2011: 41.12″ 7. 1990: 39.10″ 8. 1949: 38.54″ 9. 2004: 38.46″ 10. 1996: 37.46″ It is surprising how many recent years are on this list. Still with 3 months to go, the pattern could break, but it’s very unlikely that 2018 doesn’t end up in the top 10. Here are the top 10 wettest full years. 1. 2011: 54.96″ 2. 1990: 53.16″ 3. 1882: 51.30″ 4. 1890: 50.73″ 5. 2004: 49.27″ 6. 1979: 49.17″ 7. 2003: 49.03″ 8. 1883: 48.88″ 9. 1881: 46.99″ 10. 2017: 46.61″
In this first Week in Review series, we will do a quick rundown of the past week in Columbus.
First, in terms of development, we had a few updates. -The Market Tower project at the North Market has apparently gotten a new design. It’s gone from this-
To this-
The new design may actually be at least 40 stories instead of the originally-proposed 35. No official announcements on the height increase have been released, but I suspect we’ll be hearing something soon on this.
-The Gravity 2.0 project in Franklinton got its initial approvals from the neighborhood development commission, including approval on the 12-story tower, which has also gotten an updated rendering, seen below.
Given that the 2017 demographic information was released yesterday by the US Census, it’s time to revisit this Columbus foreign-born population comparison and update it with the new data.
First up, let’s take a look at total foreign-born populations. I have looked at this topic some in the past, but I have never done a full-scale comparison for this topic.
Total Foreign-Born Population Rank by City 2000, 2010 and 2017 2000—————————————-2010———————————-2017 1. Chicago, IL: 628,903———–1. Chicago: 557,674—————1. Chicago: 563,688 2. San Jose, CA: 329,750——–2. San Jose: 366,194————-2. San Jose: 417,148 3. San Antonio, TX: 133,675—-3. San Antonio: 192,741———-3. San Antonio: 212,109 4. Austin, TX: 109,006————4. Austin: 148,431——————4. Austin: 177,844 5. Las Vegas, NV: 90,656——-5. Las Vegas: 130,503————-5. Charlotte: 147,074 6. Sacramento, CA: 82,616—–6. Chalotte: 106,047—————6. Las Vegas: 139,790 7. Portland, OR: 68,976———7. Sacramento: 96,105————-7. Sacramento: 111,904 8. Charlotte, NC: 59,849——–8. Columbus: 86,663—————-8. Columbus: 105,826 9. Minneapolis, MN: 55,475—–9. Portland: 83,026—————–9. Indianapolis: 89,465 10. Columbus: 47,713———–10. Indianapolis: 74,407———–10. Portland: 89,050 11. Milwaukee, WI: 46,122—–11. Nashville: 73,327—————11. Nashville: 86,271 12. Detroit, MI: 45,541———–12. Minneapolis: 57,846———–12. Minneapolis: 69,567 13. Providence, RI: 43,947—–13. Milwaukee: 57,222————-13. Orlando: 68,811 14. St. Paul, MN: 41,138——-14. Providence: 52,920————14. St. Paul: 64,056 15. Nashville, TN: 38,936——-15. St. Paul: 50,366—————-15. Milwaukee: 59,443 16. Indianapolis, IN: 36,067—-16. Orlando: 43,747—————-16. Providence: 54,520 17. Virginia Beach, VA: 28,276–17. Virginia Beach: 40,756—–17. Omaha: 51,041 18. Wichita, KS: 27,938———18. Omaha: 39,288—————18. Virginia Beach: 42,319 19. Orlando, FL: 26,741——–19. Wichita: 39,128—————–19. Detroit: 41,374 20. Omaha, NE: 25,687———-20. Kansas City: 35,532———20. Wichita: 40,427 21. Kansas City, MO: 25,632—21. Detroit: 34,307—————-21. Kansas City: 37,833 22. Cleveland: 21,372————22. Madison: 24,929————–22. Madison: 32,066 23. Grand Rapids, MI: 20,814—23. St. Louis: 23,011————23. Des Moines: 29,876 24. St Louis, MO: 19,542——–24. Lincoln: 22,214—————24. Pittsburgh:26,504 25. Pittsburgh, PA: 18,874——-25. Des Moines: 20,798——–25. Grand Rapids: 26,014 26. Madison, WI: 18,792———26. Pittsburgh: 18,698———–26. Lincoln: 25,689 27. Des Moines, IA: 15,713—–27. Cleveland: 17,739————27. St. Louis: 23,659 28. Lincoln, NE: 13,246———-28. Grand Rapids: 16,615——-28. Fort Wayne: 22,186 29. Cincinnati: 12,461————29. Cincinnati: 16,531————29. Cleveland: 21,992 30. Fort Wayne, IN: 10,187—–30. Fort Wayne: 15,286———30. Cincinnati: 19,085 31. Toledo: 9,475——————31. Toledo: 11,159—————31. Akron: 13,423 32. Akron: 6,911——————-32. Akron: 8,524——————-32. Toledo: 11,260 33. Dayton: 3,245—————–33. Dayton: 5,102——————33. Dayton: 6,743 34. Youngstown: 1,605———-34. Youngstown: 3,695———–34. Youngstown: 1,401
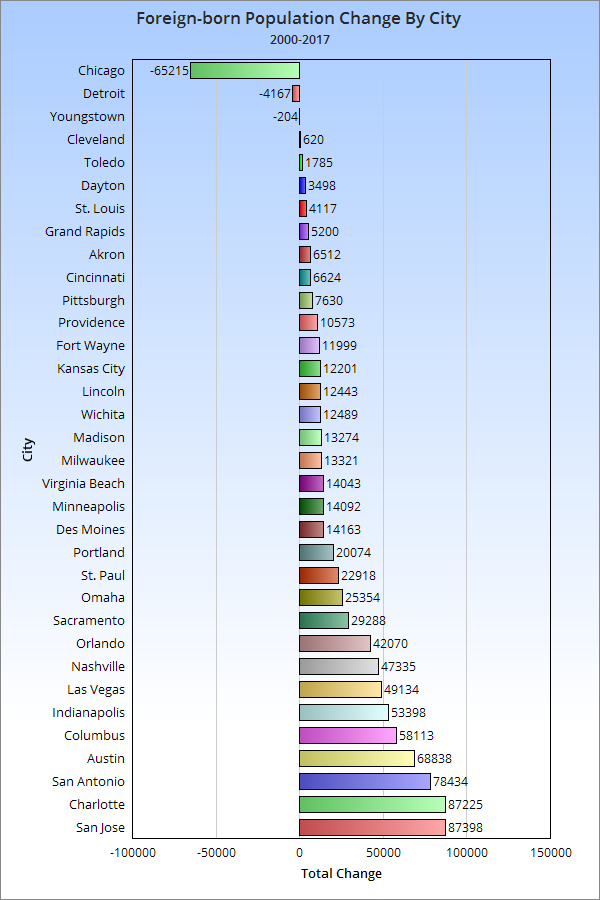
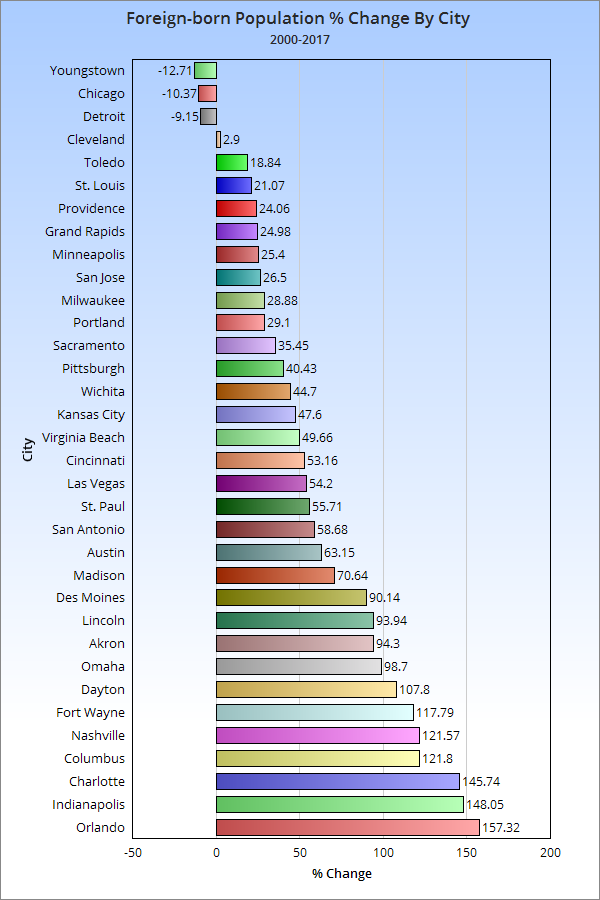
Here’s the 2000-2017 total change. And the 2000-2017 change by %.
So Columbus has had above average total and % growth compared to its peers nationally since 2000. What about more recently?
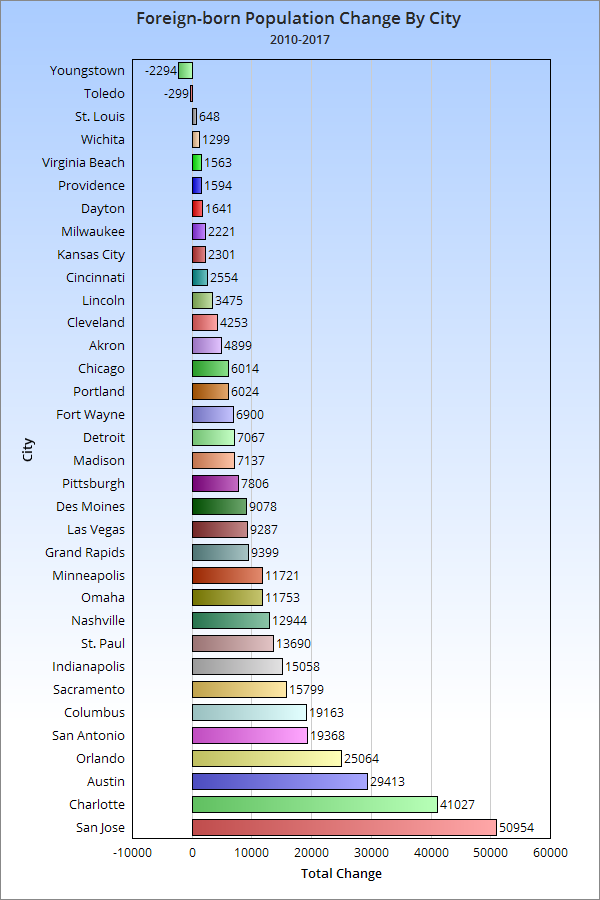
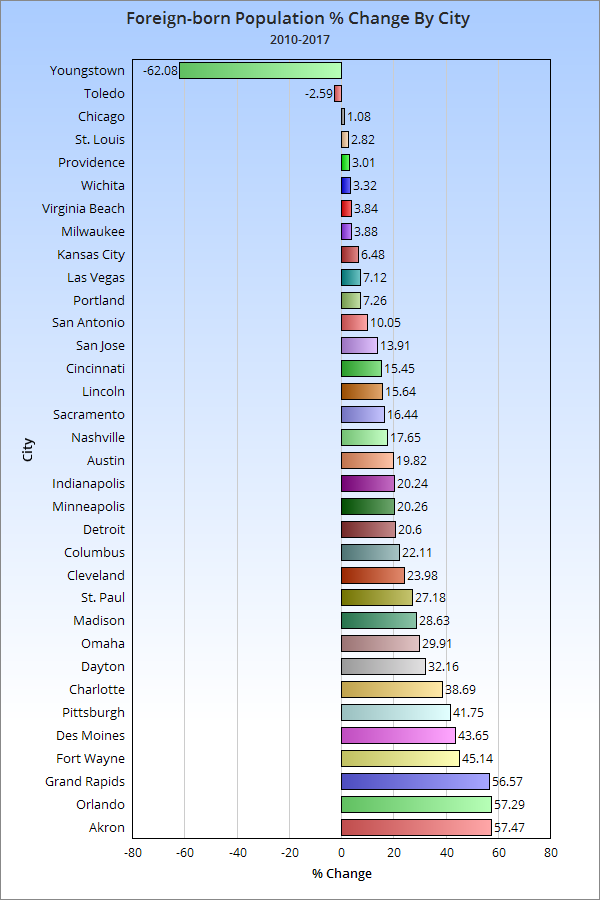
Total change 2010-2017. And the 2010-2017 change by %. So now that we know how many foreign-born immigrants are arriving, let’s take a look at where they are coming from.
Total Foreign-Born Residents From Europe in 2000 and 2017 2000———————————————–2017 1. Chicago: 145,462———————1. Chicago: 96,656 2. San Jose: 21,904———————2. San Jose: 25,147 3. Portland: 17,572———————-3. Portland: 16,548 4. Las Vegas: 9,070———————4. Austin: 13,337 5. Cleveland: 8,796———————-5. Charlotte: 9,775 6. St. Louis: 8,543———————–6. Las Vegas: 8,536 7. San Antonio: 8,323——————7. San Antonio: 7,852 8. Sacramento: 8,204——————8. Virginia Beach: 7,368 9. Milwaukee: 7,841——————–9. Columbus: 6,860 10. Charlotte: 7,487——————–10. Indianapolis: 6,344 11. Austin: 7,474————————11. Sacramento: 6,008 12. Pittsburgh: 7,413——————-12. Nashville: 5,778 13. Columbus: 7,017——————-13. Orlando: 5,516 14. Indianapolis: 6,543—————-14. Minneapolis: 5,477 15. Virginia Beach: 6,333————-15. Milwaukee: 4,388 16. Detroit: 5,600————————16. Pittsburgh: 4,265 17. Minneapolis: 5,409—————–17. Providence: 4,022 18. Providence: 5,126——————18. Lincoln: 3,908 19. Nashville: 4,859——————–19. St. Louis: 3,680 20. Cincinnati: 3,851——————-20. Cincinnati: 3,556 21. Grand Rapids: 3,396————–21. Omaha: 3,483 22. Omaha: 3,320———————–22. Cleveland: 3,399 23. St. Paul: 3,255———————-23. Kansas City: 3,362 24. Des Moines: 3,216—————-24. Madison: 2,867 25. Kansas City: 2,985—————-25. St. Paul: 2,394 26. Madison: 2,871——————–26. Detroit: 2,393 27. Lincoln: 2,701———————-27. Fort Wayne: 2,388 28. Akron: 2,687———————–28. Des Moines: 2,156 29. Orlando: 2,509——————–29. Wichita: 1,660 30. Fort Wayne: 2,076—————30. Grand Rapids: 1,517 31. Toledo: 2,020———————31. Akron: 1,286 32. Wichita: 2,004———————32. Toledo: 1,242 33. Dayton: 901———————–33. Dayton: 877 34. Youngstown: 870—————-34. Youngstown: 173
Columbus had a high number of Europeans versus most peers, but almost all cities saw drops in this demographic between 2000 and 2017, some quite drastic. Columbus’ drop was relatively minor.
Total Foreign-born Population from Asia 2000 and 2017 2000————————————————–2017 1. San Jose: 182,712—————————1. San Jose: 262,208 2. Chicago: 112,932—————————-2. Chicago: 140,434 3. Sacramento: 40,253————————-3. Austin: 57,584 4. Portland: 26,271——————————4. Sacramento: 53,731 5. Austin: 25,036——————————–5. Charlotte: 46,698 6. St. Paul: 23,245——————————6. Columbus: 43,706 7. Columbus: 22,354—————————7. San Antonio: 40,642 8. Minneapolis: 17,376————————8. Portland: 38,224 9. Las Vegas: 17,062————————–9. Las Vegas: 35,087 10. San Antonio: 15,840———————-10. St. Paul: 34,678 11. Charlotte: 15,734————————–11. Nashville: 26,155 12. Virginia Beach: 15,176——————-12. Indianapolis: 23,934 13. Detroit: 15,114——————————13. Virginia Beach: 23,625 14. Nashville: 12,573—————————14. Madison: 18,795 15. Milwaukee: 12,114————————-15. Detroit: 18,681 16. Wichita: 10,826—————————–16. Milwaukee: 17,838 17. Madison: 9,736—————————–17. Minneapolis: 15,967 18. Indianapolis: 9,190————————-18. Pittsburgh: 15,873 19. Pittsburgh: 7,938—————————-19. Wichita: 15,466 20. Providence: 7,871————————–20. Omaha: 14,504 21. Kansas City: 7,312————————-21. Lincoln: 13,804 22. Lincoln: 6,691——————————-22. Kansas City: 12,043 23. St. Louis: 6,425—————————–23. Fort Wayne: 10,972 24. Omaha: 6,302——————————-24. Des Moines: 10,691 25. Cleveland: 6,213—————————25. St. Louis: 9,632 26. Des Moines: 5,239————————26. Orlando: 8,122 27. Orlando: 4,530—————————–27. Akron: 7,862 28. Cincinnati: 4,326————————–28. Cleveland: 7,450 29. Toledo: 3,847——————————29. Providence: 6,668 30. Grand Rapids: 3,206———————30. Grand Rapids: 6,585 31. Akron: 3,099——————————-31. Toledo: 6,196 32. Fort Wayne: 2,792————————32. Cincinnati: 6,002 33. Dayton: 903———————————33. Dayton: 1,614 34. Youngstown: 338————————–34. Youngstown: 448
Columbus ranks even higher with its foreign-born Asian population.
Total Foreign-born Population from Africa 2000 and 2017 2000—————————————————2017 1. Minneapolis: 12,765——————–1. Columbus: 33,607 2. Chicago: 12,613————————-2. Chicago: 26,995 3. Columbus: 9,530————————3. Minneapolis: 25,286 4. San Jose: 5,189————————-4. Nashville: 18,387 5. Charlotte: 4,722————————–5. Charlotte: 18,234 6. St. Paul: 4,697—————————-6. Indianapolis: 17,452 7. Nashville: 4,183————————–7. St. Paul: 15,926 8. Detroit: 3,249—————————–8. Omaha: 7,496 9. Providence: 3,138———————–9. San Jose: 7,400 10. Indianapolis: 2,650——————–10. Portland: 7,059 11. Portland: 2,430————————-11. Austin: 6,469 12. Austin: 2,263—————————-12. Des Moines: 6,124 13. Kansas City: 2,192——————–13. San Antonio: 5,718 14. Cincinnati: 1,781———————–14. Kansas City: 5,051 15. St. Louis: 1,500————————-15. St. Louis: 4,977 16. Omaha: 1,497—————————16. Providence: 4,697 17. San Antonio: 1,358——————–17. Milwaukee: 4,423 18. Milwaukee: 1,332———————-18. Cincinnati: 4,207 19. Cleveland: 1,075———————–19. Grand Rapids: 3,754 20. Sacramento: 1,051——————–20. Sacramento: 2,955 21. Des Moines: 1,038——————–21. Pittsburgh: 2,731 22. Madison: 991—————————22. Cleveland: 2,728 23. Orlando: 983—————————23. Orlando: 2,552 24. Wichita: 946—————————-24. Akron: 2,311 25. Las Vegas: 916———————–25. Madison: 2,180 26. Pittsburgh: 905————————26. Wichita: 2,142 27. Virginia Beach: 840——————27. Las Vegas: 1,846 28. Grand Rapids: 718——————-28. Lincoln: 1,680 29. Toledo: 638—————————-29. Dayton: 1,397 30. Lincoln: 637—————————30. Detroit: 1,082 31. Dayton: 522—————————-31. Virginia Beach: 847 32. Fort Wayne: 384———————-32. Fort Wayne: 628 33. Akron: 197—————————–33. Toledo: 615 34. Youngstown: 50———————-34. Youngstown: 0
Columbus has claimed the number 1 spot in its foreign-born African population, passing previous top city Minneapolis.
And finally, the total foreign-born population from the Americas in 2000 and 2017 2000—————————————————-2017 1. Chicago: 357,235————————–1. Chicago: 297,926 2. San Jose: 117,989————————2. San Antonio: 157,629 3. San Antonio: 107,906——————–3. San Jose: 120,657 4. Austin: 73,935——————————4. Austin: 99,482 5. Las Vegas: 63,277————————5. Las Vegas: 93,693 6. Charlotte: 31,625————————–6. Charlotte: 72,211 7. Sacramento: 28,927———————-7. Orlando: 52,421 8. Providence: 27,649———————–8. Sacramento: 42,632 9. Milwaukee: 24,781————————9. Indianapolis: 41,554 10. Detroit: 21,527—————————10. Providence: 39,093 11. Portland: 20,939————————-11. Nashville: 35,719 12. Minneapolis: 19,648——————–12. Milwaukee: 32,630 13. Orlando: 18,639————————-13. Portland: 25,417 14. Indianapolis: 17,530——————–14. Omaha: 25,385 15. Nashville: 17,125————————15. Minneapolis: 22,688 16. Omaha: 14,467————————–16. Columbus: 21,578 17. Wichita: 13,988—————————17. Wichita: 20,983 18. Grand Rapids: 13,477——————18. Detroit: 19,143 19. Kansas City: 12,948———————19. Kansas City: 17,377 20. St. Paul: 9,804—————————-20. Grand Rapids: 14,158 21. Columbus: 8,596————————21. St. Paul: 10,878 22. Des Moines: 6,201———————-22. Des Moines: 10,627 23. Virginia Beach: 5,754——————23. Virginia Beach: 10,415 24. Cleveland: 5,192————————24. Cleveland: 8,386 25. Madison: 5,080————————–25. Fort Wayne: 8,198 26. Fort Wayne: 4,930———————-26. Madison: 8,031 27. Lincoln: 3,106—————————-27. Lincoln: 6,190 28. St. Louis: 2,961————————–28. Cincinnati: 5,320 29. Toledo: 2,942—————————-29. St. Louis: 5,008 30. Pittsburgh: 2,463————————30. Pittsburgh: 3,443 31. Cincinnati: 2,432————————31. Toledo: 3,207 32. Dayton: 919——————————32. Dayton: 2,855 33. Akron: 891——————————-33. Akron: 1,699 34. Youngstown: 333———————–34. Youngstown: 780
Columbus does the worst with this group, but even here it moved up 5 spots in the rankings.
The rest of the foreign-born population is made up of small groups of people from Oceania- or basically island nations.