2018 Columbus and Peer Foreign-Born Comparison


Foreign-born comparison

In the ongoing series discussing topics related to the 2018 Census demographic estimates, today I will update the foreign-born comparison.  Beyond the simple comparison, I will also talk about the regions and countries that the foreign-born populations come from.

Total Foreign-Born Population Rank by City 2010 and 2018
2010————————————-——-2018

1. Chicago: 557,674—————1. Chicago: 540,738
2. San Jose: 366,194————-2. San Jose: 407,839
3. Austin: 148,431—————-3. Austin: 180,544
4. Las Vegas: 130,503———–4. Las Vegas: 133,033
5. Sacramento: 96,105———-5. Columbus: 125,339
6. Columbus: 86,663————-6. Sacramento: 114,786
7. Portland: 83,026—————7. Jacksonville: 111,798
8. Jacksonville: 77,145——–8. Nashville: 95,040
9. Indianapolis: 74,707——–9. Portland: 90,728
10. Nashville: 73,327———-10. Indianapolis: 81,764
11. Minneapolis: 57,846——11. Minneapolis: 68,131
12. Milwaukee: 57,222——–12. St. Paul: 59,381
13. Providence: 52,920——-13. Milwaukee: 57,647
14. St. Paul: 50,366———–14. Omaha: 50,279
15. Virginia Beach: 40,756—15. Providence ;46,995
16. Omaha: 39,288————16. Detroit: 44,520
17. Wichita: 39,128————17. Kansas City: 43,485
18. Kansas City: 35,532——18. Virginia Beach: 43,385
19. Detroit: 34,307————19. Wichita: 42,171
20. Madison: 24,929———20. Madison: 32,622
21. St. Louis: 23,011———-21. Des Moines: 31,013
22. Lincoln: 22,214———–22. Pittsburgh: 26,569
23. Des Moines: 20,798—–23. Lincoln: 23,309
24. Pittsburgh: 18,698——24. Fort Wayne: 22,489
25. Cleveland: 17,739——-25. Cleveland: 21,838
26. Grand Rapids: 16,615—26. St. Louis: 21,538
27. Cincinnati: 16,531——-27. Cincinnati: 20,592
28. Fort Wayne: 15,286—-28. Grand Rapids: 20,032
29. Toledo: 11,159———–29. Akron: 13,649
30. Akron: 8,524————30. Toledo: 9,038
31. Dayton: 5,102———–31. Dayton: 7,311
32. Youngstown: 3,695—-32. Canton: 3,241
33. Canton: 1,343———–33: Youngstown: 976

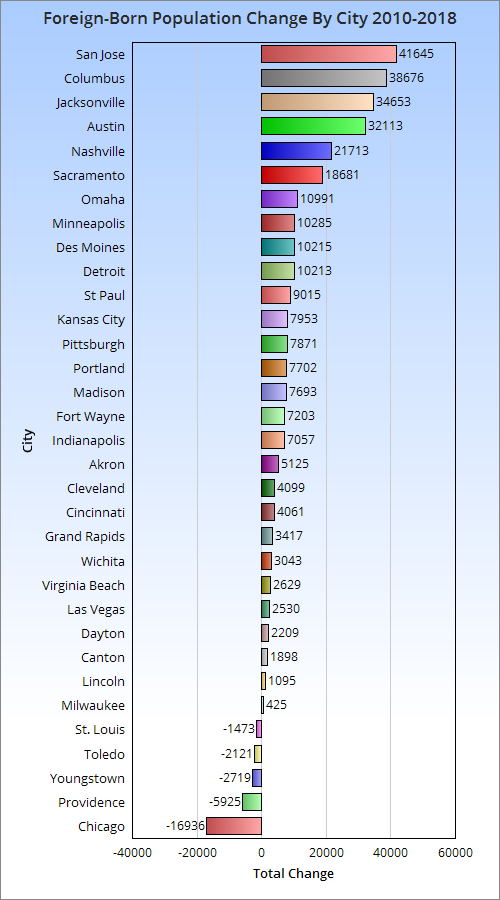
Here’s the 2010-2018 total change.

And the 2010-2018 change by %.

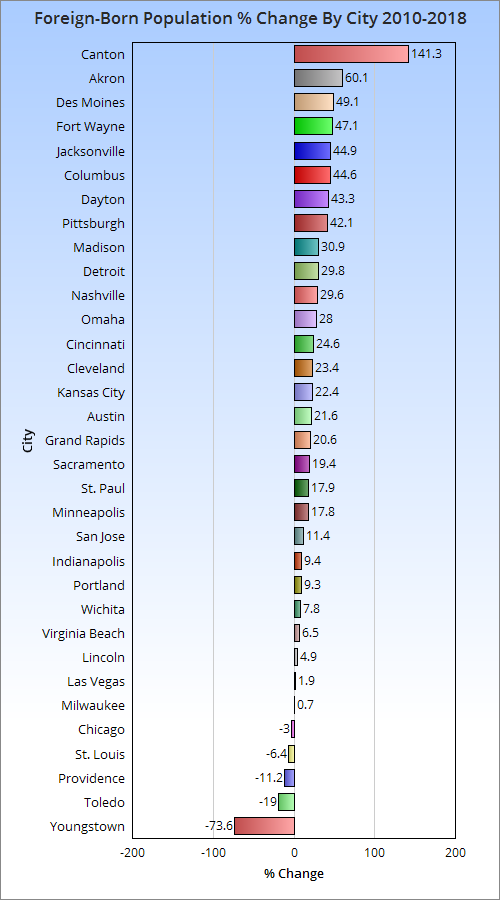
Columbus has done very well in both total and % growth of its foreign-born population since 2010.

So now that we know how many foreign-born immigrants are arriving and how fast, let’s take a look at where they are coming from.

Total Foreign-Born Residents From Europe in 2000 and 2018
2000———————————————–2018

1. Chicago: 145,462———————1. Chicago: 91,397
2. San Jose: 21,904———————2. San Jose: 22,043
3. Portland: 17,572———————-3. Jacksonville: 18,808
4. Jacksonville: 10,883————4. Portland: 17,016
5. Las Vegas: 9,070—————-5. Austin: 11,981
6. Cleveland: 8,796—————-6. Las Vegas: 11,472
7. St. Louis: 8,543——————7. Columbus: 8,141
8. Sacramento: 8,204————-8. Nashville: 8,108
9. Milwaukee: 7,841—————9. Virginia Beach: 6,710
10. Austin: 7,474——————10. Sacramento: 6,275
11. Pittsburgh: 7,413————–11. Pittsburgh: 5,047
12. Columbus: 7,017————–12. Minneapolis: 5,031
13. Indianapolis: 6,543———–13. Omaha: 3,845
14. Virginia Beach: 6,333——–14. St. Louis: 4,711
15. Detroit: 5,600—————–15. Indianapolis: 4,199
16. Minneapolis: 5,409———–16. Omaha: 3,845
17. Providence: 5,126————-17. Milwaukee: 3,808
18. Nashville: 4,859—————18. Madison: 3,519
19. Cincinnati: 3,851————–19. Providence: 3,030
20. Grand Rapids: 3,396———20. Lincoln: 2,777
21. Omaha: 3,320—————–21. Cincinnati: 2,738
22. St. Paul: 3,255—————-22. St. Paul: 2,449
23. Des Moines: 3,216———–23. Grand Rapids: 2,336
24. Kansas City: 2,985———-24. Kansas City: 2,320
25. Madison: 2,871—————25. Fort Wayne: 2,235
26. Lincoln: 2,701—————-26. Wichita: 1,851
27. Akron: 2,687—————–27. Detroit: 1,767
28. Fort Wayne: 2076———–28. Akron: 1,580
29. Toledo: 2,020—————-29. Des Moines: 1,042
30. Wichita: 2,004————–30. Toledo: 496
31. Dayton: 901——————31. Canton: 347
32. Youngstown: 870———–32. Dayton: 347
33. Canton: 590—————–33. Youngstown: 337

Columbus had more European immigrants than most in 2000 and 2018, and was one of the relatively few cities that saw an increase by 2018.

Total Foreign-born Population from Asia 2000 and 2018
2000————————————————–2018

1. San Jose: 182,712—————————1. San Jose: 256,504
2. Chicago: 112,932—————————2. Chicago: 144,970
3. Sacramento: 40,253———————3. Austin: 59,711
4. Portland: 26,271—————————4. Sacramento: 56,084
5. Austin: 25,036——————————5. Columbus: 49,185
6. St. Paul: 23,245———————-6. Portland: 42,245
7. Columbus: 22,354——————-7. Jacksonville: 39,543
8. Jacksonville: 17,427—————–8. Las Vegas: 35,959
9. Minneapolis: 17,376—————–9. St. Paul: 34,246
10. Las Vegas: 17,062—————–10. Nashville: 28,142
11. Virginia Beach: 15,176————-11. Indianapolis: 24,992
12. Detroit: 15,114———————-12. Virginia Beach: 21,954
13. Nashville: 12,573——————-13. Milwaukee: 18,192
14. Milwaukee: 12,114——————14. Minneapolis: 17,929
15. Wichita: 10,826——————–15. Detroit: 17,474
16. Madison: 9,736——————–16. Madison: 17,021
17. Indianapolis: 9,190—————-17. Omaha: 14,582
18. Pittsburgh: 7,938—————–18. Wichita: 14,107
19. Providence: 7,871—————–19. Kansas City: 13,753
20. Kansas City: 7,312—————-20. Des Moines: 13,139
21. Lincoln: 6,691———————-21. Pittsburgh: 12,929
22. St. Louis: 6,425——————–22. Lincoln: 11,233
23. Omaha: 6,302 ———————23. Fort Wayne: 10,809
24. Cleveland: 6,213——————-24. Cleveland: 10,351
25. Des Moines: 5,239—————-25. St. Louis: 9,505
26. Cincinnati: 4,326——————26. Akron: 8,391
27. Toledo: 3,847———————-27. Providence: 7,744
28. Grand Rapids: 3,206————–28. Cincinnati: 5,599
29. Akron: 3,099———————–29. Toledo: 3,597
30. Fort Wayne: 2,792—————–30. Grand Rapids: 3,369
31. Dayton: 903————————-31. Dayton: 2,575
32. Youngstown: 338——————32. Canton: 542
33. Canton: 296————————33. Youngstown: 196

Columbus ranks even higher with its foreign-born Asian population.

Total Foreign-born Population from Africa 2000 and 2018
2000—————————————————2018

1. Minneapolis: 12,765——————–1. Columbus: 45,092
2. Chicago: 12,613————————-2. Minneapolis: 26,271
3. Columbus: 9,530———————–3. Chicago: 25,573
4. San Jose: 5,189————————-4. Nashville: 18,423
5. St. Paul: 4,697———————5. Indianapolis: 14,965
6. Nashville: 4,183——————-6. St. Paul: 13,594
7. Detroit:: 3,249———————7. Austin: 9,961
8. Providence: 3,138—————-8. Kansas City: 8,558
9. Indianapolis: 2,650—————9. San Jose: 8,546
10. Portland: 2,430—————–10. Cincinnati: 7,113
11. Austin 2,263———————11. Des Moines: 6,191
12. Kansas City: 2,192————–12. Omaha: 5,474
13. Cincinnati: 1,781—————-13. Grand Rapids: 3,932
14. Jacksonville: 1,719————-14. Portland: 3,899
15. St. Louis: 1,500—————–15. St. Louis: 3,777
16. Omaha: 1,497——————-16. Providence: 3,571
17. Milwaukee: 1,332—————17. Milwaukee: 3,552
18. Cleveland: 1,075—————-18. Jacksonville: 3,426
19. Sacramento: 1,051————-19. Lincoln: 2,942
20. Des Moines: 1,038————-20. Wichita: 2,752
21. Madison: 991——————–21. Madison: 2,599
22. Wichita: 946——————–22. Detroit: 2,081
23. Las Vegas: 916—————–23. Pittsburgh: 1,909
24. Pittsburgh: 905—————-24. Sacramento: 1,784
25. Virginia Beach: 840———–25. Virginia Beach: 1,783
26. Grand Rapids: 718————-26. Fort Wayne: 1,614
27. Toledo: 638——————–27. Dayton: 1,573
28. Lincoln: 637——————–28. Akron: 1,312
29. Dayton: 522——————–29. Las Vegas: 1,206
30. Fort Wayne: 384————–30. Cleveland: 622
31. Akron: 197———————-31. Toledo: 416
32. Canton: 89———————32. Youngstown: 277
33. Youngstown: 50—————33. Canton: 95

Columbus has claimed the number 1 spot in its foreign-born African population, passing previous top city Minneapolis.

And finally, the total foreign-born population from the Americas in 2000 and 2018
2000—————————————————-2018

1. Chicago: 357,235————————–1. Chicago: 277,742
2. San Jose: 117,989————————2. San Jose: 119,455
3. Austin: 73,935———————-3. Austin: 97,933
4. Las Vegas: 63,277——————4. Las Vegas: 83,782
5. Sacramento: 28,927—————5. Jacksonville: 49,339
6. Providence: 27,649—————-6. Sacramento: 42,722
7. Milwaukee: 24,781——————7. Nashville: 39,633
8. Detroit: 21,527———————-8. Indianapolis: 37,287
9. Portland: 20,939——————-9. Providence: 32,650
10. Minneapolis: 19,648————-10. Milwaukee: 31,917
11. Indianapolis: 17,530————–11. Omaha: 26,012
12. Nashville: 17,125——————12. Wichita: 23,429
13. Omaha: 14,467——————–13. Detroit: 23,198
14. Wichita:: 13,988——————14. Columbus: 22,469
15. Grand Rapids: 13,477————15. Portland: 20,407
16. Kansas City: 12,948————–16. Minneapolis: 18,765
17. Jacksonville: 11,881—————17. Kansas City: 18,170
18. St.Paul: 9,804———————18. Virginia Beach: 12,667
19. Columbus: 8,596—————–19. Des Moines: 10,675
20. Des Moines: 6,201—————20. Grand Rapids: 10,395
21. Virginia Beach: 5,754————21. Madison: 9,349
22. Cleveland: 5,192—————–22. St. Paul: 9,070
23. Madison: 5,080——————23. Fort Wayne: 7,831
24. Fort Wayne: 4,930————–24. Lincoln: 6,280
25. Lincoln: 3,106——————–25. Pittsburgh: 5,898
26. St. Louis: 2,961——————-26. Cleveland: 5,810
27. Toledo: 2,942———————27. Cincinnati: 4,901
28. Pittsburgh: 2,463—————-28. Toledo: 4,347
29. Cincinnati: 2,432—————–29. St. Louis: 3,545
30. Dayton: 919———————-30. Dayton: 2,816
31. Akron: 891————————31. Akron: 2,366
32. Canton: 347———————-32. Canton: 2,257
33. Youngstown: 333—————33. Youngstown: 166

Columbus does the worst with this group, but even here it moved up 5 spots in the rankings.

The rest of the foreign-born population is made up of small groups of people from Oceania- or basically island nations.


2018 Columbus Racial Diversity Comparison


racial diversity comparison

Yesterday, the US Census released tons of new demographic data for 2018. The next few posts will detail some of that data and how Columbus compares to Midwestern and national peers in terms of population, racial diversity and other metrics. These peers are based on either large Midwestern cities or metro areas between 1.5-2.5 million.
This post will be a racial diversity comparison, specifically.

Total Non-Hispanic White Population by City by Year
2010———————————–2018

1. Chicago: 853,910————–1. Chicago: 899,980
2. Indianapolis: 482,195———2. Columbus: 486,431
3. Columbus: 470,971———–3. Austin: 470,620
4. Jacksonville, FL: 452,926—-4. Indianapolis: 465,466
5. Portland, OR: 417,876——–5. Portland: 457,042
6. Austin: 384,065—————6. Jacksonville: 455,487
7. Virginia Beach: 282,812——7. Omaha: 307,845
8. Las Vegas: 280,604———-8. Virginia Beach: 275,371
9. Omaha, NE: 277,606———9. Las Vegas: 272,870
10. San Jose, CA: 265,311——10. Kansas City: 269,854
11. Kansas City, MO: 247,473–11. San Jose: 253,571
12. Wichita, KS: 245,146——-12. Minneapolis: 252,327
13. Minneapolis: 242,848——13. Wichita: 242,671
14. Milwaukee: 221,514——–14. Lincoln: 227,215
15. Lincoln, NE: 216,076——-15. Milwaukee: 204,250
16. Pittsburgh: 203,622——–16. Pittsburgh: 195,468
17. Fort Wayne, IN: 179,646—17. Madison: 186,034
18. Madison, WI: 178,307——18. Fort Wayne: 173,088
19. Toledo: 177,341————–19. St. Paul: 159,782
20. Sacramento, CA: 165,610–20. Sacramento: 158,333
21. St. Paul, MN: 159,704——-21. Toledo: 157,967
22. Des Moines, IA: 145,937—22. Cincinnati: 150,693
23. Cincinnati: 143,120———23. Des Moines: 137,268
24. Cleveland: 137,977———24. St. Louis: 133,688
25. St. Louis: 134,146———–25. Cleveland: 131,010
26. Grand Rapids, MI: 104,636–26. Grand Rapids: 115,719
27. Providence, RI: 64,284——27. Detroit: 72,982
28. Detroit: 55,298————–28. Providence: 58,856

Previous peers, such as San Antonio, Charlotte and Orlando were removed as their metros are now larger than the 2.5 million comparison limit.  Jacksonville, Florida entered the comparison with a metro population of just over 1.5 million in 2018.  Smaller Ohio cities like Dayton, Akron, Canton and Youngstown, which are normally compared, did not have this data available.

Total Non-Hispanic White Change 2010-2018
1. Austin: +86,555
2. Chicago: +46,070
3. Portland: +39,166
4. Omaha: +30,239
5. Kansas City: +22,381
6. Detroit: +17,684
7. Columbus: +15,460
8. Lincoln: +11,139
9. Grand Rapids: +11,083
10. Minneapolis: +9,479
11. Madison: +7,727
12. Cincinnati: +7,573
13. Jacksonville: +2,561
14. St. Paul: +28
15. St. Louis: -458
16. Wichita: -2,475
17. Providence: -5,428
18. Fort Wayne: -6,558
19. Cleveland: -6,967
20. Sacramento: -7,277
21. Virginia Beach: -7,441
22. Las Vegas: -7,734
23. Pittsburgh: -8,154
24. Des Moines: -8,669
25. San Jose: -11,740
26. Indianapolis: -16,729
27. Milwaukee: -17,264
28. Toledo: -19,374

Non-Hispanic White % of Total Population by City in 2018
1. Lincoln: 79.1%
2. Madison: 72.1%
3. Portland: 70.0%
4. Omaha: 65.7%
5. Fort Wayne: 65.5%
6. Pittsburgh: 64.9%
7. Des Moines: 63.3%
8. Wichita: 62.3%
9. Virginia Beach: 61.2%
10. Minneapolis: 59.3%
11. Grand Rapids: 57.8%
12. Toledo: 57.5%
13. Kansas City: 54.9%
14. Columbus: 54.3%
15. Indianapolis: 53.9%
16. St. Paul: 51.9%
17. Jacksonville: 50.4%
18. Cincinnati: 49.8%
19. Austin: 48.8%
20. St. Louis: 44.2%
21. Las Vegas: 42.3%
22. Milwaukee: 34.5%
23. Cleveland: 34.1%
24. Chicago: 33.3%
25. Providence: 32.8%
26. Sacramento: 31.1%
27. San Jose: 24.6%
28. Detroit: 10.9%

Total Non-Hispanic Black Population by City by Year
2010————————————2018
1.  Chicago: 895,294————1. Chicago: 784,266
2. Detroit: 587,707————–2. Detroit: 520,161
3. Jacksonville: 249,532——-3. Jacksonville: 274,290
4. Milwaukee: 230,473——–4. Columbus: 259,803
5. Indianapolis: 226,314——-5. Indianapolis: 251,958
6. Columbus: 216,486———6. Milwaukee: 222,619
7. Cleveland: 208,528———7. Cleveland: 178,909
8. St. Louis: 157,382———–8. Kansas City: 137,867
9. Kansas City: 138,461——-9. St. Louis: 137,087
10. Cincinnati: 131,909——-10. Cincinnati: 122,261
11. Virginia Beach: 79,583—11. Virginia Beach: 84,333
12. Toledo: 75,033————12. Minneapolis: 81,930
13. Pittsburgh: 71,539——-13. Austin: 78,354
14. Minneapolis: 63,749—–14. Toledo: 74,630
15. Sacramento: 61,976—–15. Pittsburgh: 68,637
16. Austin: 61,833————16. Las Vegas: 68,488
17. Las Vegas: 60,187——–17. Sacramento: 64,824
18. Omaha: 55,086———–18. Omaha: 56,503
19. Wichita: 42,662———-19. St. Paul: 44,572
20. St. Paul: 41,923———-20. Wichita: 42,874
21. Grand Rapids: 41,848—21. Fort Wayne: 40,640
22. Fort Wayne: 39,016—–22. Portland: 39,882
23. Portland: 37,355——–23. Grand Rapids: 35,264
24. San Jose: 29,831——–24. San Jose: 29,432
25. Des Moines: 19,962—-25. Providence: 26,594
26. Providence: 19,265—–26. Des Moines: 24,018
27. Madison: 17,560——–27. Madison: 20,276
28. Lincoln: 9,023———-28. Lincoln: 12,203

Total Non-Hispanic Black Change 2010-2018
1. Columbus: +43,317
2. Indianapolis: +25,644
3. Jacksonville: +24,758
4. Minneapolis: +18,181
5. Austin: +16,521
6. Las Vegas: +8,301
7. Providence: +7,329
8. Virginia Beach: +4,750
9. Des Moines: +4,056
10. Lincoln: +3,180
11. Sacramento: +2,848
12. Madison: +2,716
13. St. Paul: +2,649
14. Portland: +2,527
15. Fort Wayne: +1,624
16. Omaha: +1,417
17. Wichita: +212
18. San Jose: -399
19. Toledo: -403
20. Kansas City: -594
21. Pittsburgh: -2,902
22. Grand Rapids: -6,584
23. Milwaukee: -7,854
24. Cincinnati: -9,648
25. St. Louis: -20,295
26. Cleveland: -29,619
27. Detroit: -67,546
28. Chicago: -111,028

Non-Hispanic Black % of Total Population by City in 2018
1. Detroit: 77.3%
2. Cleveland: 46.6%
3. St. Louis: 45.3%
4. Cincinnati: 40.4%
5. Milwaukee: 37.7%
6. Jacksonville: 30.4%
7. Indianapolis: 29.2%
8. Columbus: 29.0%
9. Chicago: 29.0%
10. Kansas City: 28.0%
11. Toledo: 27.1%
12. Pittsburgh: 22.8%
13. Minneapolis: 19.3%
14. Virginia Beach: 18.7%
15. Grand Rapids: 17.6%
16. Fort Wayne: 15.4%
17. Providence: 14.8%
18. St. Paul: 14.5%
19. Sacramento: 12.8%
20. Omaha: 12.1%
21. Des Moines: 11.1%
22. Wichita: 11.0%
23. Las Vegas: 10.6%
24. Austin: 8.1%
25. Madison: 7.9%
26. Portland: 6.1%
27. Lincoln: 4.3%
28. San Jose: 2.9%

Total Non-Hispanic Asian Population by City by Year
2010——————————-2018
1. San Jose: 303,227————1. San Jose: 367,280
2. Chicago: 148,280————2. Chicago: 179,841
3. Sacramento: 84,556——–3. Sacramento: 97,192
4. Austin: 46,575—————4. Austin: 73,185
5.  Portland: 43,185————5. St. Paul: 59,395
6. St. Paul: 41,989————–6. Portland: 57,526
7. Las Vegas: 37,406———-7. Columbus: 54,902
8. Columbus: 35,468———-8. Las Vegas: 46,422
9. Jacksonville: 33,663——–9. Jacksonville: 42,639
10. Virginia Beach: 27,303—10. Virginia Beach: 31,875
11. Milwaukee: 22,670——–11. Indianapolis: 31,777
12. Minneapolis: 21,426——12. Minneapolis: 26,768
13.  Wichita: 19,420———-13. Milwaukee: 25,17
14. Indianapolis: 17,137——14. Madison: 23,594
15. Madison: 16,671———-15. Wichita: 17,410
16. Pittsburgh: 12,036——-16. Omaha: 17,185
17. Providence: 11,497——-17. Pittsburgh: 16,724
18. Lincoln: 10,452———–18. Des Moines: 15,057
19. Kansas City: 10,263—–19. Fort Wayne: 13,661
20. Des Moines: 8,867——20. Providence: 12,556
21. St. Louis: 8,717———–21. Lincoln: 12,494
22. Omaha: 8,397———–22. Kansas City: 12,130
23. Fort Wayne: 6,945—–23. St. Louis: 10,662
24. Detroit: 6,549———-24. Detroit: 10,597
25. Cincinnati: 5,938——25. Cleveland: 10,595
26. Cleveland: 5,392——26. Cincinnati: 6,999
27. Grand Rapids: 3,695–27. Grand Rapids: 4,431
28. Toledo: 3,125———-28. Toledo: 2,802

Total Non-Hispanic Asian Change 2010-2018
1. San Jose: +64,053
2. Chicago: +31,561
3. Austin: +26,610
4. Columbus: +19,434
5. St. Paul: +17,406
6. Indianapolis: +14,640
7. Portland: +14,341
8. Sacramento: +12,636
9. Las Vegas: +9,016
10. Jacksonville: +8,976
11. Omaha: +8,788
12. Madison: +6,923
13. Fort Wayne: +6,716
14. Des Moines: +6,190
15. Minneapolis: +5,342
16. Cleveland: +5,203
17. Pittsburgh: +4,688
18. Virginia Beach: +4,572
19. Detroit: +4,048
20. Milwaukee: +2,501
21. Lincoln: +2,042
22. St. Louis: +1,945
23. Kansas City: +1,867
24. Cincinnati: +1,061
25. Providence: +1,059
26. Grand Rapids: +736
27. Toledo: -323
28. Wichita: -2,010

Non-Hispanic Asian % of Total Population by City in 2018
1. San Jose: 35.7%
2. St. Paul: 19.3%
3. Sacramento: 19.1%
4. Madison: 9.1%
5. Portland: 8.8%
6. Austin: 7.6%
7. Las Vegas: 7.2%
8. Virginia Beach: 7.1%
9. Providence: 7.0%
10. Des Moines: 6.9%
11. Chicago: 6.7%
12. Minneapolis: 6.3%
13. Columbus: 6.1%
14. Pittsburgh: 5.6%
15. Fort Wayne: 5.2%
16. Jacksonville: 4.7%
17. Wichita: 4.5%
18. Lincoln: 4.4%
19. Milwaukee: 4.3%
20. Indianapolis: 3.7%
21. Omaha: 3.7%
22. St. Louis: 3.5%
23. Cleveland: 2.8%
24. Kansas City: 2.5%
25. Cincinnati: 2.3%
26. Grand Rapids: 2.2%
27. Detroit: 1.6%
28. Toledo: 1.0%


Total Hispanic Population by City By Year
2010———————————2018
1. Chicago: 763,968————-1. Chicago: 776,661
2. San Jose: 318,389————2. San Jose: 333,819
3. Austin: 288,130—————3. Austin: 314,949
4. Las Vegas: 181,923———–4. Las Vegas: 222,860
5. Sacramento: 124,461———5. Sacramento: 148,343
6. Milwaukee: 104,619———-6. Milwaukee: 119,876
7. Indianapolis: 78,467———-7. Jacksonville: 94,158
8.  Providence: 76,645———-8. Indianapolis: 88,022
9. Jacksonville: 64,081———-9. Providence: 75,177
10. Wichita: 59,823————-10. Wichita: 70,564
11. Portland: 58,986————11. Omaha: 68,747
12. Omaha: 53,661————–12. Portland: 60,760
13. Kansas City: 49,800——–13. Columbus: 53,935
14. Detroit : 45,580————-14. Detroit: 52,718
15. Columbus: 43,276———-15. Kansas City: 52,638
16. Cleveland: 36,067———-16. Cleveland: 47,144
17. Minneapolis: 34,504——-17. Minneapolis: 40,912
18. Grand Rapids: 30,659—–18. Virginia Beach: 37,365
19. Virginia Beach: 29,206—-19. Grand Rapids: 36,469
20. St. Paul: 28,725————20. Des Moines: 31,706
21. Des Moines: 23,832——-21. St. Paul: 26,081
22. Toledo: 21,346————-22. Toledo: 24,625
23. Fort Wayne: 19,576——-23. Fort Wayne: 24,623
24. Lincoln: 16,007————24. Lincoln: 22,339
25. Madison: 14,062———-25. Madison: 18,867
26. St. Louis: 11,207———–26. St. Louis: 12,509
27. Cincinnati: 8,710———-27. Cincinnati: 10,773
28. Pittsburgh: 7,282———28. Pittsburgh: 10,180

Total Hispanic Population Change 2010-2018
1. Las Vegas: +40,937
2. Jacksonville: +30,077
3. Austin: +26,819
4. Sacramento: +23,882
5. San Jose: +15,430
6. Milwaukee: +15,257
7. Omaha: +15,086
8. Chicago: +12,693
9. Cleveland: +11,077
10. Wichita: +10,741
11. Columbus: +10,659
12. Indianapolis: +9,555
13. Virginia Beach: +8,159
14. Des Moines: +7,874
15. Detroit: +7,138
16. Minneapolis: +6,408
17. Lincoln: +6,332
18. Grand Rapids: +5,810
19. Fort Wayne: +5,047
20. Madison: +4,805
21. Toledo: +3,279
22. Pittsburgh: +2,898
23. Kansas City: +2,838
24. Cincinnati: +2,063
25. Portland: +1,774
26. St. Louis: +1,302
27. Providence: -1,468
28. St. Paul: -2,644

Hispanic % of Total Population by City in 2018
1. Providence: 41.9%
2. Las Vegas: 34.6%
3. Austin: 32.7%
4. San Jose: 32.4%
5. Sacramento: 29.2%
6. Chicago: 28.7%
7. Milwaukee: 20.3%
8. Grand Rapids: 18.2%
9. Wichita: 18.1%
10. Omaha: 14.7%
11. Des Moines: 14.6%
12. Cleveland: 12.3%
13. Kansas City: 10.7%
14. Jacksonville: 10.4%
15. Indianapolis: 10.2%
16. Minneapolis: 9.6%
17. Portland: 9.3%
18. Fort Wayne: 9.3%
19. Toledo: 9.0%
20. St. Paul: 8.5%
21. Virginia Beach: 8.3%
22. Detroit: 7.8%
23. Lincoln: 7.8%
24. Madison: 7.3%
25. Columbus: 6.0%
26. St. Louis: 4.1%
27. Cincinnati: 3.6%
28. Pittsburgh: 3.4%

Total Non-Hispanic Other Population by City by Year
2010——————————–2018

1. Chicago: 37,379————–1. Chicago: 65,240
2. San Jose: 32,439————-2. San Jose: 46,017
3. Sacramento: 30,900——–3. Columbus: 40,806
4. Portland: 28,027————-4. Sacramento: 39,825
5. Las Vegas: 24,521———–5. Portland: 37,363
6. Columbus: 23,738———–6. Jacksonville: 37,322
7. Jacksonville: 23,114———-7. Las Vegas: 34,024
8. Minneapolis: 20,753———8. Austin: 27,135
9. Virginia Beach: 20,268——9. Indianapolis: 26,908
10. Indianapolis: 20,086——10. Minneapolis: 23,458
11. Detroit: 16,776————-11. Virginia Beach: 21,245
12. Milwaukee: 16,311——– 12. Kansas City: 19,320
13. Wichita: 16,091————13. Milwaukee: 19,286
14. Omaha: 15,519————14. Omaha: 17,987
15. Austin: 14,915————-15. St. Paul: 17,871
16. Kansas City: 14,668——16. Detroit: 16,223
17. St. Paul: 13,098———–17. Cleveland: 16,123
18.  Pittsburgh: 11,280——-18. Wichita: 15,740
19. Toledo: 10,134————19. Toledo: 14,949
20. Fort Wayne: 8,513——-20. Lincoln: 13,148
21. Cleveland: 8,276———21. Fort Wayne: 12,158
22. St. Louis: 7,704———-22. Cincinnati: 11,889
23. Lincoln: 7,483———–23. Pittsburgh: 10,029
24. Grand Rapids: 7,376—24. Madison: 9,263
25. Cincinnati: 7,230——-25. Des Moines: 8,944
26. Madison: 7,177———26. St. Louis: 8,892
27. Providence: 6,471——27: Grand Rapids: 8,347
28. Des Moines: 5,598—–28. Providence: 6,152

Total Non-Hispanic Other Population Change 2010-2018
1. Chicago: +27,861
2. Columbus; +17,068
3. Jacksonville: +14,208
4. San Jose: +13,578
5. Austin: +12,220
6. Las Vegas: +9,503
7. Portland: +9,336
8. Sacramento: +8,925
9. Cleveland: +7.847
10. Indianapolis: +6,822
11. Lincoln: +5,665
12. Toledo: +4,815
13. St. Paul: +4,773
14. Cincinnati: +4,659
15. Kansas City: +4,652
16. Fort Wayne: +3,645
17. Des Moines: +3,346
18. Milwaukee: +2,975
19. Minneapolis: +2,705
20. Omaha: +2,468
21. Madison: +2,086
22. St. Louis: 1,188
23. Virginia Beach: +977
24. Grand Rapids: +971
25. Providence: -319
26. Wichita: -351
27. Detroit: -553
28. Pittsburgh: -1251

Non-Hispanic Other % of Total Population by City in 2018
1. Sacramento: 7.8%
2. St. Paul: 5.8%
3. Portland: 5.7%
4. Minneapolis: 5.5%
5. Toledo: 5.4%
6. Las Vegas: 5.3%
7. Virginia Beach: 4.7%
8. Fort Wayne: 4.6%
9. Lincoln: 4.6%
10. Columbus: 4.6%
11. San Jose: 4.5%
12. Cleveland: 4.2%
13. Grand Rapids: 4.2%
14. Jacksonville: 4.1%
15. Des Moines: 4.1%
16. Wichita: 4.0%
17. Cincinnati: 3.9%
18. Kansas City: 3.9%
19. Omaha: 3.8%
20. Madison: 3.6%
21. Providence: 3.4%
22. Pittsburgh: 3.3%
23. Milwaukee: 3.3%
24. Indianapolis: 3.1%
25. St. Louis: 2.9%
26. Austin: 2.8%
27. Chicago: 2.4%
28. Detroit: 2.4%

Now that we can see all the numbers, what is the 2018 ranking of most to least racially diverse? To find out, I assigned points by the ranking of % of population, so #1 of a particular ranking would get 1 point, the next 2 points and so on. The cities with the fewest points are the most diverse.
Here are the rankings for both 2010 and 2018.

Most to Least Diverse by Year and Total Points
2010——————————–2018

1. Portland: 50—————–1. Portland: 54
2. Sacramento: 52————2. Sacramento: 54
3. St. Paul: 53—————–3. Minneapolis: 55
4. Minneapolis: 54———–4. St. Paul: 58
5. Virginia Beach: 55——–5. Las Vegas: 59
6. Wichita: 57—————-6. Virginia Beach: 59
7. Las Vegas: 60————-7. Fort Wayne: 62
8. Providence: 61————8. Des Moines: 64
9. Omaha: 66—————-9. Jacksonville: 67
10. Grand Rapids: 69——-10. Columbus: 70
11. Des Moines: 71———-11. San Jose: 71
12. Madison: 72————-12. Cleveland: 72
13. San Jose: 72————-13. Wichita: 72
14. Fort Wayne: 73———14. Grand Rapids: 73
15. Kansas City: 73———15. Providence: 73
16. Milwaukee: 73———-16. Omaha: 74
17. Pittsburgh: 74———-17. Madison: 75
18. Jacksonville: 75——–18. Toledo: 75
19. Chicago: 76————-19. Milwaukee: 76
20. Columbus: 77———-20. Chicago: 77
21. Austin: 80—————21. Austin: 78
22. Indianapolis: 81——–22. Kansas City: 78
23. Toledo: 81————–23. Lincoln: 78
24. Lincoln: 85————-24. Indianapolis: 81
25. St. Louis: 94———–25. Pittsburgh: 82
26. Cleveland: 95———-26. Cincinnati: 91
27. Cincinnati: 97———-27. St. Louis: 96
28. Detroit: 104————28. Detroit: 106

Columbus had one of the fastest improvements of its diversity, moving up 10 spots from 20th to 10th.

To see how Columbus compares to cities in other ways, check out:
Columbus vs. Other Cities
And to see more national population data, visit:
United States Census


1900 Debate on Columbus Transit


1900 debate on Columbus transit

Streetcars in 1909.

In a January, 1900 debate on Columbus transit, a group of concerned Downtown Columbus residents and business owners voiced their opposition to the Columbus & Newark Traction Company being greenlit to build and operate a streetcar line on Mound Street. Today’s car-dominated environment means most arguments against transit projects would likely revolve around rail being too expensive or that few would ride them. In contrast, 1900 arguments involving transit options showed a very different attitude towards public transit in general.

The opposition group put out a list of 10 reasons why they objected to the project. They were:
1. We believe it to be the interest of prospective passengers of a street railroad from the east over the National Road, that the cars come into the city over the Main Street tracks.
2. Because it would be most direct to the center of the city.
3. Coming over the Main Street line would confine cars of the new line to the established rate of speed while in the city.
4. The proposed line on Mound Street would get but few city passengers.
5. It is not likely that reduced fares would be secured.
6. Transfers over old lines could not likely be had.
7. Cars would be far between.
8. A car line on Mound Street would be useless to residents of the city because too near Main Street where cars are much more frequent than could be expected on a suburban line.
9. Not getting city traffic, cars on the proposed line over Mound Street would run at a high rate of speed, making it dangerous for people in that part of the city and especially so for the residents of Mound Street.
10. We believe that it would be to the general interest of the city and the special interest of the southeastern part, also the interest of a new company that the proposed new line over the National Road from the east should come into the city two or three blocks from, if not on the Main Street line, but never over Mound Street.


Besides being somewhat repetitive in places, the given reasons are more practical than the emotional anti-rail tirades often witnessed today. The group wasn’t so much opposed to rail- just the opposite. Instead, they didn’t like that there were too many lines in the same area, thereby making a new one redundant and financially infeasible. They didn’t bring up construction costs, but objections to the potential lack of transfer stops. They weren’t overly worried about the line interfering with other traffic, but whether the service would run enough cars.

Too often in the current transit debate, proposals tend to get bogged down in politics rather than the basic transit needs of the population. A century ago, even opposition groups seemed to fully understand that the issue was not rail itself, but in ensuring that what got built made the best sense possible. Columbus hasn’t had rail in more than 40 years. In its long absence, we’ve perhaps lost the plot on what really matters.

The opposition group lost the fight and Mound Street got its streetcar line. The East Mound section ended service in 1929 as the car became increasingly dominant.
The last streetcar trip in the city occurred on September 5, 1948.

Columbus Drowning in Rain


Columbus drowning in rain

If it seems like the last few years have been particularly wet, you’d be right. Columbus, other Ohio cities and many areas in the Midwest have been seeing record rainfall of late. Yesterday alone, June 19th, Columbus had a daily record 2.65″ of rain, flooding many streets across Franklin County, including I-71 in at least 2 places. Is it indicative of a fluke pattern or a local result of climate change? Let’s look at the numbers and trends more closely.

First of all, let’s look at the 20 wettest years on record through June 19th.
1. 1882: 32.50″
2. 1890: 30.12″
3. 2019: 27.08″
4. 1964: 25.78″
5. 2011: 25.68″
6. 1893: 25.50″
7. 2004: 25.49″
8. 1996: 24.94″
9. 1949: 24.52″
10. 1945: 24.49″
11. 1913: 24.45″
12. 1883: 24.18″
13. 2018: 23.98″
14. 2008: 23.62″
15. 1950: 23.60″
16. 1990: 23.56″
17. 1981: 23.49″
18. 1898: 22.94″
19. 1927: 22.92″
20. 1937: 22.69″

So far, 2019 has had the 3rd highest rain total to date since 1879.

Here are the top 20 wettest full years.
1. 2018: 55.18″
2. 2011: 54.96″
3. 1990: 53.16″
4. 1882: 51.30″
5. 1890: 50.73″
6. 2004: 49.27″
7. 2003: 49.03″
8. 1883: 48.88″
9. 1881: 46.99″
10. 2017: 46.61″
11. 1973: 46.25″
12. 1948: 45.69″
13. 1972: 45.60″
14. 1996: 45.56″
15. 2008: 45.44″
16. 1995: 45.30″
17. 2015: 45.00″
18. 1950: 44.96″
19. 1880: 44.68″
20. 1949: 44.47″

4 years this decade have been among the top 20 wettest years since 1879. Only the 1880’s can match that record, though both the 2000s and 2010s have been wetter, as shown below.


The chart shows that the 2000s were the wettest decade on record, with the 2010s looking to surpass even that total with more than 6 months left to go in 2019. Furthermore, the trend line is clearly up, meaning that Columbus has been getting gradually wetter over the last 140 years, indicating that something else is going on rather than just a random wet period.
Columbus isn’t the only place in the Midwest seeing high levels of rain. There has been widespread, damaging flooding going on across many states, especially this year. Check out some of the articles on this below:
Cincinnati: https://www.journal-news.com/news/local/butler-county-struggling-with-near-record-rainfall-this-unbelievable/270FdqJqMzImu7YSBtYTHM/
Lake Michigan: https://www.msn.com/en-us/weather/topstories/lake-michigan-water-levels-on-pace-to-reach-record-high-in-june-skirt-records-into-fall/ar-AAD1BWz
Iowa: https://www.usatoday.com/story/news/2019/06/14/iowa-climate-change-agriculture-flood-rain-farming-environment-weather-precipitation-temperature/1433128001/
Pennsylvania: https://www.pennlive.com/news/2019/06/for-pa-farmers-year-of-record-rain-often-a-big-nuisance.html
West Virginia: https://www.herald-dispatch.com/news/huntington-charleston-on-pace-to-break-annual-rainfall-average/article_1fd2b7a8-db64-5074-b017-ab700ff243ec.html
Midwest Farming: https://www.bloomberg.com/news/articles/2019-06-14/it-s-not-just-corn-u-s-farmers-may-forgo-near-record-soy-acres?srnd=premium
Mississippi River: https://finance.yahoo.com/news/mississippi-floodings-impact-freight-economy-142712910.html

Ironically, few individual months in recent years have featured record precipitation. In the last 10 years, only 1 month- July 2017- appears in the top 25 wettest months. It’s just been more of a constant wet pattern, where most months now have above to well-above normal precipitation.
While climate change can’t account for individual events or specific record rainfalls, the patterns are obvious enough to show that the climate in Columbus and in many other parts of the country is changing over time. This means that we should come to expect more of this in the years to come.

Weekly Update 6/3-6/9


The weekly update for June 3-6 continues to show progress on the site’s restoration. This included the following:
-The Completed Development page received extensive additions for the years 2015-2019.
-The January Weather records page was fully restored and includes 2019 data.
-The Columbus Tornado History page got a large addition.
-A few new graphs were added to the Columbus City Demographics page.
-Columbus Transportation History received multiple entries.
-Odds and ends were added to several other pages across the site.