The Winter 2019-2020 Review has arrived! Aside some a few instances, winter was largely absent in Ohio for the 2019-2020 season. The season was bookended by periods of cold while the heart of winter was one of the warmest on record. Along with the warmth, precipitation was high throughout the season, but that didn’t translate into much snow.
Temperature and snowfall ranking data goes back to the winter of 1878-1879. Snow depth ranking data goes back to 1940.
December-February Only Average High: 43.5 11th Warmest Average Low: 28.3 9th Warmest Mean: 35.9 10th Warmest Precipitation: 9.69″ 29th Wettest Snowfall: 8.3″ 16th Least Snowiest Average Daily Snow Depth: 0.1″ 2nd Lowest Largest Snowstorm: 2.2″ December 15th-16th 32 or Below Highs: 12 6th Fewest 32 or Below Lows: 65 13th Fewest Measurable Precipitation Days: 34 10th Fewest Measurable Snowfall Days: 13 9th Fewest Deepest Snow Depth: 2″ on February 9th Days with 1″+ Snow Depth: 5 3rd Fewest
Entire Cold Season- October-April Average High: 51.9 10th Warmest Average Low: 34.1 17th Warmest Mean: 43.0 11th Warmest Precipitation: 27.60″ 6th Wettest Snowfall: 11.7″ 18th Least Snowiest Average Snow Depth: 0.1″ 2nd Lowest Largest Snowstorm: 2.8″ November 11th-12th 32 or Below Highs: 14 4th Fewest 32 or Below Lows: 98 17th Fewest Measurable Precipitation Days: 87 18th Most Measurable Snowfall Days: 16 7th Fewest Deepest Snow Depth: 2″ on February 9th Days with 1″+ Snow Depth: 8 5th Fewest
Average High By Month October 2019: 69.8 13th Warmest November 2019: 47.3 21st Coldest December 2019: 45.9 12th Warmest January 2020: 43.3 16th Warmest February 2020: 41.2 35th Warmest March 2020: 55.4 18th Warmest April 2020: 59.6 21st Coldest
Average Low By Month October 2019: 47.0 26th Warmest November 2019: 30.3 9th Coldest December 2019: 28.8 28th Warmest January 2020: 30.1 8th Warmest February 2020: 25.9 35th Warmest March 2020: 37.6 13th Warmest April 2020: 38.7 16th Coldest
Mean By Month October 2019: 58.4 18th Warmest November 2019: 38.8 12th Coldest December 2019: 37.4 18th Warmest January 2020: 36.7 13th Warmest February 2020: 33.6 38th Warmest March 2020: 46.5 13th Warmest April 2020: 49.2 23rd Coldest
The 2019-2020 winter months were full of extremes, and most months ended up in either the top 20 coldest or warmest ever recorded.
Precipitation By Month October 2019: 4.05″ 19th Wettest November 2019: 1.48″ 24th Driest December 2019: 2.76″ 62nd Wettest January 2020: 4.37″ 25th Wettest February 2020: 2.56″ 54th Wettest March 2020: 8.16″ 2nd Wettest April 2020: 4.22″ 32nd Wettest
Snowfall By Month October 2019: Trace 2nd Least Snowiest November 2019: 2.8″ 22nd Snowiest December 2019: 2.3″ 23rd Least Snowiest January 2020: 0.3″ 3rd Least Snowiest February 2020: 5.7″ 47th Snowiest March 2020: 0.6″ 5th Least Snowiest April 2020: Trace 2nd Least Snowiest
As with temperature, precipitation and snowfall varied wildly as well, but generally most months were wetter than normal and less snowy than normal.
Average Snow Depth By Month October 2019: 0.0″ November 2019: 0.2″ December 2019: 0.1″ January 2020: Trace February 2020: 0.2″ March 2020: Trace April 2020: 0.0″
Maximum High By Month October: 94 on the 1st and 2nd November: 59 on the 27th December: 62 on the 27th January: 71 on the 11th February: 63 on the 3rd March: 76 on the 28th April: 77 on the 7th
Maximum High Records -The 94 on October 1st was a record for the date, beating the old record of 89 set in 1952. This is also the warmest October temperature ever recorded, beating the old October record of 91 set in 2007. -The 94 on October 2nd was a record for the date, beating the old record of 88 set in 1919. This also ties for the warmest October temperature ever, set on October 1st, 2019, the previous day. -The 93 on October 3rd was a record for the date, beating the old record of 89 set in 1898 and 1953. -The 71 on January 11th was a record for the date, beating the old record of 66 set in 1886 and 1890. -The 63 on February 3rd tied the old record set in 1890.
Minimum High By Month October: 55 on the 12th November: 28 on the 12th and 13th December: 29 on the 18th January: 28 on the 20th February: 24 on the 14th March: 38 on the 21st April: 45 on the 10th
Minimum High Records -The 28 on the 12th was a record for the date, beating the old record of 30 set in 1920.
Maximum Low By Month October: 68 on the 2nd November: 39 on the 21st and 27th December: 47 on the 9th and 29th January: 53 on the 11th February: 39 on the 25th March: 55 on the 29th April: 53 on the 8th
Maximum Low Records -The 45 on January 10th was a record for the date, beating the old record of 43 set in 1960.
Minimum Low By Month October: 35 on the 31st November: 11 on the 13th December: 13 on the 19th January: 12 on the 20th February: 13 on the 15th and 21st March: 19 on the 1st April: 26 on the 16th
Minimum Low Records -The 15 on November 12th was a record for the date, beating the old record of 16 set in 1911. -The 11 on November 13th was a record for the date, beating the old record of 14 set in 1911.
Highest Daily Precipitation By Month October: 1.51″ on the 31st November: 0.33″ on the 27th December: 1.20″ on the 29th January: 1.13″ on the 18th February: 0.57″ on the 12th March: 2.89″ on the 20th April: 0.66″ on the 7th
Precipitation Records -The 1.51″ on October 31st was a record for the date, beating the old record of 1.44″ set in 1932. -The 1.20″ on December 29th was a record for the date, beating the old record of 1.13″ set in 1915. -The 1.13″ on January 18th was a record for the date, beating the old record of 0.79″ set in 1927. -The 1.31″ on March 4th was a record for the date, beating the old record of 0.74″ set in 1951. -The 2.89″ that fell on March 20th was a record for the date, beating the old record of 1.60″ set in 1984.
Highest Daily Snowfall By Month October: Trace on the 31st November: 2.1″ on the 12th December: 1.5″ on the 15th January: 0.2″ on the 25th February: 1.8″ on the 8th March: 0.6″ on the 14th April: Trace on the 15th and 17th
Snowfall Records -The 2.1″ on November 11th was a record for the date, beating the old record of 0.5″ set in 1983.
Deepest Snow Depth By Month October: 0″ November: 3″ on the 12th December: 2″ on the 16th January: Trace on the 19th and 20th February: 2″ on the 29th March: Trace on the 15th April: 0″
The Census has released 2019 metro population estimates. This comparison uses those figures to rank the Columbus metro with other metros under the following categories: Ohio metros with at least 250,000 people. Midwest metros with at least 500,000 people. National metros with 1.5-2.599 million people.
Total Metro Area Population Census 2010, July 1, 2018 and July 1, 2019 Census 2010——————————-July 1, 2018————————July 1, 2019 1. Chicago, IL: 9,461,105————-1. Chicago: 9,484,158———–1. Chicago: 9,458,539 2. Detroit, MI: 4,296,250—————2. Detroit: 4,322,084————-2. Detroit: 4,319,629 3. Minneapolis, MN: 3,348,8459—-3. Minneapolis: 3,610,061–3. Minneapolis: 3,640,043 4. St. Louis, MO: 2,787,701———-4. St. Louis: 2,803,958———4. St. Louis: 2,803,228 5. Pittsburgh, PA: 2,356,285——5. San Antonio: 2,512,379—5. San Antonio: 2,550,960 6. San Juan, PR: 2,350,126———-6. Portland: 2,473,350———6. Portland: 2,492,412 7. Portland, OR: 2,226,009——-7. Sacramento: 2,341,940—–7. Sacramento: 2,363,730 8. Sacramento, CA: 2,149,127—–8. Pittsburgh: 2,322,653——–8. Pittsburgh: 2,317,600 9. San Antonio, TX: 2,142,516—–9. Las Vegas: 2,226,115——-9. Las Vegas: 2,266,715 10. Cincinnati: 2,114,580———–10. Cincinnati: 2,211,936——-10. Austin: 2,227,083 11. Cleveland: 2,077,240———–11. Austin: 2,165,497———–11. Cincinnati: 2,221,208 12. Kansas City, MO: 2,009,342-12. Kansas City: 2,144,427–12. Kanas City: 2,157,990 13. Las Vegas, NV: 1,951,269—–13. Columbus: 2,104,194—–13. Columbus: 2,122,271 14. Columbus: 1,901,974——-14. Cleveland: 2,053,795—–14. Indianapolis: 2,074,537 15. Indianapolis, IN: 1,887,877—15. Indianapolis: 2,052,368—15. Cleveland: 2,048,449 16. San Jose, CA: 1,836,911—16. San Juan: 2,022,139———16. San Juan: 2,023,227 17. Austin, TX: 1,716,289————17. San Jose: 1,993,804—–17. San Jose: 1,990,660 18. Virginia Beach, VA: 1,676,822—18. Nashville: 1,904,726—18. Nashville: 1,934,317 19. Nashville: 1,670,890—19. Virginia Beach: 1,763,713–19. Virginia Beach: 1,768,901 20. Providence, RI: 1,600,852—-20. Providence: 1,622,379—20. Providence: 1,624,578 21. Milwaukee, WI: 1,555,908—–21. Milwaukee: 1,573,995—21. Milwaukee: 1,575,179 22. Jacksonville, FL: 1,345,596-22. Jacksonville: 1,532,663–22. Jacksonville: 1,559,514 23. Grand Rapids: 988,938–23. Grand Rapids: 1,071,370-23. Grand Rapids: 1,077,370 24. Omaha, NE: 865,350————–24. Omaha: 940,970—-24. Omaha: 949,442 25. Dayton: 799,232——————–25. Dayton: 805,088—–25. Dayton: 807,611 26. Akron: 703,200———————26. Akron: 703,855——–26. Akron: 703,479 27. Wichita, KS: 630,919————27. Des Moines: 690,915—27. Des Moines: 699,292 28. Toledo: 610,001——————28.Madison: 659,927——–28. Madison: 664,865 29. Madison, WI: 605,435———–29. Toledo: 643,089——–29. Toledo: 641,816 30. Des Moines, IA: 569,633——-30. Wichita: 637,519——30. Wichita: 640,218 31. Youngstown: 565,773———–31. Lansing: 548,674—–31. Lansing: 550,391 32. Lansing, MI: 534,684————32. Youngstown: 538,226—32. Youngstown: 536,081 33. Canton: 404,422——————33. Canton: 401,165—-33. Canton: 399,927
Charlotte and Orlando metros, previous national peers, have grown past the population standard limit of 2.599 million and are no longer used. Lansing and San Juan have been added.
Metro Area Total Growth Census 2010-July 1, 2019 and July 1, 2018-July 1, 2019 Census 2010-July 1, 2019—————————–July 1, 2018-July 1, 2019 1. Austin: +510,794————————————–1. Austin: +61,586 2. San Antonio: +408,452——————————2. Las Vegas: +40,600 3. Las Vegas: +315,446——————————–3. San Antonio: +38,581 4. Minneapolis: +306,410——————————4. Minneapolis: +29,982 5. Nashville: +288,117———————————-5. Nashville: +29,591 6. Portland: +266,403———————————–6. Jacksonville: +26,851 7. Columbus: +220,297——————————–7. Indianapolis: +22,169 8. Sacramento: +214,603——————————8. Sacramento: +21,790 9. Jacksonville: +213,918——————————9. Portland: +19,062 10. Indianapolis: +186,660—————————-10. Columbus: +18,077 11. San Jose: +153,749——————————–11. Kansas City: +13,563 12. Kansas City: +148,648—————————–12. Cincinnati: +9,272 13. Des Moines: +92,817——————————-13. Omaha: +8,472 14. Omaha: +84,092————————————-14. Des Moines: +8,377 15. Grand Rapids: +83,700—————————–15. Grand Rapids: +6,000 16. Cincinnati: +83,541———————————-16. Virginia Beach: +5,188 17. Madison: +59,430————————————17. Madison: +4,938 18. Virginia Beach: +54,947—————————-18. Wichita: +2,699 19. Providence: +23,726——————————–19. Dayton: +2,523 20. Detroit: +23,379—————————————20. Providence: +2,199 21. Milwaukee: +19,271———————————21. Lansing: +1,717 22. Wichita: +17,157————————————-22. Milwaukee: +1,184 23. Lansing: +15,707————————————23. San Juan: +1,088 24. St. Louis: +15,527———————————–24. Akron: -376 25. Dayton: +8,379—————————————25. St. Louis: -730 26. Akron: +279——————————————-26. Canton: -810 27. Chicago: -2,566————————————–27. Toledo: -1,273 28. Canton: -6,902—————————————28. Youngstown: -2,45 29. Toledo: -9,613—————————————-29. Detroit: -2,455 30. Cleveland: -28,791———————————-30. San Jose: -3,144 31. Youngstown: -29,692——————————-31. Pittsburgh: -5,053 32. Pittsburgh: -36,685———————————32. Cleveland: -5,346 33. San Juan: -326,899——————————–33. Chicago: -25,619
Now let’s look at the components of population change for metro areas.
Total Births By Metro Census 2010-July 1, 2019 and July 1, 2018-July 1, 2019 Census 2010-July 1, 2019———————–July 1, 2018-July 1, 2019 1. Chicago: 1,085,985——————————-1. Chicago: 108,425 2. Detroit: 462,696————————————2. Detroit: 48,879 3. Minneapolis: 419,634—————————–3. Minneapolis: 44,602 4. St. Louis: 310,273———————————4. San Antonio: 32,592 5. San Antonio: 300,032—————————-5. St. Louis: 31,686 6. Kansas City: 253,384—————————-6. Columbus: 27,096 7. Cincinnati: 253,180——————————-7. Las Vegas: 27,048 8. Portland: 253,110———————————8. Cincinnati: 26,892 9. Sacramento: 252,144—————————9. Sacramento: 26,752 10. Columbus: 251,291—————————10. Kanas City: 26,497 11. Las Vegas: 247,787—————————11. Indianapolis: 26,300 12. Indianapolis: 246,099————————-12. Portland: 26,204 13. Austin: 239,673———————————13. Austin: 26,115 14. San Jose: 220,891—————————–14. Nashville: 24,308 15. Pittsburgh: 218,159—————————-15. Pittsburgh: 22,570 16. Nashville: 216,969—————————–16. San Jose: 22,487 17. Cleveland: 212,523—————————-17. Cleveland: 22,003 18. Virginia Beach: 209,617———————-18. Virginia Beach: 21,589 19. Milwaukee: 182,815—————————19. Milwaukee: 18,927 20. Jacksonville: 167,526————————-20. Jacksonville: 18,592 21. Providence: 152,794————————–21. Providence: 16,182 22. Grand Rapids: 125,556———————-22. Grand Rapids: 13,339 23. Omaha: 122,306——————————23. Omaha: 12,848 24. Dayton: 88,783——————————–24. Dayton: 9,391 25. Des Moines: 85,530————————–25. Des Moines: 9,311 26. Wichita: 81,503——————————–26. Wichita: 8,057 27. Toledo: 71,848———————————27. Toledo: 7,428 28. Akron: 69,159———————————-28. Akron: 7,196 29. Madison: 67,559——————————29. Madison: 6,988 30. Lansing: 54,679——————————-30. Lansing: 5,702 31. Youngstown: 51,745————————-31. Youngstown: 5,450 32. Canton: 40,730——————————–32. Canton: 4,254
Components of change stats are not available for San Juan.
Total Deaths By Metro Census 2010-July 1, 2019 and July 1, 2018-July 1, 2019 Census 2010-July 1, 2019———————————July 1, 2018-July 1, 2019 1. Chicago: -647,739——————————————-1. Chicago: -74,501 2. Detroit: -377,943———————————————2. Detroit: -42,151 3. Pittsburgh: -253,686—————————————-3. St. Louis: -27,669 4. St. Louis: -241,884——————————————4. Pittsburgh: -27,387 5. Minneapolis: -210,510————————————-5. Minneapolis: -24,290 6. Cleveland: -198,044—————————————-6. Cleveland: -21,464 7. Cincinnati: -179,563—————————————-7. Cincinnati: -20,279 8. Sacramento: -157,234————————————-8. Sacramento: -18,933 9. Portland: -156,592——————————————9. San Antonio: -18,551 10. Kansas City: -155,166———————————–10. Portland: -18,458 11. San Antonio: -153,339———————————–11. Las Vegas: -17,919 12. Indianapolis: -148,608———————————–12. Kansas City: -17,692 13. Columbus: -142,665————————————–13. Columbus: -16,704 14. Las Vegas: -142,415————————————-14. Indianapolis: -16,678 15. Providence: -139,006————————————15. Virginia Beach: -15,280 16. Virginia Beach: -131,065——————————–16. Providence: -15,189 17. Nashville: -128,228—————————————17. Nashville: -15,122 18. Milwaukee: -123,806————————————-18. Jacksonville: -14,089 19. Jacksonville: -114,660———————————–19. Milwaukee: -13,810 20. San Jose: -94,587—————————————-20. San Jose: -11,582 21. Austin: -89,867——————————————–21. Austin: -11,445 22. Dayton: -77,893——————————————-22. Dayton: -8,506 23. Grand Rapids: -69,869———————————-23. Grand Rapids: -7,947 24. Akron: -65,852——————————————–24. Akron: -7,196 25. Youngstown: -64,558————————————25. Omaha: -6,931 26. Omaha: -62,030——————————————26. Youngstown: -6,842 27. Toledo: -59,436——————————————-27. Toledo: -6,624 28. Wichita: -51,734——————————————28. Wichita: 5,732 29. Des Moines: -44,857————————————29. Des Moines: 5,175 30. Canton: -41,233——————————————30. Lansing: -4,577 31. Lansing: -40,586—————————————–31. Madison: -4,453 32. Madison: -39,499—————————————-32. Canton: -4,395
Total Net Natural Change (Births vs. Deaths) By Metro Census 2010-July 1, 2019 and July 1, 2018-July 1, 2019 Census 2010-July 1, 2019———————————July 1, 2018-July 1, 2019 1. Chicago: 438,246———————————————1. Chicago: 33,924 2. Minneapolis: 209,124—————————————-2. Minneapolis: 20,312 3. Austin: 149,806———————————————–3. Austin: 14,670 4. San Antonio: 146,693—————————————4. San Antonio: 14,041 5. San Jose: 126,304——————————————-5. San Jose: 10,905 6. Columbus: 108,626——————————————6. Columbus: 10,392 7. Las Vegas: 105,372—————————————–7. Indianapolis: 9,622 8. Kansas City: 98,218—————————————–8. Nashville: 9,186 9. Indianapolis: 97,491—————————————–9. Las Vegas: 9,129 10. Portland: 96,518——————————————-10. Kansas City: 8,805 11. Sacramento: 94,910————————————–11. Sacramento: 7,819 12. Nashville: 88,741——————————————12. Portland: 7,746 13. Detroit: 84,753———————————————-13. Detroit: 6,728 14. Virginia Beach: 78,552———————————–14. Cincinnati: 6,613 15. Cincinnati: 73,617—————————————–15. Virginia Beach: 6,309 16. St. Louis: 68,389——————————————-16. Omaha: 5,917 17. Omaha: 60,276———————————————17. Grand Rapids: 5,392 18. Milwaukee: 59,009—————————————–18. Milwaukee: 5,117 19. Grand Rapids: 55,687————————————19. Jacksonville: 4,503 20. Jacksonville: 52,866————————————–20. Des Moines: 4,136 21. Des Moines: 40,673————————————–21. St. Louis: 4,017 22. Wichita: 29,769——————————————–22. Madison: 2,535 23. Madison: 28,060——————————————23. Wichita: 2,325 24. Cleveland: 14,479—————————————-24. Lansing: 1,125 25. Lansing: 14,093——————————————25. Providence: 993 26. Providence: 13,788————————————–26. Dayton: 885 27. Toledo: 12,412——————————————–27. Toledo: 804 28. Dayton: 10,890——————————————-28. Cleveland: 539 29. Akron: 3,307———————————————-29. Akron: 0 30. Canton: -503———————————————-30. Canton: -141 31. Youngstown: -12,813———————————–31. Youngstown: -1,392 32. Pittsburgh: -35,527————————————–32. Pittsburgh: -4,817
Total Domestic Migration By Metro Census 2010-July 1, 2019 and July 1, 2018-July 1, 2019 Census 2010-July 1, 2019———————————July 1, 2018-July 1, 2019 1. Austin: 293,162———————————————–1. Austin: 41,334 2. San Antonio; 214,509—————————————2. Las Vegas: 31,643 3. Las Vegas: 185,570—————————————–3. San Antonio: 21,987 4. Nashville: 158,336——————————————-4. Jacksonville: 20,051 5. Jacksonville: 126,483—————————————5. Nashville: 15,482 6. Portland: 121,473——————————————–6. Sacramento: 9,941 7. Sacramento: 69,723—————————————-7. Portland: 8,374 8. Columbus: 53,301——————————————-8. Indianapolis: 6,196 9. Indianapolis: 46,076—————————————-9. Columbus: 3,746 10. Des Moines: 40,183————————————–10. Des Moines: 3,718 11. Kansas City: 24,457————————————–11. Minneapolis: 3,202 12. Madison: 15,880——————————————12. Kansas City: 2,437 13. Minneapolis: 11,638————————————–13. Madison: 1,418 14. Grand Rapids: 10,903———————————–14. Cincinnati: 1,193 15. Omaha: 7,537———————————————-15. Omaha: 1,068 16. Canton: -7,124———————————————16. Dayton: 896 17. Dayton: -15,586——————————————–17. Wichita: -291 18. Akron: -15,683———————————————-18. Grand Rapids: -669 19. Lansing: -18,240——————————————-19. Canton: -677 20. Youngstown: -19,317————————————-20. Youngstown: -751 21. Cincinnati: -19,944—————————————-21. Lansing: -840 22. Wichita: -21,454——————————————-22. Akron: -1,190 23. Toledo: -27,740——————————————–23. Virginia Beach: -2,197 24. Pittsburgh: -31,804—————————————24. Toledo: -2,339 25. Providence: -38,503————————————-25. Pittsburgh: -2,658 26. Virginia Beach: -59,729———————————26. Providence: -3,185 27. Milwaukee: -64,395————————————–27. Milwaukee: -5,140 28. Cleveland: -78,763————————————–28. Cleveland: -7,250 29. St. Louis: -85,003—————————————-29. St. Louis: -7,685 30. San Jose: -124,105————————————-30. Detroit: -16,655 31. Detroit: -172,225—————————————–31. San Jose: -27,495 32. Chicago: -638,599—————————————32. Chicago: -74,950
Total International Migration By Metro Census 2010-July 1, 2019 and July 1, 2018-July 1, 2019 Census 2010-July 1, 2019———————————July 1, 2018-July 1, 2019 1. Chicago: 197,093——————————————-1. Chicago: 15,257 2. San Jose: 152,520—————————————–2. San Jose: 13,371 3. Detroit: 110,907———————————————3. Detroit: 7,516 4. Minneapolis: 87,847—————————————4. Minneapolis: 6,645 5. Austin: 62,740———————————————–5. Indianapolis: 6,394 6. Columbus: 58,853——————————————6. Austin: 5,280 7. Sacramento: 51,225—————————————7. Nashville: 4,937 8. Providence: 49,015—————————————-8. Providence: 4,455 9. Portland: 47,983——————————————–9. Sacramento: 4,053 10. San Antonio: 45,348————————————10. Columbus: 4,032 11. Indianapolis: 43,502————————————-11. St. Louis: 2,991 12. Nashville: 39,422—————————————–12. Portland: 2,960 13. Virginia Beach: 36,319———————————-13. Pittsburgh: 2,555 14. Cleveland: 36,318—————————————-14. San Antonio: 2,504 15. Jacksonville: 34,089————————————-15. Kansas City: 2,377 16. St. Louis: 32,872—————————————–16. Jacksonville: 2,251 17. Cincinnati: 31,157—————————————-17. Cincinnati: 1,547 18. Pittsburgh: 30,654—————————————-18. Omaha: 1,517 19. Kansas City: 27,259————————————-19. Lansing: 1,452 20. Milwaukee: 25,298—————————————20. Cleveland: 1,433 21. Las Vegas: 23,319—————————————21. Grand Rapids: 1,316 22. Lansing: 19,865——————————————22. Milwaukee: 1,277 23. Grand Rapids: 17,629———————————-23. Virginia Beach: 1,165 24. Omaha: 16,785——————————————24. Madison: 988 25. Madison: 15,600—————————————–25. Akron: 836 26. Dayton: 13,473——————————————26. Dayton: 785 27. Akron: 13,086——————————————–27. Wichta: 688 28. Des Moines: 11,716————————————28. Des Moines: 519 29. Wichita: 9,096——————————————-29. Toledo: 270 30. Toledo: 5,646——————————————–30. Canton: 25 31. Youngstown: 2,675————————————-31. Youngstown: 25 32. Canton: 1,073——————————————–32. Las Vegas: -360
Total Net Migration By Metro Census 2010-July 1, 2019 and July 1, 2018-July 1, 2019 Census 2010-July 1, 2019———————————July 1, 2018-July 1, 2019 1. Austin: 355,902———————————————1. Austin: 46,614 2. San Antonio: 259,857————————————-2. Las Vegas: 31,283 3. Las Vegas: 208,889—————————————3. San Antonio: 24,491 4. Nasvhille: 197,758—————————————–4. Jacksonville: 22,302 5. Portland: 169,456——————————————5. Nashville: 20,419 6. Jacksonville: 160,572————————————-6. Sacramento: 13,994 7. Sacramento: 120,948————————————-7. Indianapolis: 12,590 8. Columbus: 112,154—————————————-8. Portland: 11,334 9. Minneapolis: 99,458—————————————9. Minneapolis: 9,847 10. Indianapolis: 89,578————————————10. Columbus: 7,778 11. Des Moines: 51,899————————————-11. Kansas City: 4,814 12. Kansas City: 51,716————————————-12. Des Moines: 4,237 13. Madison: 31,480——————————————13. Cincinnati: 2,740 14. Grand Rapids: 28,352———————————–14. Omaha: 2,585 15. San Jose: 28,415—————————————-15. Madison: 2,406 16. Omaha: 24,322——————————————-16. Dayton: 1,681 17. Cincinnati: 11,213—————————————-17. Providence: 1,270 18. Providence: 10,512————————————–18. Grand Rapids: 647 19. Lansing: 1,625——————————————–19. Lansing: 612 20. Pittsburgh: -1,150—————————————-20. Wichita: 397 21. Dayton: -2,113——————————————–21. Pittsburgh: -103 22. Akron: -2,597———————————————-22. Akron: -354 23. Canton: -6,051——————————————–23. Canton: -652 24. Wichita: -12,358——————————————24. Youngstown: -726 25. Youngstown: -16,642————————————25. Virginia Beach: -1,032 26. Toledo: -22,094——————————————-26. Toledo: -2,069 27. Virginia Beach: -23,410——————————–27. Milwaukee: -3,863 28. Milwaukee: -39,097————————————-28. St. Louis: -4,694 29. Cleveland: -42,445————————————–29. Cleveland: -5,817 30. St. Louis: -52,131—————————————-30. Detroit: -9,139 31. Detroit: -61,318——————————————31. San Jose: -14,124 32. Chicago: -441,506————————————–32. Chicago: -59,693
The 2019 metro population estimates show Columbus largely holding its own against state, regional and national peers.
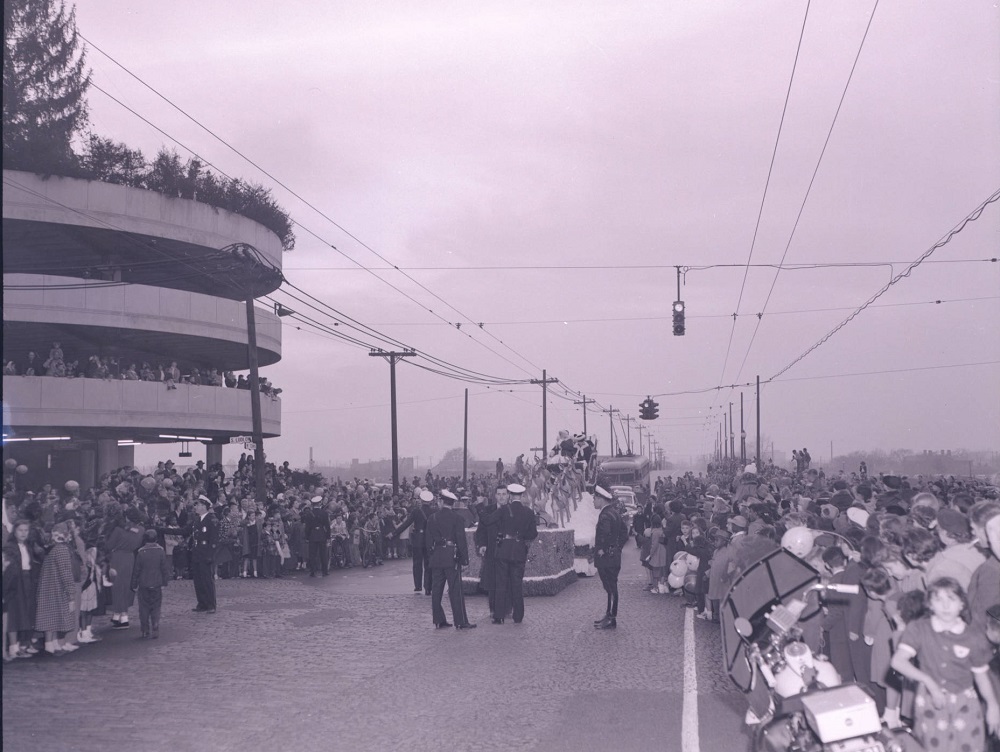
These Columbus Christmases past photos give a short walk down memory lane of one of the most popular and favorite holidays.
Date: 1952 Location: Corner of W. Town Street and S. Ludlow Street along the Scioto River. Santa and Mrs. Claus ride on a float in the annual Lazarus Christmas parade.
Date: 1980 Location: Ohio Expo Center Multipurpose Building at 717 E. 17th Avenue. The Festival of Trees was an annual event sponsored by Children’s Hospital and Nationwide for charities. In 1980, there were 82 themed Christmas trees on display, which people could buy for at prices up to $1,000 each.
Date: Christmas Day, 1983 Location: Corner of Ebner and Columbus Street, German Village Christmas 1983 was one of the coldest on record, with a high of just 1 degree above zero and an average temperature of -6. The cold caused water mains to burst in several locations, including in German Village, which some children took advantage of for a little fun.
Date: 1965 Location: 518 E. Broad Street State Auto Mutual Insurance began holding a Christmas lighting event every year beginning in 1931.
Date: Around 1955 Location: Lazarus Department Store, South High Street Lazarus was famous for its window Christmas displays for well over 100 years, with many being very elaborate. The Christmas displays continued until the 2000s.
Date: 1992 Location: Scioto Riverfront, Downtown The replica of Christopher Columbus’ Santa Maria, decorated for Christmas in the photo, sat in Battelle Riverfront Park from 1991 until it was permanently dismantled during construction of Scioto Greenways in 2014.
As mentioned in the previous post, the Columbus Landmarks Foundation has been creating a Most Endangered List for historic buildings under threat of demolition since 2014. What has happened to those buildings? This post seeks to find out. While I did not research every building on the lists, I managed to get most of those that were inside I-270 and were built prior to 1950. Here are those Columbus Landmarks endangered list buildings.
Original Port Columbus Terminal Tower Address: 4920 E. 5th Avenue Built: 1920 List Appearances: 2014, 2015, 2016 Status: Renovated and Saved
Original Port Columbus Terminal.
This terminal building predates Port Columbus by a full 9 years, and is a very rare example of early air architecture. In 2015, Heartland Bank planned to build its HQ inside, but after performing some of the work, abandoned the project due to renovation complications. This caused concern that the building would be unable to find a new buyer. Eventually, though, new owers scraped together some funding to turn it into an aviation museum.
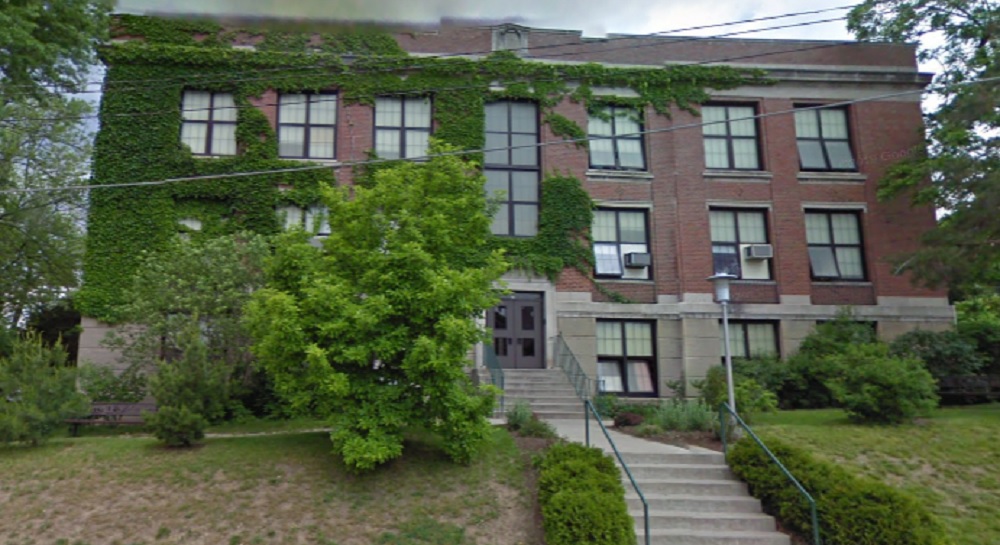
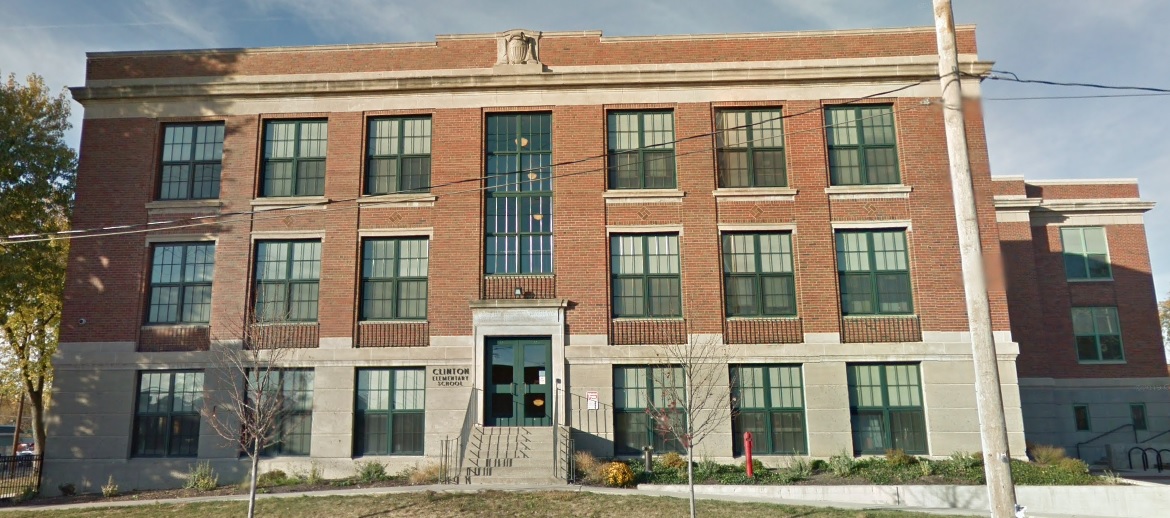
Clinton Avenue School Address: 10 Clinton Heights Avenue Built: 1895 List Appearances: 2014 Status: Renovated and Saved
The school building in 2009.
The school after renovation.
This old school sat in a prime location along North High Street, and after sitting disused for several years, there was concern that Columbus City Schools would demolish it or sell the site to developers. Luckily, that didn’t happen. In 2015, the district renovated and expanded the school into Clinton Elementary.
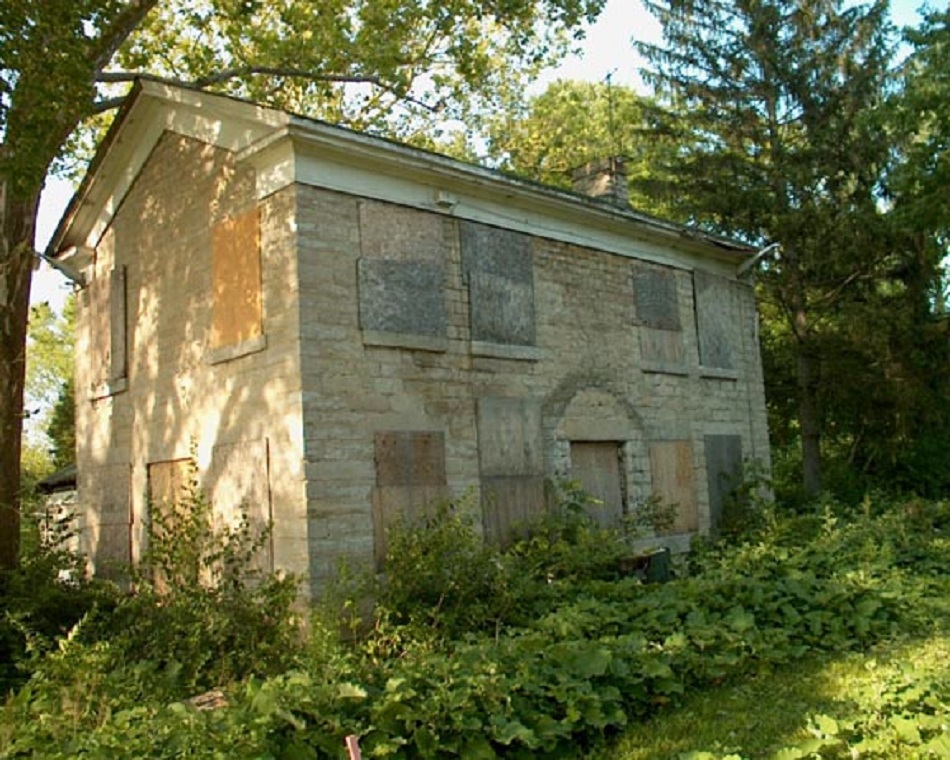
Elam Drake Farm Address: 2738 Ole Country Lane Built: Around 1850 List Appearances: 2014, 2015, 2016, 2017 Status: Existing, but Deteriorating Elam Drake was one of Columbus’ earliest masons and many of his buildings are still on the National Register of Historic Places. The farm is owned by the Columbus Regional Airport Authority. While it is unlikely to be demolished by the airport due to being on the opposite side of I-670, it is close enough to the highway (you can see it very easily on the right heading west) to be under constant threat of highway expansion. Because it is abandoned, the structure also continues to deteriorate and may just be demolished eventually due to poor condition.
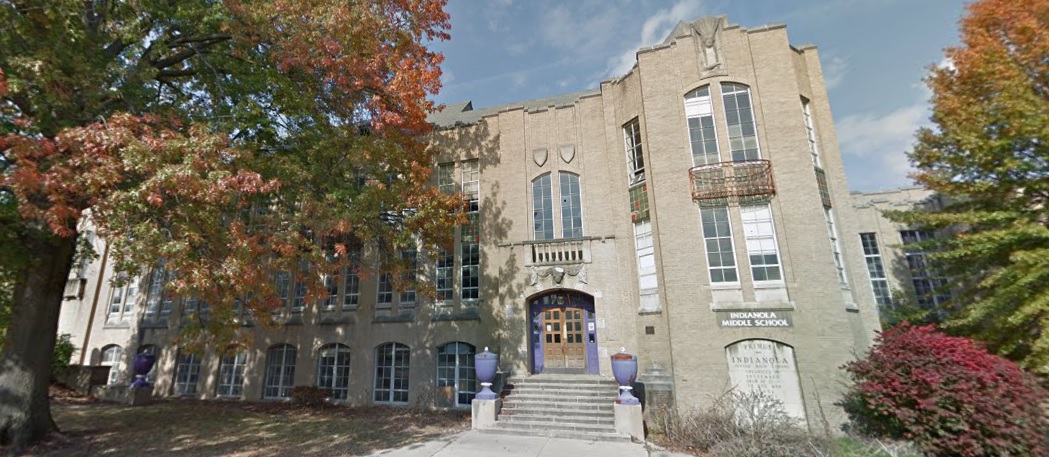
Indianola Junior High School Address: 420 E. 19th Avenue Built: 1929 List Appearances: 2014, 2015, 2016 Status: Existing, but Deteriorating
Indianola in 2015.
Indianola has the honor of being the very first middle school in the United States, and many districts eventually copied the model. The building was abandoned in 2010, and over the next several years, vandalism and neglect slowly damaged the building. Columbus City Schools tried to sell the building, but wasn’t successful until 2018, when Ohio State purchased it. As of the end of 2019, there have been no formal plans announced for the future of the building, and it continues to fall into disrepair. Since the university has never been big on saving old buildings, the future could be grim.
Griggs Reservoir Dam Tender House Address: 2933 Riverside Drive Built: 1816 List Appearances: 2014 Status: Renovated, Saved
The dam tender house in 2003.
After renovation.
Originally the home of the Richards family on land deeded by John Adams, it became the home of the dam tender for Griggs in 1908. The dam tender manually controlled valves to allow water through the dam. After automation eliminated that job, the home stood abandoned for many years. Eventually, though, the building was renovated in 2015 to be event space for Griggs Reservoir Park.
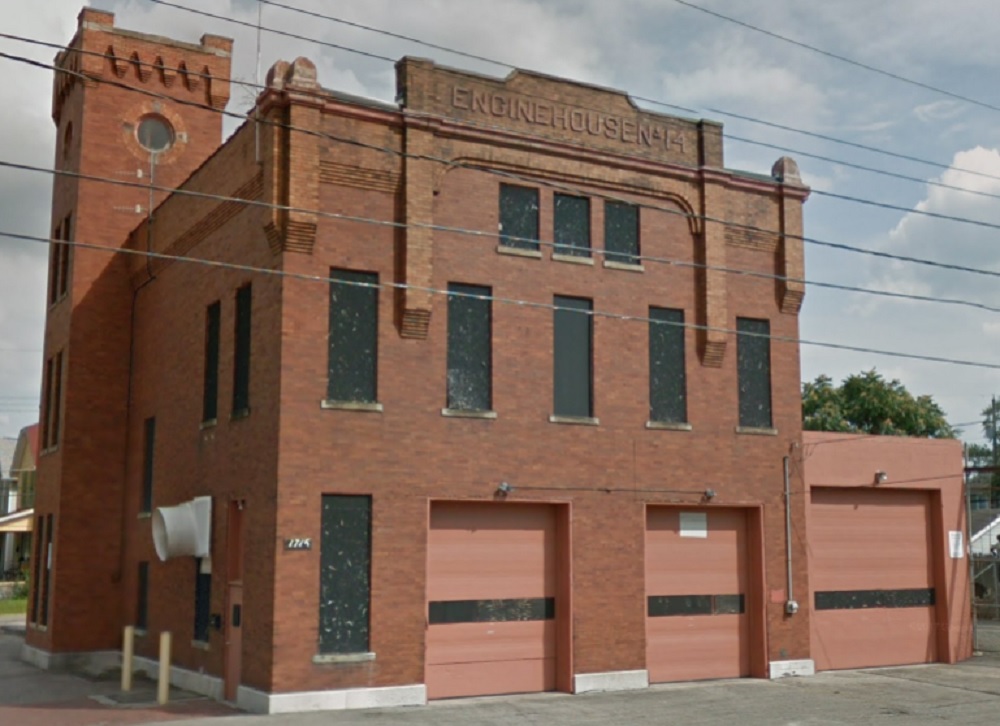
Engine House #14 Address: 1716 Parsons Avenue Built: Before 1900 List Appearances: 2014, 2015 Status: Existing, Stable
The firehouse in 2017.
Not much seems to be known about this building other than that it’s an interesting example of an old Columbus firehouse. The building has been empty for many years and has been for sale off and on recently. Currently, the building remains idle with no serious buyers lined up. As the area sees more revitalization, particularly along Parsons, the firehouse could come under threat by redevelopment pressures.
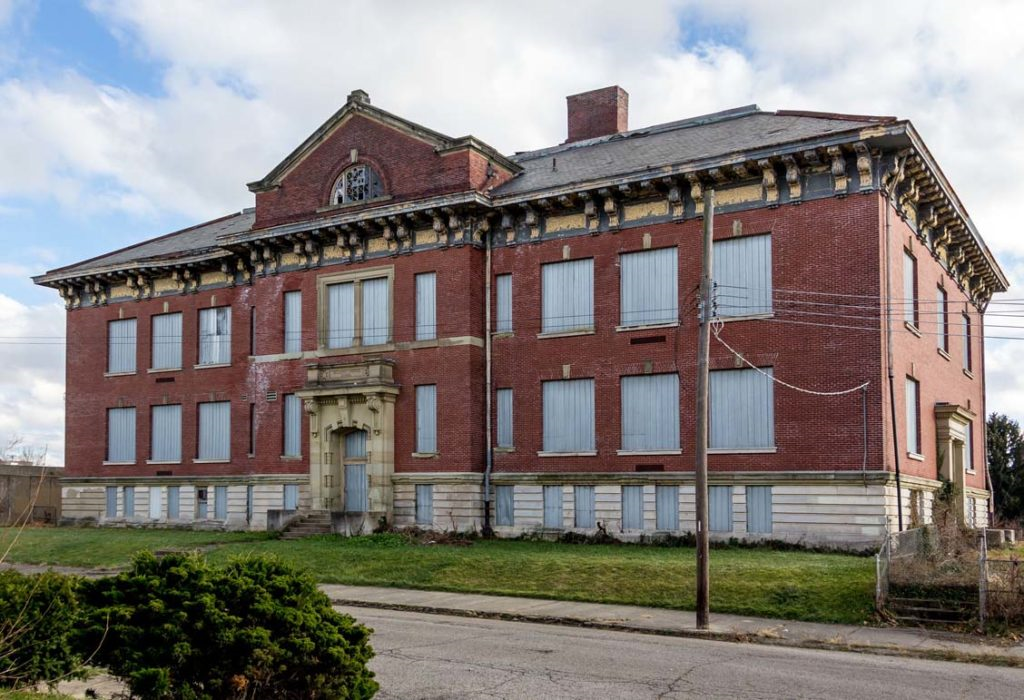
Bellows Avenue Elementary Address: 725 Bellows Avenue Built: 1905 List Appearances: 2014, 2015 Status: Existing, Stable This old elementary school operated until the 1970s and has been abandoned since. It narrowly escaped construction of 315, but a planned rework of the highway intersection threatens its eventual demolition. Despite that, a plan to renovate the school and build apartments or condos on the grounds popped up a few years back, but aside from some stabilization efforts to the school to prevent further building decline, nothing else has occurred.
Columbus Railway Power and Light Company Building Address: 838 Cleveland Avenue Built: 1915 List Appearances: 2014, 2015, 2016 Status: Existing, but Deteriorating
The building in 2017.
This building was part of the Columbus Central Street Railway Car Depot and Power House once located at this intersection. It has been abandoned for a long time with no plans to do anything with the building.
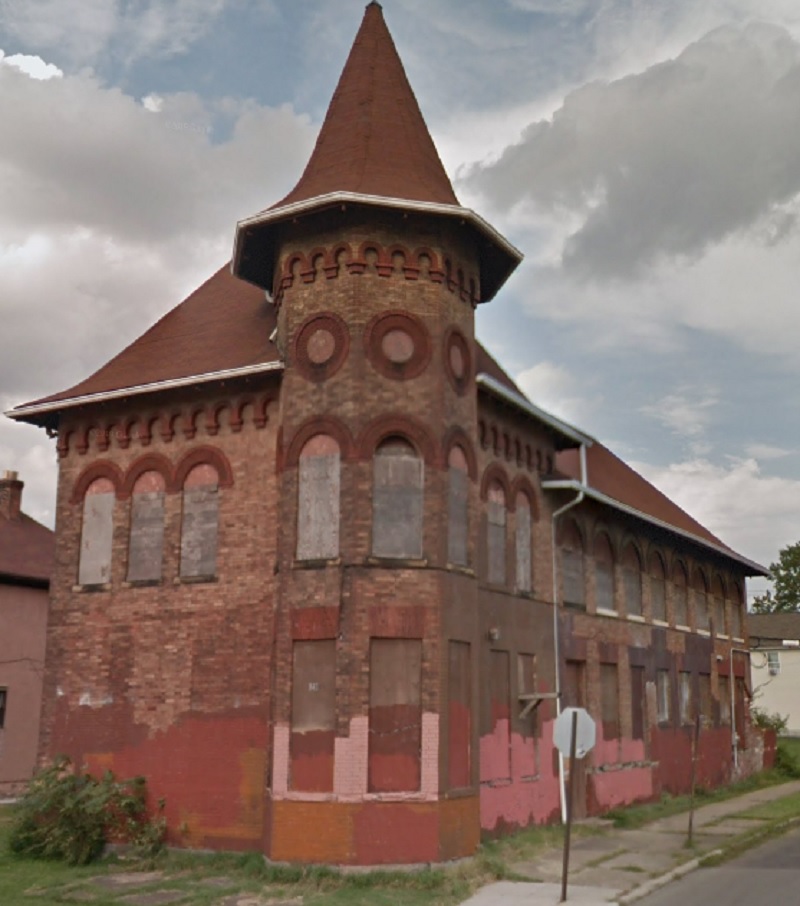
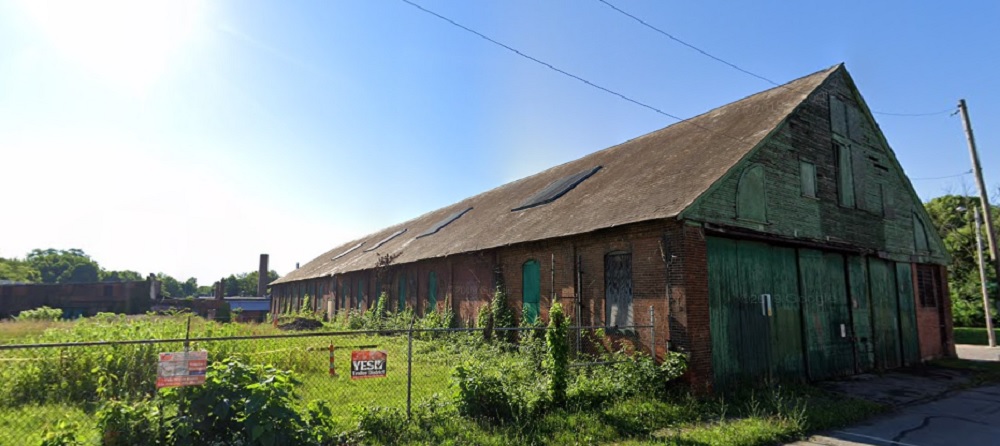
Near East Trolley Barn Complex Address: 1600 Oak Street Built: 1880-1900 List Appearances: 2014 Status: Existing, Deteriorating but with Redevelopment Plans
The main trolley barn and grounds in 2019.
This complex was used by trolley car lines for decades to store and repair trolley cars, but has been in disuse for more than half a century. The good news is that a long-awaited revitalization plan is now in the works to turn the complex into a mixed-use development complete with a market, retail space and apartments.
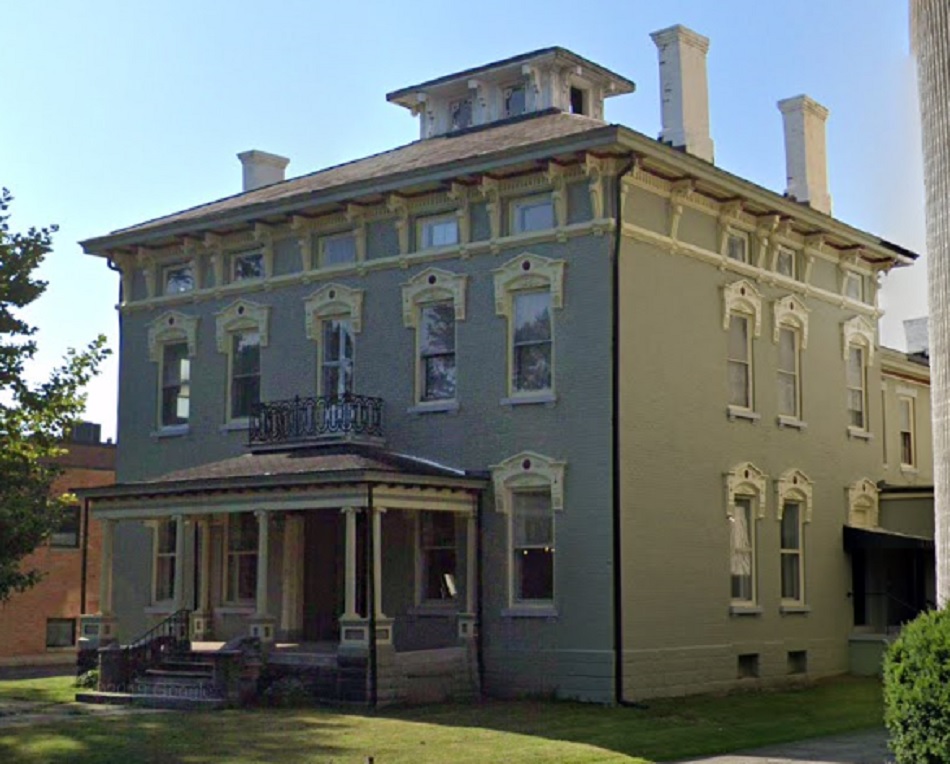
O’Shaughnessy Funeral Home Address: 405 E. Town Street Built: 1853 List Appearances: 2014 Status: Existing and Stable
The home in 2019.
One of the oldest remaining homes Downtown, this building has been used as a funeral home, offices and other functions over the years, but has been abandoned for decades. The home apparently needs significant interior renovations, so it remains a tough sell.
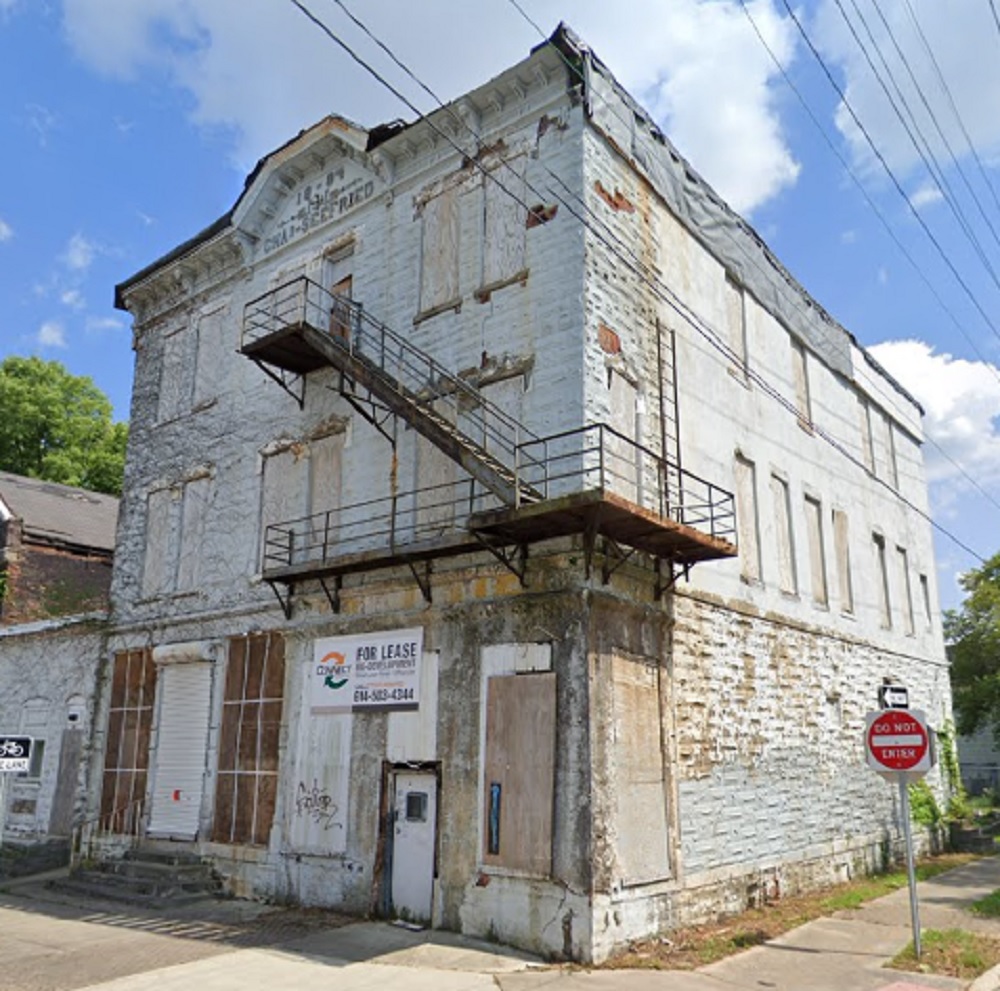
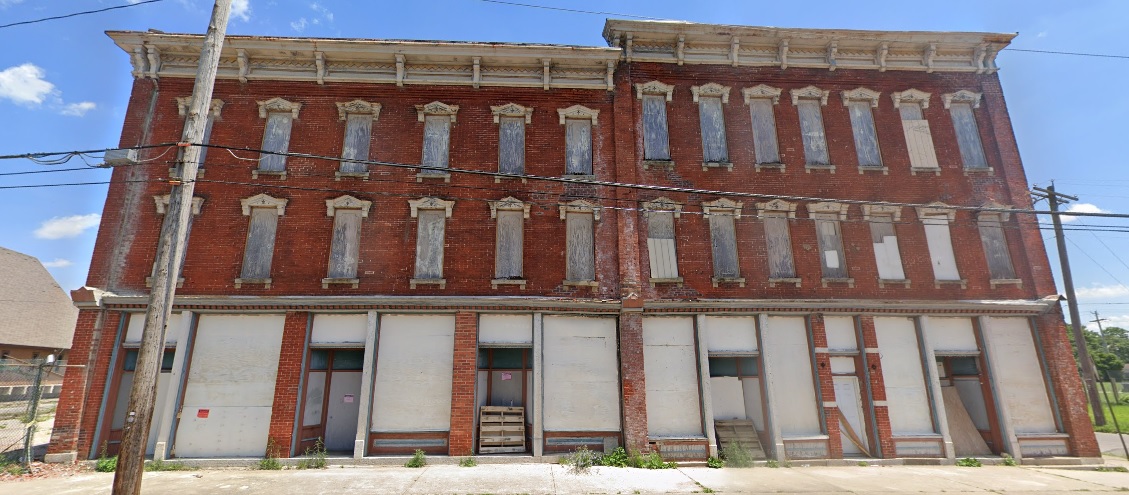
Kessler’s Corner Grocery Address: 553-555 W. Town Street Built: 1884 List Appearances: 2015 Status: Existing, but Deteriorating
Kessler’s in 2019.
One of just 4 masonry buildings that survived the Great Flood of 1913 in this part of Franklinton, the building has been abandoned for a few decades at least. East Franklinton, in which this building sits, is fast becoming one of the hottest neighborhoods in the city, with a large number of new construction projects coming up. This could serve to save the building through renovation, or put pressure towards its eventual demolition. Without stabilization efforts, renovation may come too late, anyway.
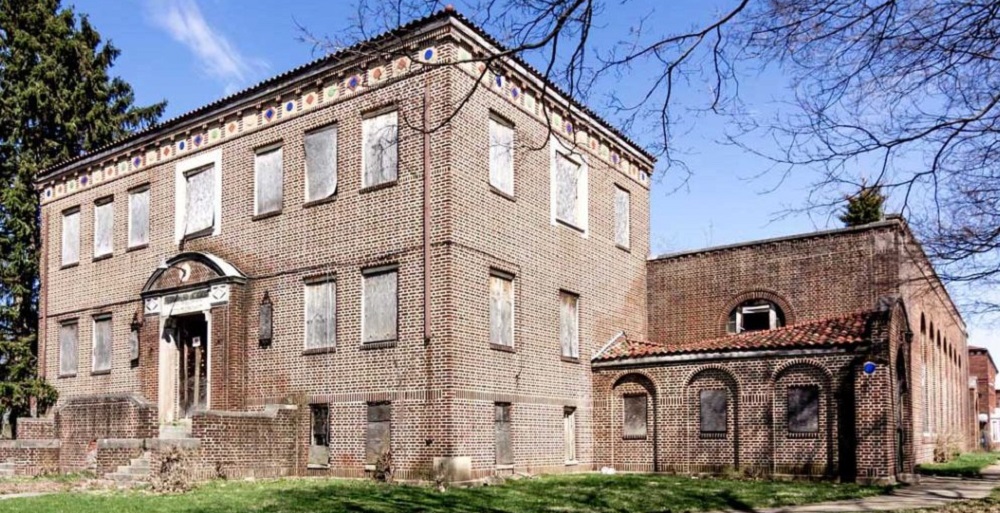
Holy Rosary Roman Catholic High School Address: 498 Berkeley Road Built: 1928 List Appearances: 2015, 2016, 2017, 2018 Status: Existing, but Deteriorating The school was used through the 1960s as part of the Holy Rosary Church complex. There are no current plans for the building.
Trott & Bean Architects, Inc. Building Address: 77 E. Nationwide Boulevard Built: 1910 List Appearances: 2015 Status: Demolished This former plating and silvering plant was later renovated by Trott & Bean as offices. It was demolished to build the Canopy Inn Hotel in 2017. The hotel built a similar looking facade to the original building on lower floors, but no part of the building was used.
One of the original homes in the Grandview Heights area, the Salzgaber family sold produce at North Market for many years. It came under threat in 2014 and early 2015 from a condo proposal. That proposal was later rejected and a new buyer preserved the house.
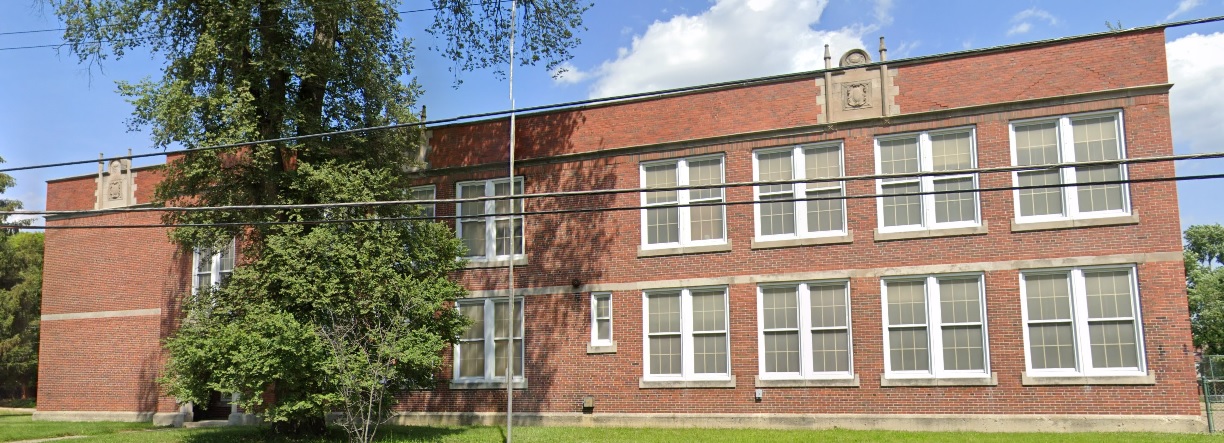
East Pilgrim Elementary School Address: 440 Taylor Avenue Built: 1921 List Appearances: 2015, Status: Existing and Stable
East Pilgrim Elementary in 2019.
Built as an overflow for the growing East Side student population, this school was abandoned in 2004. Columbus City Schools sold the build to Partners Achieving Community Transformation, or PACT, around 2010. PACT had originally proposed to renovate the building for adult educational purposes, but later determined that renovation would cost more than tearing it down. However, community leaders were divided on the demolition plan, with many being opposed. So far, it seems no firm redevelopment plans have appeared, and the building continues to sit empty.
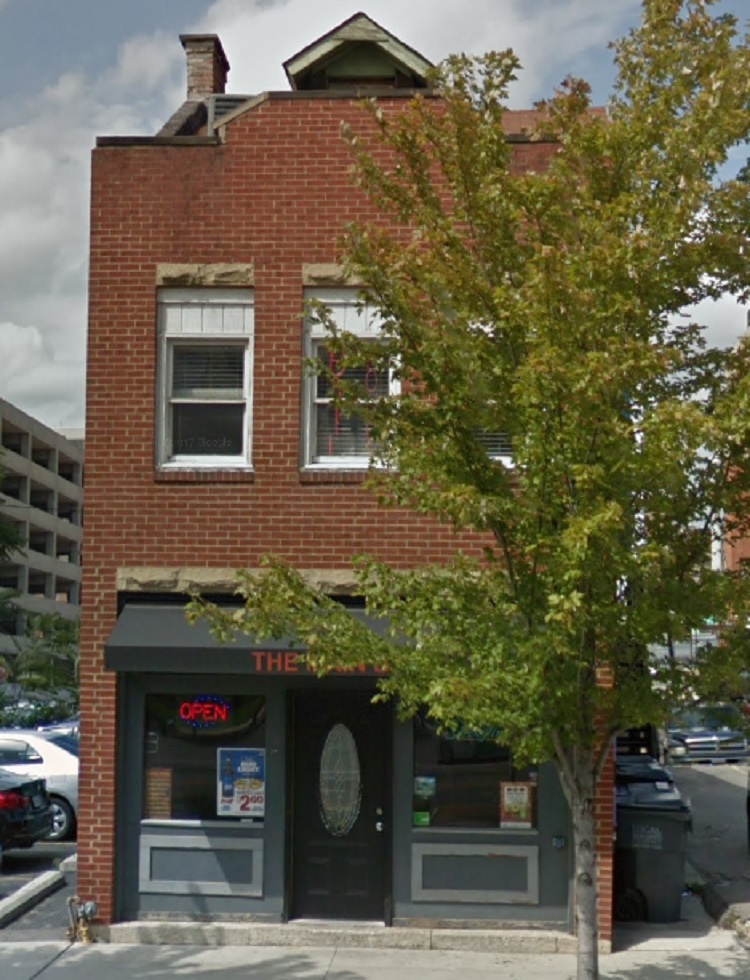
The Main Bar Address: 16 W. Main Street Built: 1880s List Appearances: 2015 Status: Existing and Stable
The Main Bar building in 2016.
One of only 2 remaining 19th Century buildings on Main Street between 3rd Street and Front Street Downtown, this building has been used as a saloon, offices, bar and residences over the years. The RiverSouth area has been steadily redeveloped in recent years, and though no specific project is planned for the site yet, it’s only a matter of time.
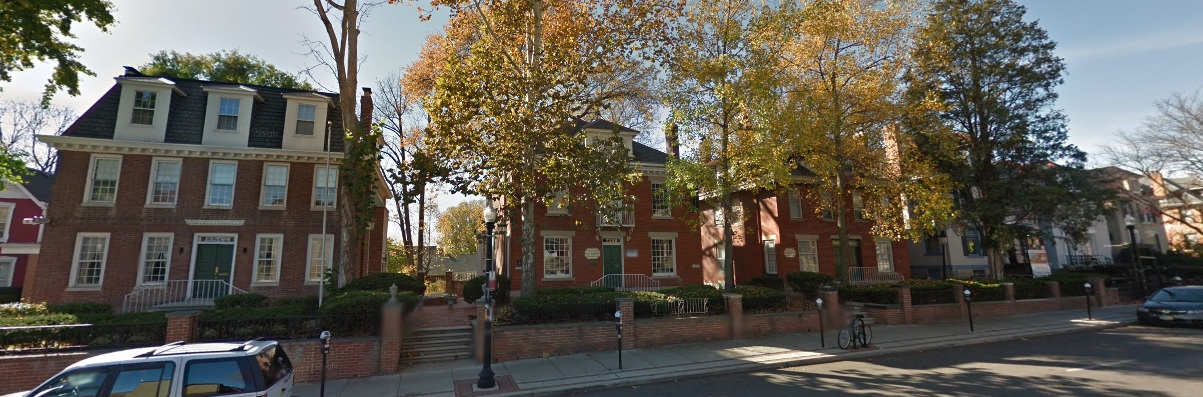
Pavey Block Address: Between West Northwood and and West Oakland Avenues along North High Street Built: Between 1900-1905 List Appearances: 2016 Status: Renovated and (Mostly) Saved
The Pavey Block in 2015.
The Pavey Block is named after Charles Pavey, a horse breeder, who built his home here at 2259 N. High Street. The block was one of the last intact original residential blocks on High Street south of Clintonville. In late 2015, a developer proposed a mixed-use development on the whole block called Pavey Square, which would have required the demolition of all 6 High Street homes, along with 2 additional homes on Oakland and Northwood and an old commercial building. After local residents and area commission members rejected the demolition, the developer eventually modified the project to incorporate all 6 main homes in their entirety to preserve the High Street streetscape.
Ohio National Bank Address: 167-169 S. High Street Built: Early 1900s List Appearances: 2016 Status: Existing and Stable
The bank building in 2019.
This bank building has been abandoned since the 1990s. Though no plans have emerged for it, the surrounding part of Downtown has been booming with new development, which could eventually threaten the property.
Macon Hotel Building Address: 366 N. 20th Street Built: 1888 List Appearances: 2016, 2018 Status: Existing, but Deteriorating
The Macon in 2019.
Built as a hotel, the site was a popular hotel for jazz musicians visiting the city before WWII, and the building later became a club and lounge. In 2017, there was a proposal to renovate the building into residential units, but so far, nothing has come of that proposal beyond some gut work on lower floors.
124 South Washington House Address: 124 S. Washington Street Built: 1869 List Appearances: 2016 Status: Existing and Stable This old home, one of the few remaining Downtown on Washington Street, is threatened by plans by Motorists Mutual to develop the site and nearby areas with mixed-use projects around Topiary Park. Planning maps have shown the house being demolished in the future.
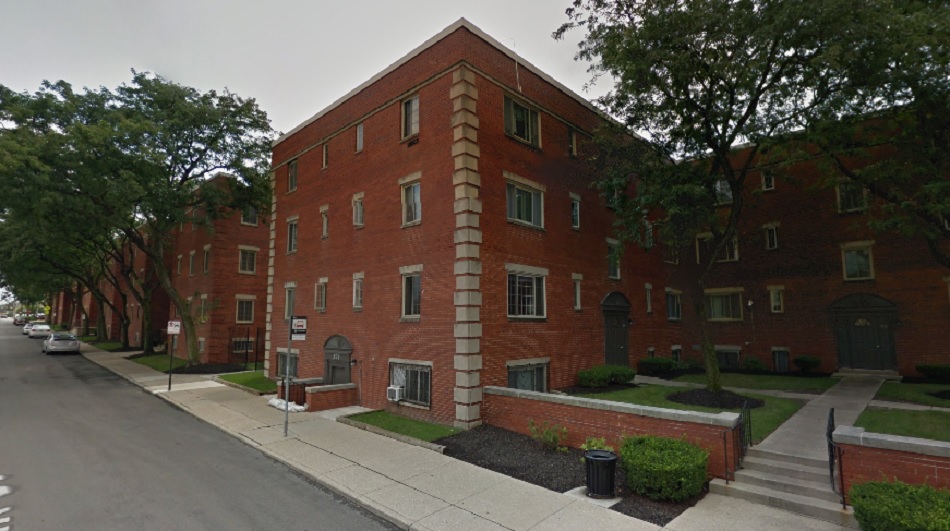
Grant-Oak Apartments Address: Intersection of Oak and Grant Built: 1942 List Appearances: 2016 Status: Partially Saved, Partially Demolished
The apartments in 2016.
These WWII-era apartments were some of the last historic apartment blocks Downtown. Columbus Metropolitan Library bought the apartments in 1992, and in 2017 in partnership with Pizzuti, proposed demolishing all 7 of the buildings to construct a new, mixed-use development on the site. In 2019, after some pushback by community leaders, it was decided that 4 of the 7 buildings would be saved and renovated, while 3 of the remaining would be demolished for the mixed-use project. Those 3 were demolished over the summer of 2019.
Hayden Mausoleum Address: 1000 Green Lawn Cemetery Built: 1920 List Appearances: 2019 Status: Existing, but Deteriorating A recent entrant on these lists, Hayden Mausoleum was design by Frank Packard as the largest single-family mausoleum in Central Ohio. It is threatened due to the poor condition of its roof and increasing water damage, that without renovation, could cause it to collapse.
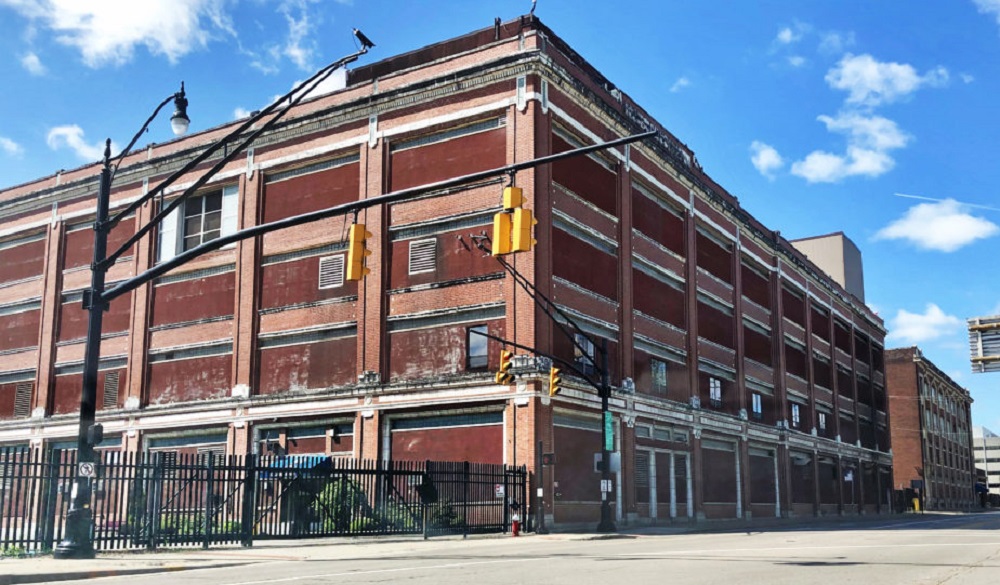
Kroger Bakery Building Address: 457 Cleveland Avenue Built: 1914 List Appearances: 2019 Status: Existing and Stable Another recent entry on to the endangered, this original Ford Motor Company assembly plant was long used as part of the Kroger Bakery. Kroger closed the factory earlier in 2019 and the building is now for sale. Given that the whole area is steadily improving, the site could either be bought and renovated into other uses, or demolished altogether for new development.
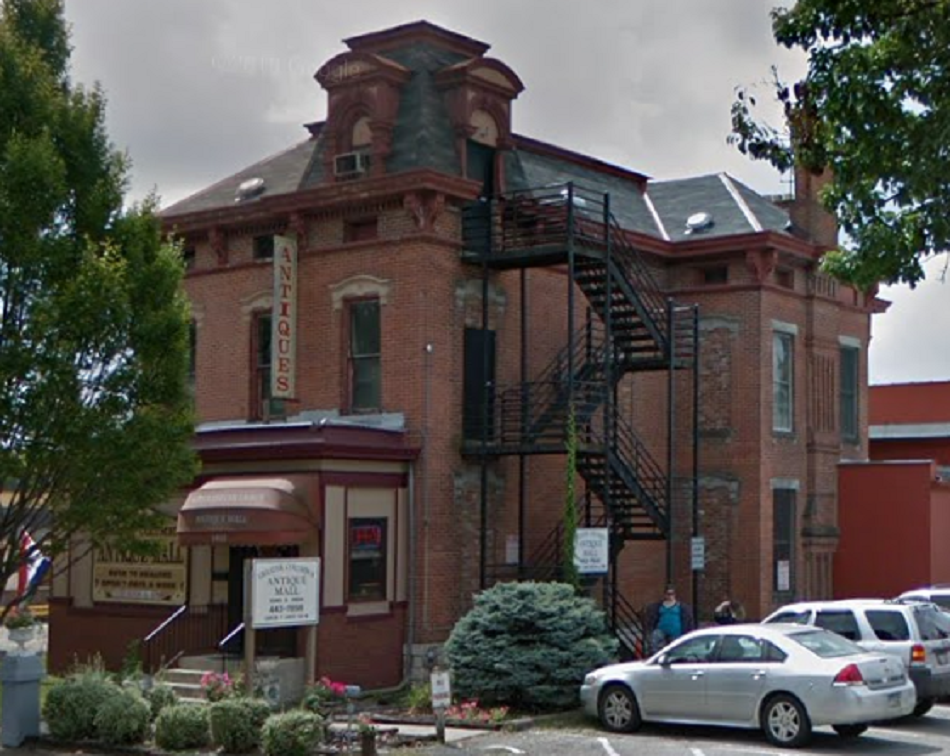
Greater Columbus Antiques Mall Address: 1049 S. High Street Year Built: 1889 List Appearances: 2018 Status: Existing and Saved The George Stanton house came under threat early in 2018 when Schiff Properties wanted to tear it down and put in a fast food outlet. The longtime owner and antiques seller wanted out of the business, and the home existed outside of historic area protections. Fortunately, there was enough public backlash to cause Schiff to pull the proposal. As to what might happen to this property remains to be seen. Some proposals have called for it to be moved to a new location, so it still could end up threatened again.
Overall, the vast majority of these buildings have fared well. While plenty are in dire condition and need desperate renovations to save them, that opportunity remains for most. Still many others did, indeed, receive the attention they needed and were saved from the wrecking ball. Of course, Columbus Landmarks Foundation only highlights perhaps a dozen or so buildings each year, and there are dozens more that never make the list at all and end up lost. It’s an important reminder that the best way to save these historic structures is by drawing as much attention to them as possible.
Columbus, like many cities, has a decidedly mixed history with historic preservation. It has lost so much, and it continues to lose more with every passing year. The Columbus Landmarks Foundation puts out of list every year of Columbus’ most endangered historic buildings in imminent danger of demolition. Here is 2019’s list. Not all of the threatened old buildings in Columbus get attention. Here are a few more that are likely to meet the wrecking ball relatively soon.
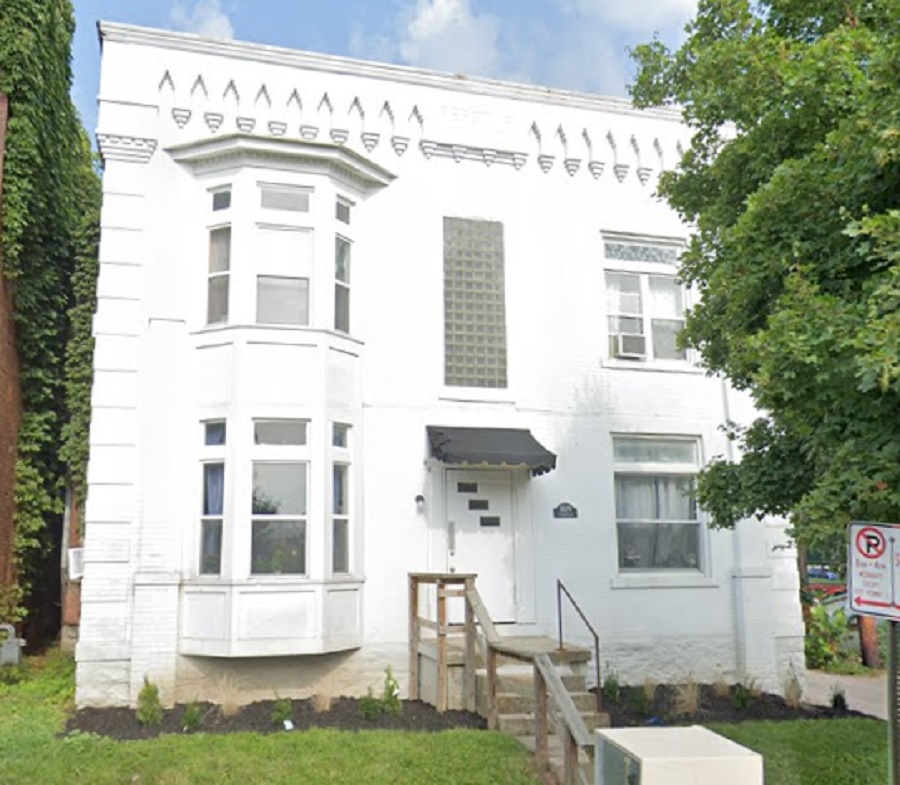
Highland and 11th Block 1619 Highland Street Built: 1905 Ohio State recently purchased this building after reportedly trying to buy it for decades. The university now owns the entire block that this building sits on, and the plans are for eventual redevelopment within a few years. What might replace it is not yet known.
1619 Highland in 2019.
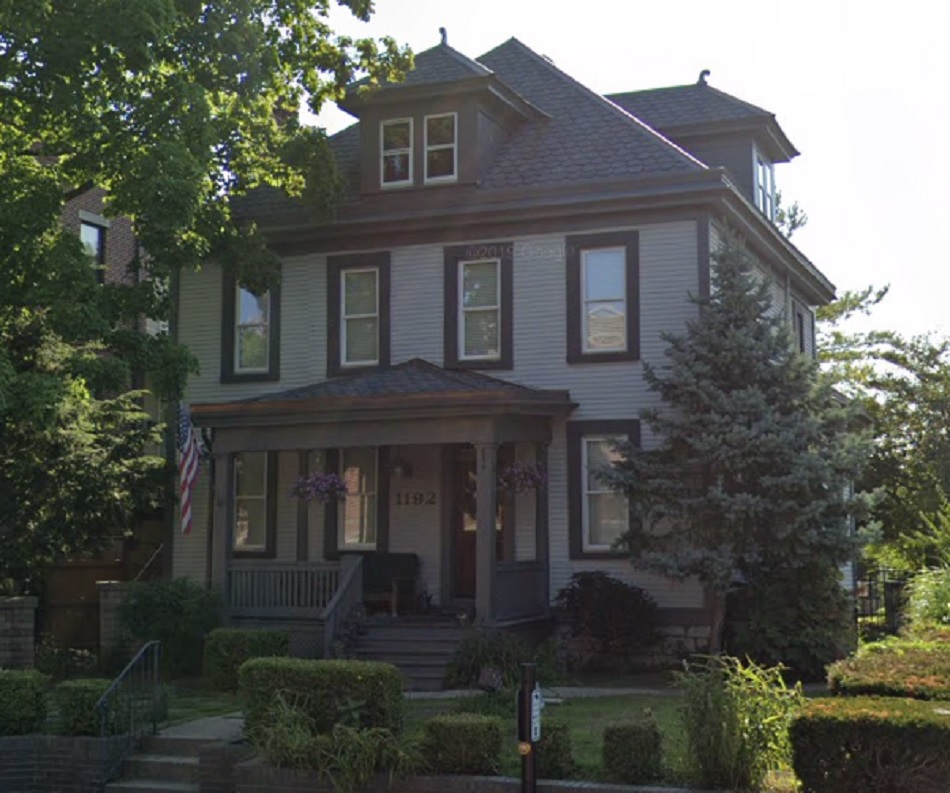
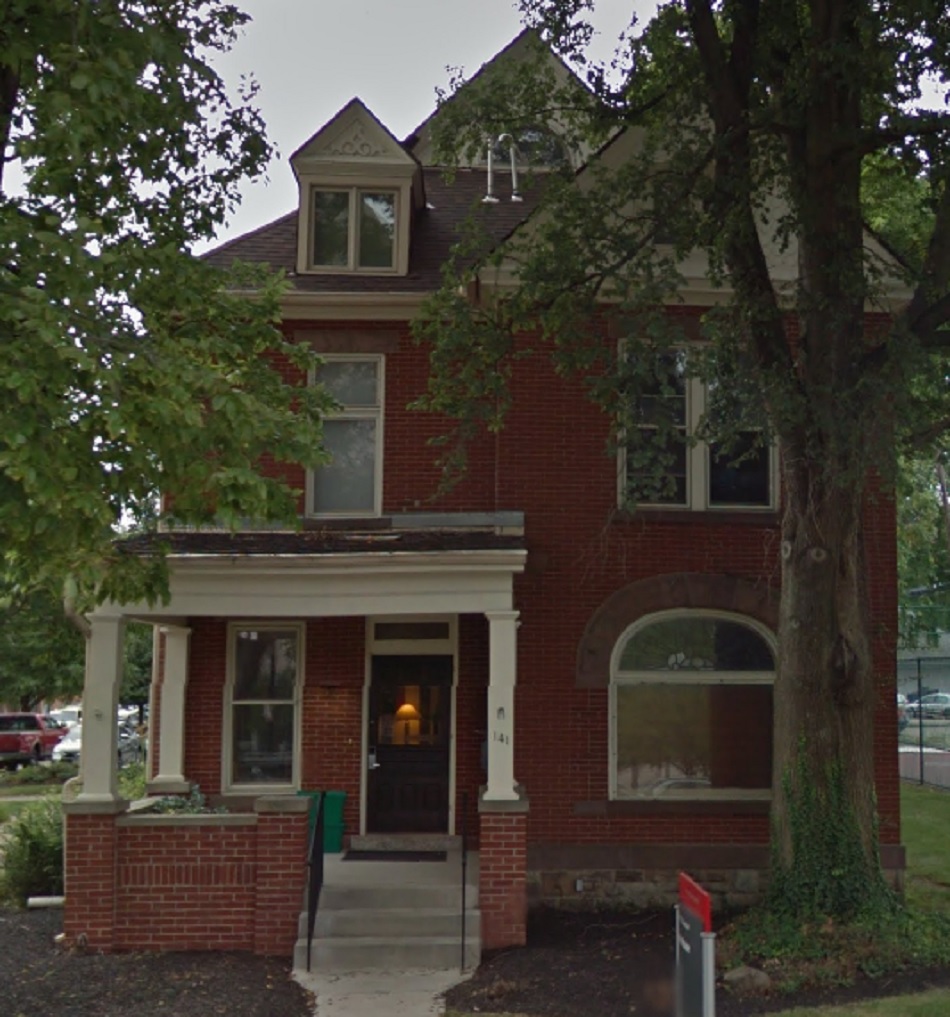
141 W. 11th Avenue Built: 1890s If OSU decides to redevelop the entire block, and that seems to be the plan, another historic building near 1619 Highland could also be lost. The German House is the last remaining original home this far west on 11th Avenue in what was once a historic neighborhood. OSU has systematically demolished almost all of the other homes along 11th Avenue, beginning in the 1950s. While there are no announced plans for its demolition, news of the block’s redevelopment seem to predict this old home’s doom.
The German House in 2015.
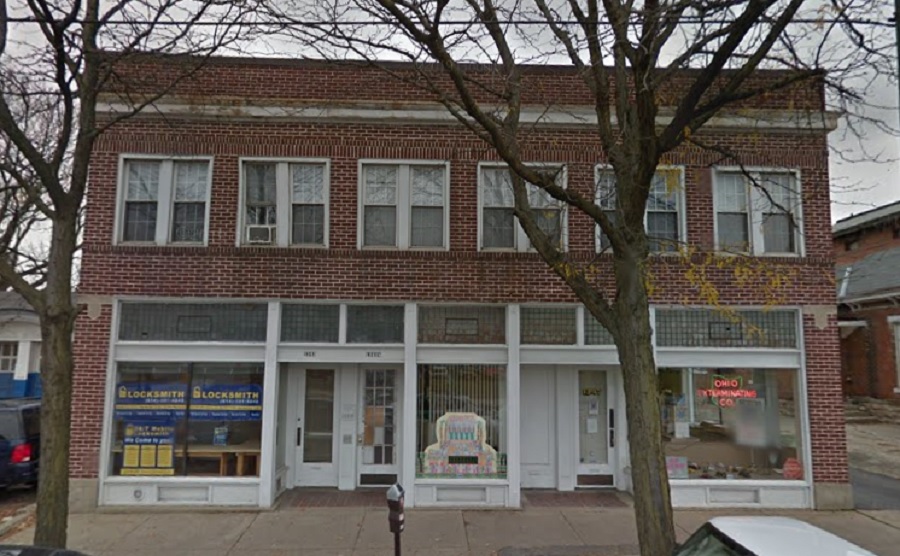
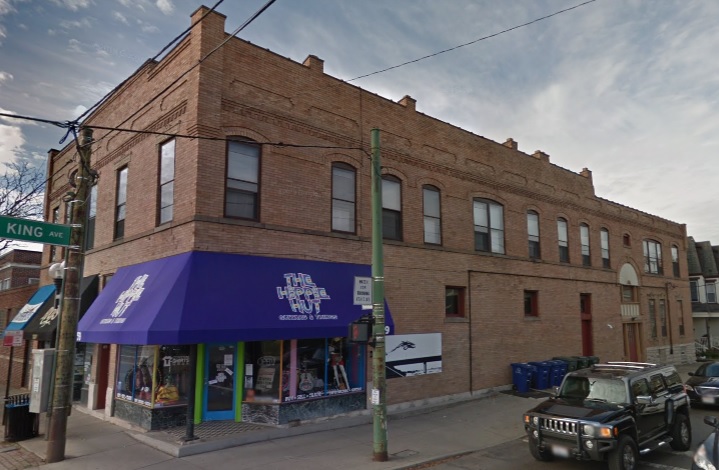
King and High Block 1343-1347 N. High Street Built: Around 1920
1343-1347 North High in 2017.
1355-1359 N. High Street Built: Around 1890
1355-1359 N. High Street in 2015.
Both of these High Street properties, directly across the street from the Weinland Park Kroger, are under threat from a proposed redevelopment plan. Originally, the developer had proposed an 11-story, mixed-use building for this block with the intention of incorporating both of the old buildings into the plan. However, it seems that they became frustrated with the approvals process, and so, in seemingly a total spite move, greatly reduced the size of the project as well as any intention of saving the old buildings. The out-of-state developer’s new design doesn’t require any variances, and so it seems like the final product is out of the hands of the local neighborhood commission and city, unfortunately. What could’ve been a great project is now essentially a middle finger from the developer and arguably one of the worst-designed proposals in recent years.