Worst Heat Waves in History


worst heat waves in history

What are the worst heat waves in history? The climate in Ohio is gradually getting warmer and wetter, and persistent record heat is becoming ever more common, but do recent heatwaves compare to those of the past? Let’s find out.

To find out what the worst heatwaves were, I looked at average temperatures for different consecutive time periods- 2 days, 3 days, 7 days, 10 days, 14 days and 30 days. Unsurprisingly, some historically hot summers popped up, particularly from the 1930s.

Top 10 2-Day Periods with the Warmest Average High Temperature
1. 7/21-7/22/1934: 104.5
2. 7/20-7/21/1934, 7/8-7/9/1936, 7/11-7/12/1936, 7/13-7/14/1936: 103.5
3. 7/24-7/25/1934, 7/25-7/26/1934, 7/9-7/10/1936: 103.0
4. 7/3-7/4/1911, 8/5-8/6/1918, 7/10-7/11/1936: 102.5
5. 7/9-7/10/1881, 7/12-7/13/1936: 102.0
6. 7/3-7/4/1897, 7/21-7/22/1901, 6/27-6/28/1944: 101.5
7. 7/6-7/7/2012: 101.0
8. 7/8-7/9/1881, 7/4-7/5/1911, 6/28-6/29/1934, 7/14-7/15/1936: 100.5
9. 7/7-7/8/1881, 8/6-8/7/1918, 7/20-7/21/1930, 7/26-7/27/1941, 7/7-7/8/1988, 7/8-7/9/1988, 7/15-7/16/1988: 100.0
10. 7/10-7/11/1881, 7/17-7/18/1887, 7/2-7/3/1911, 8/4-8/5/1918, 7/19-7/20/1930, 7/26-7/27/1936, 9/1-9/2/1953, 9/2-9/3/1953, 7/13-7/14/1954, 8/3-8/4/1955, 7/5-7/6/2012: 99.5

Top 10 3-Day Periods with the Warmest Average High Temperature
1. 7/20-7/22/1934, 7/9-7/11/1936, 7/12-7/14/1936: 103.3
2. 7/24-7/26/1934, 7/8-7/10/1936, 7/10-7/12/1936, 7/11-7/13/1936: 102.7
3. 7/8-7/10/1881: 101.3
4. 7/2-7/4/1911, 8/5-8/7/1918, 7/21-7/23/1934, 7/7-7/9/1936: 101.0
5. 7/3-7/5/1911, 7/13-7/15/1936: 100.7
6. 7/7-7/9/1881, 7/10-7/12/1881, 8/4-8/6/1918: 100.3
7. 7/9-7/11/1881, 7/23-7/25/1934, 7/7-7/9/1988, 7/5-7/7/2012: 100.0
8. 7/3-7/5/1897, 7/19-7/21/1934, 7/22-7/24/1934, 7/4-7/6/2012: 99.7
9. 7/6-7/8/1881, 7/19-7/21/1930, 9/1-9/3/1953: 99.3
10. 7/26-7/28/1941, 6/26-6/28/1944, 8/30-9/1/1953, 8/31-9/2/1953, 8/2-8/4/1955, 7/6-7/8/1988: 99.0

Top 10 7-Day Periods with the Warmest Average High Temperature
1. 7/8-7/14/1936: 103.1
2. 7/9-7/15/1936: 102.1
3. 7/20-7/26/1934, 7/7-7/13/1936: 101.7
4. 7/10-7/16/1936: 100.7
5. 7/19-7/25/1934, 7/11-7/17/1936: 100.3
6. 7/6-7/12/1881, 7/6-7/12/1936: 100.0
7. 7/21-7/27/1934: 99.4
8. 7/7-7/13/1881: 99.1
9. 7/5-7/11/1881: 99.0
10. 7/4-7/10/1881, 8/28-9/3/1953: 98.6

Top 10 10-Day Periods with the Warmest Average High Temperature
1. 7/8-7/17/1936: 101.0
2. 7/7-7/16/1936: 100.8
3. 7/6-7/15/1936: 100.2
4. 7/9-7/18/196: 99.8
5. 7/5-7/14/1936: 99.2
6. 7/4-7/13/1881: 98.0
7. 7/10-7/19/1936: 97.9
8. 7/3-7/12/1881: 97.8
9. 7/5-7/14/1881, 7/17-7/26/1934, 7/18-7/27/1934, 7/19-7/28/1934: 97.7
10. 7/6-7/15/1881: 97.4

Top 10 14-Day Periods with the Warmest Average High Temperature
1. 7/5-7/18/1936, 7/6-7/19/1936: 97.9
2. 7/4-7/17/1936: 97.6
3. 7/7-7/20/1936: 97.5
4. 7/3-7/16/1936: 97.1
5. 7/8-7/21/1936: 96.5
6. 7/2-7/15/1936: 96.0
7. 7/2-7/15/1881, 7/4-7/17/1881, 7/9-7/22/1936: 95.6
8. 7/13-7/26/1934: 95.5
9. 7/14-7/27/1934, 7/15-7/28/1934, 7/1-7/14/1936: 95.4
10. 7/16-7/29/1901, 7/17-7/30/1901: 95.1

Top 10 30-Day Periods with the Warmest Average High Temperature
1. 6/29-7/28/1936: 92.7
2. 6/28-7/27/1936: 92.6
3. 6/27-7/26/1934: 92.5
4. 6/26-7/25/1934, 6/30-7/29/1936: 92.3
5. 6/28-7/27/1934: 92.2
6. 7/6-8/4/1936, 7/13-8/11/1955: 92.1
7. 7/10-8/8/1955, 6/28-7/27/2012: 92.0
8. 6/25-7/24/1934, 6/27-7/26/1936, 7/1-7/30/1936, 7/2-7/31/1936, 7/5-8/3/1936, 7/7-8/5/1936, 7/14-8/12/1955, 6/27-7/26/2012: 91.9
9. 6/29-7/28/1934, 6/26-7/25/1936, 7/3-8/1/1936, 7/4-8/2/1936, 7/8-8/6/1955, 7/9-8/7/1955, 6/18-7/17/2012, 6/20-7/19/2012: 91.8
1. 6/25-7/24/1936, 7/23-8/21/1955: 91.7

The heat waves in 1934 and 1936 dominated for high temperatures, and for the most part, nothing before or since has really come close. 1881, 1901, 1918, 1955 and 2012, among others, all make appearances.

The Top 5 Highest Single-Day Temperatures Ever Recorded
1. 7/21/1934, 7/14/1936: 106
2. 7/9/1936: 105
3. 7/22/1901, 7/4/1911, 7/25/1934, 7/11/1936, 7/14/1954: 104
4. 7/10/1881, 8/5/1918, 7/22/1934, 7/12/1936: 103
5. 7/12/1881, 7/4/1897, 8/6/1918, 7/24/1934, 7/26/1934, 7/8/1936, 7/27/1936, 6/28/1944: 102


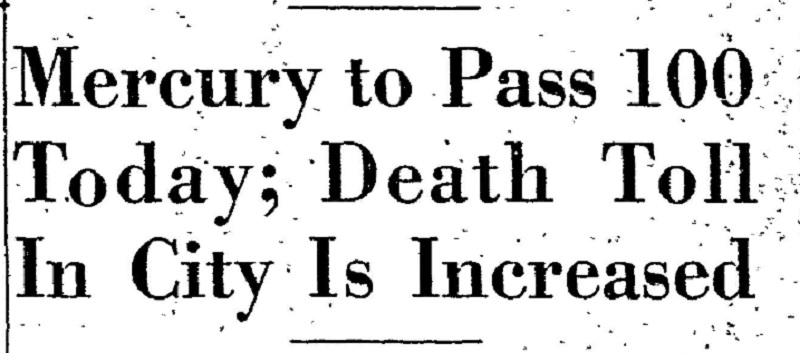
A Dispatch headline on July 13, 1936.

Now that we’ve see the worst periods for high temperature, let’s look at the worst for the mean temperature, which is the average between the high and low. Because this measurement includes the low temperatures, it could be considered the definitive look at what the absolute hottest heat waves in history really were.

Top 10 2-Day Periods with the Warmest Average Temperature
1. 7/21-7/22/1934: 92.0
2. 7/9-7/10/1881: 91.5
3. 7/9-7/10/1936: 90.5
4. 7/20-7/21/1934: 90.3
5. 7/25-7/26/1934, 7/13-7/14/1936: 90.0
6. 7/10-7/11/1881, 7/3-7/4/1911: 89.8
7. 8/5-8/6/1918, 7/20-7/21/1930: 89.3
8. 7/10-7/11/1936: 89.0
9. 7/4-7/5/1911, 7/24-7/25/1934, 7/12-7/13/1936, 7/30-7/31/1999: 88.8
10. 7/11-7/12/1881, 8/6-8/7/1918, 7/8-7/9/1936, 7/11-7/12/1936: 88.5

Top 10 3-Days Periods with the Warmest Average Temperature
1. 7/20-7/22/1934: 90.5
2. 7/8-7/10/1881: 90.3
3. 7/9-7/11/1881: 90.0
4. 7/10-7/12/1881, 7/9-7/11/1936: 89.8
5. 7/12-7/14/1936: 89.5
6. 7/21-7/23/1934: 89.3
7. 7/7-7/9/1881: 89.0
8. 8/5-8/7/1918, 7/24-7/26/1934, 7/8-7/10/1936, 7/10-7/12/1936: 88.8
9. 7/11-7/13/1936: 88.7
10. 7/3-7/5/1911, 7/13-7/15/1936: 88.5

Top 10 7-Day Periods with the Warmest Average Temperature
1. 7/8-7/14/1936, 7/9-7/15/1936: 89.1
2. 7/6-7/12/1881: 89.0
3. 7/20-7/26/1934: 88.9
4. 7/7-7/13/1881: 88.6
5. 7/5-7/11/1881, 7/10-7/16/1936: 87.9
6. 7/19-7/25/1934: 87.7
7. 7/8-7/14/1881: 87.6
8. 7/21-7/27/1934: 87.5
9. 7/7-7/13/1936: 87.4
10. 7/4-7/10/1881: 86.9

Top 10 10-Day Periods with the Warmest Average Temperature
1. 7/8-7/17/1936: 87.4
2. 7/7-7/16/1936: 87.2
3. 7/5-7/14/1881, 7/6-7/15/1881, 7/9-7/18/1936: 87.1
4. 7/4-7/13/1881: 86.9
5. 7/6-7/15/1936, 7/7-7/16/1881: 86.6
6. 7/3-7/12/1881: 86.2
7. 7/19-7/28/1934: 86.0
8. 7/18-7/27/1934, 7/10-7/19/1936: 85.7
9. 7/20-7/29/1934, 7/5-7/14/1936: 85.6
10. 7/8-7/17/1881, 7/17-7/26/1934: 85.4

Top 10 14-Day Periods with the Warmest Average Temperature
1. 7/3-7/16/1881, 7/4-7/17/1881: 85.1
2. 7/6-7/19/1936: 85.0
3. 7/5-7/18/1936: 84.9
4. 7/7-7/20/1936: 84.6
5. 7/2-7/15/1881, 7/5-7/18/1881, 7/4-7/17/1936: 84.5
6. 7/3-7/16/1936: 84.3
7. 7/6-7/19/1881, 7/8-7/21/1936, 7/18-7/31/1940: 83.9
8. 7/13-7/26/1934, 7/14-7/27/1934, 7/15-7/28/1934: 83.8
9. 7/2-7/15/1936: 83.7
10. 7/1-7/14/1881: 83.6

Top 10 30-Day Periods with the Warmest Average Temperature
1. 6/27-7/26/1934: 81.4
2. 6/28-7/27/1934: 81.3
3. 6/26-7/25/1934: 81.2
4. 6/29-7/28/1934, 7/19-8/17/1940, 7/20-8/18/1940, 6/28-7/27/2012: 81.0
5. 7/18-8/16/1940, 6/29-7/28/2012: 80.8
6. 6/25-7/24/1934, 6/27-7/26/2012: 80.7
7. 6/21-7/20/1878, 6/24-7/23/1934, 6/30-7/29/1934, 6/30-7/29/2012: 80.6
8. 6/20-7/19/1878, 6/22/1878-7/21/1878, 7/10-8/8/1916, 7/11-8/9/1916, 7/13-8/11/1916, 7/14-8/12/1916, 7/1-7/30/1934, 7/17-8/15/1940, 7/21-8/19/1940, 7/8-8/6/2011, 7/9-8/7/2011, 7/10-8/8/2011, 7/1-7/30/2012, 7/2-7/31/2012, 7/3-8/1/2012, 7/4-8/2/2012: 80.5
9. 6/19-7/18/1878, 7/12-8/10/1916, 6/28-7/27/1936, 6/29-7/28/1936, 7/3-8/1/1999, 7/3-8/1/2011, 7/5-8/3/2011, 7/6-8/4/2011, 7/7-8/5/2011, 7/11-8/9/2011, 7/5-8/3/2012: 80.4
10. 7/9-8/7/1916, 6/23-7/22/1934, 7/11-8/9/1934, 7/15-8/13/1934, 6/30-7/29/1936, 7/13-8/11/1955, 7/2-7/31/1999, 7/2-7/31/2011, 7/4-8/2/2011, 6/19-7/18/2012, 7/6-8/4/2012: 80.3

1934 and 1936 still dominate, but other years show up more often as well. Only 2012 shows up with anything in the last 60 years, though. That year also saw one of the worst wind events in Ohio history, partially fueled by the heat of that summer: North American Derecho of 2012

Finally, let’s look at periods that featured consecutive days with highs of 90 degrees or higher. What are the longest?

# of Consecutive Days with Highs 90 or Above
1. 7/3-7/16/1881: 14
2. 7/18-7/30/1940: 13
3. 6/24-7/5/1934, 7/7-7/18/1936, 6/28-7/9/1949, 7/21-8/1/1999, 6/29-7/10/2020: 12
4. 7/20-7/30/1901, 8/4-8/14/1918, 8/25-9/4/1953, 8/8-8/18/1988, 6/28-7/8/2012: 11
5. 7/27-8/5/1887, 9/7-9/16/1897, 7/29-8/7/1955, 6/13-6/22/1994: 10

A short video and article from 2016 about the 1936 heatwave, still the hottest in history.
1936 Heat Wave


Cool Link: Old Maps Search Engine


Old maps search engine

This link is a great resource to find old local maps for cities, counties and states from the US to around the world. For Columbus, maps go back to the 1920s, but other locations have even older versions. The maps are helpful for those doing research on this history of their cities.

Old Maps Online

Another favorite link is the Sanborn Fire Insurance Maps. These maps are even more detailed and you can view individual buildings down to the street level back to the 19th Century. These maps are available at the Library of Congress and require a bit more searching to find what you’re looking for.

Sanborn Maps

An 1891 Sanborn map of the Short North.


Before and After: Downtown Aerial Photos


Aerial photos have been around for more than a century, ever since someone thought to take photos from airplanes. These photos go back to at least the 1910s, when the airplane was still very much a new technology. I thought it might be interesting to do show a few of these before and after Downtown aerial photos to give an idea of how the same areas look today.

Before

before and after downtown aerial photos

Downtown around 1923.


This photo of Downtown was likely taken sometime between 1922 and 1923. The main clue is that the old Central High School is clearly under construction on the Scioto Peninsula, but seemingly in the early phases. The school would later open in the fall of 1924.
Also in the photo is the new Scioto River floodwall under construction just a decade after the Great Flood of 1913. The buildings near and along the riverfront would eventually be demolished for this project, as well as the eventual Civic Center project that would later build the Post Office and Ohio Supreme Court building. Notice as well the lack of Columbus’ signature building- LeVeque Tower. That project would be constructed over the next few years.
After
before and after downtown aerial photos

Downtown in 2019.


Downtown has obviously changed enormously in the past century. Skyscrapers now dominate Downtown, and the highway system now cuts through many neighborhoods. The riverfront itself is also significantly nicer and less industrial looking.
Before
before and after downtown aerial photos

Photo taken in 1929.


This 1929 photo looks west over Franklinton towards Downtown. The most revealing part of this photo is how compact the developed area of Columbus really was at the time. Farm fields can be seen to the south and west of Columbus.
After
before and after downtown aerial photos

Photo taken in 2019.


In the after photo, nearly all the vacant land is gone except for park space, Greenlawn Cemetery and areas along the rivers.

Before
before and after downtown aerial photos
This photo of Capitol Square in 1919 is one of the earliest aerials of Downtown I was able to find. This photo predates all highrise construction. The city was compact, dense and dominated by brick buildings.
After
before and after downtown aerial photos
In the 2019 image, skyscrapers have now replaced many of the older buildings. While the Capitol itself a handful of other buildings remain, the density has largely been lost over the years, with parking lots where many once stood.
Before
before and after downtown aerial photos
The 1919 image shows the intersection of High and Broad Streets, arguably the very center of Columbus.
After
before and after downtown aerial photos
Aside from the 8 on the Square building, virtually everything else from 1919 is long gone.

Before
before and after downtown aerial photos
This much more modern image of Downtown and the riverfront was taken in 1980.
After
before and after downtown aerial photos
The 2019 Google Earth image from the same angle shows significant changes in 40 years. New skyscrapers and other development are obvious, but the massive changes to the riverfront itself almost make this look like a different city altogether.

What might these areas look like in another century?

Thousands of additional before and after photo sequences can be found at the Historic Building Database
General information about Downtown can be found at https://www.experiencecolumbus.com/neighborhoods/downtown/


Housing Market Update April 2021


housing market update April 2021 Columbus, Ohio

The monthly housing market update April 2021 has been released from Columbus Realtors. The results continue ongoing trends of rising prices and low supply.

Note: LSD= Local School District, CSD= City School District. In both cases, school district boundaries differ from city boundaries.

Top 15 Most Expensive Locations By Median Sales Price in April 2021
1. New Albany: $677,500
2. German Village: $570,000
3. Bexley: $527,500
4. Dublin: $514,000
5. Powell: $500,000
6. Grandview Heights: $486,000
7. New Albany Plain LSD: $469,393
8. Upper Arlington CSD: $465,008
9. Olentangy LSD: $446,575
10. Dublin CSD: $437,000
11. Buckeye Valley LSD: $425,000
12. Jonathan Alder LSD: $422,000
13. Granville CSD: $410,000
14. Worthington: $409,250
15. Short North: $405,500

New Albany continued to top the charts, and remained more than $100K over second place.

Top 15 Least Expensive Locations by Median Sales Price in April 2021
1. Newark CSD: $140,000
2. Circleville CSD: $164,900
3. Whitehall: $165,000
4. Hamilton LSD: $195,250
5. Groveport Madison LSD: $196,000
6. Jefferson LSD: $198,000
7. Lancaster CSD: $200,000
8. London CSD: $207,500
9. Columbus CSD: $217,000
10. Obetz: $225,100
11. Columbus: $228,500
12. South-Western CSD: $230,000
13. Reynoldsburg CSD: $237,900
14. Canal Winchester CSD: $245,500
15. Minerva Park: $245,551

Columbus and some of its suburbs remained relative bargains in April.

Overall Market Median Sales Price in April 2021: $251,135
The overall market is defined by Columbus Metro Area counties.

Top 15 Locations with the Highest Median Sales Price % Growth Between April 2020 and April 2021
1. German Village: +67.2%
2. Jonathan Alder LSD: +42.1%
3. Worthington: +39.3%
4. Blacklick: +38.6%
5. Buckeye Valley LSD: +36.7%
6. Powell: +33.8%
7. Teays Valley LSD: +30.6%
8. Whitehall: +29.7%
9. Worthington CSD: 26.4%
10. London CSD: +25.8%
11. Olentangy LSD: 24.7%
12. Bexley: +24.1%
13. Westerville CSD: 22.9%
14. Jefferson LSD: +21.5%
15. South-Western CSD: +21.1%
16. Marysville CSD: +20.3%

Top 15 Locations with the Lowest Median Sales Price % Growth Between April 2020 and April 2021
1. Grandview Heights: -20.4%
2. New Albany Plain LSD: -10.3%
3. Canal Winchester CSD: -8.4%
4. Downtown: -8.0%
5. Johnstown-Monroe LSD: -6.8%
6. New Albany: -6.6%
7. Lithopolis: -6.3%
8. Newark CSD: -2.1%
9. Big Walnut LSD: +0.3
10. Circleville CSD: +0.6%
11. Granville CSD: +1.4%
12. Reynoldsburg CSD: +2.9%
13. Pataskala: +5.0%
14. Minerva Park: +5.8%
15. Gahanna Jefferson CSD: +6.4%

Urban areas generally improved significantly over earlier in the year. Downtown was still down, but by less than in previous months, so it seems the urban market is now well underway with a recovery.

Overall Market Median Sales Price % Change April 2021 vs. April 2020: +13.8%

Top 10 Locations with the Most New Listings in April 2021
1. Columbus: 1,328
2. Columbus CSD: 917
3. South-Western CSD: 197
4. Westerville CSD: 182
5. Olentangy LSD: 177
6. Hilliard CSD: 171
7. Dublin CSD: 153
8. Worthington CSD: 108
9. Pickerington LSD: 105
10. Grove City: 100

Columbus lead again, and had a few hundred more listings in April than it did in March. Listings overall were up in most places compared to a year ago, a small glimmer of good news.

Top 10 Locations with the Fewest New Listings in April 2021
1. Valleyview: 3
2. Lithopolis: 6
3. Obetz: 8
4. Jefferson LSD: 9
5. Sunbury: 9
6. Johnstown-Monroe LSD: 9
7. Jonathan Alder LSD: 10
8. Minerva Park: 11
9. Circleville CSD: 13
10. Grandview Heights: 14

Total New Listings in the Columbus Metro in April 2021: 3,250
Overall Metro New Listings % Change April 2021 vs April 2020: +41.1%


Top 10 Fastest-Selling Locations by # of Days Homes Remain on the Market Before Sale in April 2021
1. Lithopolis: 2
2. Minerva Park, Sunbury: 3
3. Big Walnut LSD, Jonathan Alder LSD: 4
4. Canal Winchester CSD, Jefferson LSD, Reynoldsburg CSD, Westerville, Worthington: 5
5. Groveport Madison LSD: 7
6. Beechwold/Clintonville, Delaware CSD, Hilliard CSD, Johnstown-Monroe LSD, Powell, Westerville CSD, Worthington CSD: 8
7. Hamilton LSD, South-Western CSD: 9
8. Hilliard, Pickerington LSD: 10
9. Obetz: 11
10. Bexley, Circleville CSD, Columbus: 12

Top 10 Slowest-Selling Locations by # of Days Homes Remain on the Market Before Sale in April 2021
1. Short North: 52
2. New Albany: 49
3. Granville CSD, New Albany Plain LSD: 39
4. German Village: 38
5. Grandview Heights: 28
6. Downtown: 27
7. Buckeye Valley LSD: 25
8. Lancaster CSD: 23
9. Marysville CSD, Olentangy LSD: 20
10. Upper Arlington CSD: 18

Top 10 Locations with the Greatest % Decline of # of Days on the Market Before Sale April 2021 vs March 2020
1. Lithopolis: -97.0%
2. Minerva Park: -94.6%
3. Big Walnut LSD: -93.7%
4. Johnstown-Monroe LSD: -92.3%
5. Canal Winchester CSD: -87.2%
6. Jonathan Alder LSD: -85.7%
7. Downtown: -81.0%
8. Delaware CSD: -80.0%
9. Hamilton LSD: -75.0%
10. Groveport Madison LSD: -73.1%

Top 10 Locations with the Lowest % Decline of # of Days on the Market Before Sale April 2021 vs March 2020
1. Short North: +73.3%
2. New Albany Plain LSD: +62.5%
3. New Albany: +44.1%
4. Jefferson LSD: +25.0%
5. Lancaster CSD: +4.5%
6. Upper Arlington CSD: 0.0%
7. Grove City: -7.1%
8. Buckeye Valley LSD: -16.7%
9. Gahanna: -18.8%
10. German Village: -24.0%

% Change for the # of Days Homes Remain on the Market Before Sale Across the Metro Overall:
-46.7%

The market heated up even more in April. Despite more homes on the market, houses were selling the fastest they have in any month year to date. The improvements in sales came across the metro area, including urban areas that had been lagging behind somewhat in previous months.


Winter 2020-2021 Review


Winter 2020-2021 Review Columbus, Ohio

The NOAA temperature outlook for winter 2020-2021.

The Winter 2020-2021 Review is the latest edition in the series. Overall, December and February brought some of the worst winter weather Columbus had seen in several years. Meanwhile, January and March were unusually quiet. Temperatures through January were fairly to slightly above average, while February was well below normal. March and April provided little winter weather, and March had no snowfall whatsoever.

Let’s break the winter down.

December-February Only
Average High: 37.8 42nd Coldest
Average Low: 25.1 34th Warmest
Mean: 31.4 42nd Warmest
Precipitation: 6.72″ 38th Driest
Snowfall: 24.7″ 31st Snowiest
Average Daily Snow Depth: 1.0″ 15th Highest
Largest Snowstorm: 5″ on 1/30-2/1/2021. This was a long-duration storm that moved only very slowly through the region.
# of 32 or Below Highs: 28 22nd Most
# of 32 or Below Lows: 79 10th Most
# of Measurable Precipitation Days: 38 14th Fewest
# of Measurable Snowfall Days: 23 14th Most

Overall, winter 2020-21 was somewhat average- not too cold, not too warm, not too wet, not too dry, not too snowy, but not snowless.

Entire Cold Season: October-April
Average High: 51.2 15th Warmest
Average Low: 33.6 22nd Warmest
Mean: 42.4 15th Warmest
Precipitation: 20.39″ 56th Wettest
Snowfall: 27.8″ 43rd Snowiest
Average Snow Depth: 0.4″ 5th Lowest
Largest Snowstorm: 5″ on 1/30-2/1/2021
# of 32 or Below Highs: 28 18th Fewest
# of 32 or Below Lows: 107 27th Most
# of Measurable Precipitation Days: 76 11th Fewest
# of Measurable Snowfall Days: 25 16th Fewest

The overall cold season was generally warm, but still managed to provide near normal to slight above normal snowfall for the region.

Average High By Month
October 2020: 63.3 31st Coldest
November 2020: 57.6 8th Warmest
December 2020: 41.5 38th Warmest
January 2021: 37.5 49th Warmest
February 2021: 33.9 20th Coldest
March 2021: 59.0 7th Warmest
April 2021: 64.4 29th Warmest

Average Low By Month
October 2020: 45.6 35th Warmest
November 2020: 37.3 18th Warmest
December 2020: 27.7 36th Warmest
January 2021: 26.6 22nd Warmest
February 2021: 20.4 35th Coldest
March 2021: 34.7 27th Warmest
April 2021: 42.0 35th Warmest

Mean By Month
October 2020: 54.5 38th Coldest
November 2020: 47.4 10th Warmest
December 2020: 34.6 36th Warmest
January 2021: 32.1 39th Warmest
February 2021: 27.2 30th Coldest
March 2021: 46.9 12th Warmest
April 2021: 53.2 28th Warmest

Precipitation By Month
October 2020: 4.19″ 16th Wettest
November 2020: 3.35″ 45th Wettest
December 2020: 2.24″ 44th Driest
January 2021: 2.25″ 50th Driest
February 2021: 2.23″ 64th Wettest
March 2021: 2.85″ 54th Driest
April 2021: 3.28″ 60th Wettest

Snowfall By Month
October 2020: 0.0″ Tied for Least Snowy
November 2020: 1.9″ 21st Least Snowy
December 2020: 8.5″ 22nd Snowy
January 2021: 4.1″ 29th Least Snowy
February 2021: 12.1″ 15th Snowiest
March 2021: 0.0″ Tied for Least Snowy
April 2021: 1.2″ 14th Least Snowy

March’s lack of snowfall tied the record for the only time in history the month did not even have a trace of snowfall.

Average Snow Depth By Month
October 2020: 0.0″
November 2020: 0.0″
December 2020: 0.7″
January 2021: 0.1″
February 2021: 2.4″
March 2021: 0.0″
April 2021: 0.0″


Maximum High By Month
October 2020: 80 on the 22nd
November 2020: 78 on the 8th and 10th
December 2020: 63 on the 11th
January 2021: 51 on the 1st
February 2021: 60 on the 28th
March 2021: 75 on March 24th
April 2021: 83 on April 27th

Maximum High Records
-78 on November 8th was a record high for the date, beating the old record of 74 set in 1945.
-76 on November 9th tied the daily record high with 1975.
-78 on November 10th was a record high for the date, beating the old record of 72 set in 1949.

Minimum High By Month
October 2020: 48 on the 30th
November 2020: 43 on the 18th
December 2020: 18 on the 25th
January 2021: 25 on the 28th
February 2021: 23 on the 7th and 16th
March 2021: 40 on the 15th
April 2021: 37 o the 1st

Maximum Low By Month
October 2020: 62 on the 11th
November 2020: 55 on the 10th
December 2020: 43 on the 12th
January 2021: 37 on the 2nd
February 2021: 43 on the 28th
March 2021: 56 on the 11th
April 2021: 65 on the 28th

Maximum Low Records
-The 65 on April 28th tied the record set in 1914.

Minimum Low By Month
October 2020: 30 on the 31st
November 2020: 25 on the 18th
December 2020: 13 on the 26th and 27th
January 2021: 16 on the 23rd
February 2021: 5 on the 17th
March 2021: 19 on the 5th
April 2021: 21 on the 2nd

Highest Daily Precipitation By Month
October 2020: 1.25″ on the 29th
November 2020: 0.89″ on the 25th
December 2020: 0.74″ on the 30th
January 2021: 1.04″ on the 1st
February 2021: 0.76″ on the 28th
March 2021: 1.12″ on the 18th
April 2021: 1.88″ on the 29th

Precipitation Records
-0.76″ on February 28th was the record for the date, beating the old record of 0.56″ set in 1954.
-The 1.88″ on April 29th was a record for the date, beating the old record of 1.82″ set in 1996.

Highest Daily Snowfall By Month
October 2020: 0.0″
November 2020: 1.9″ on the 30th
December 2020: 3.4″ on the 24th
January 2021: 2.3″ on the 31st
February 2021: 2.3″ on the 1st
March 2021: 0.0″
April 2021: 1.2″ on the 21st

Snowfall Records
-2.8″ on December 16th was a record for the date, beating the old record of 1.8″ set in 1953.
-3.4″ on December 24th was a record for the date, beating the old record of 2.7″ set in 1980.

Deepest Snow Depth By Month
October 2020: 0″
November 2020: 0″
December2020: 4″ on the 26th
January 2021: 3″ on the 31st
February 2021: 5″ on the 18th-21st
March 2021: 0.0″
April 2021: 1″ on the 21st

Winter 2020-2021 Daily Graphs


For more winter records and local weather information, visit the following links.
Winter Season Records
Wilmington National Weather Service

Other Recent Winter Season Reviews
Winter 2019-2020
Winter 2018-2019
Winter 2017-2018