Random Columbus Photos 8

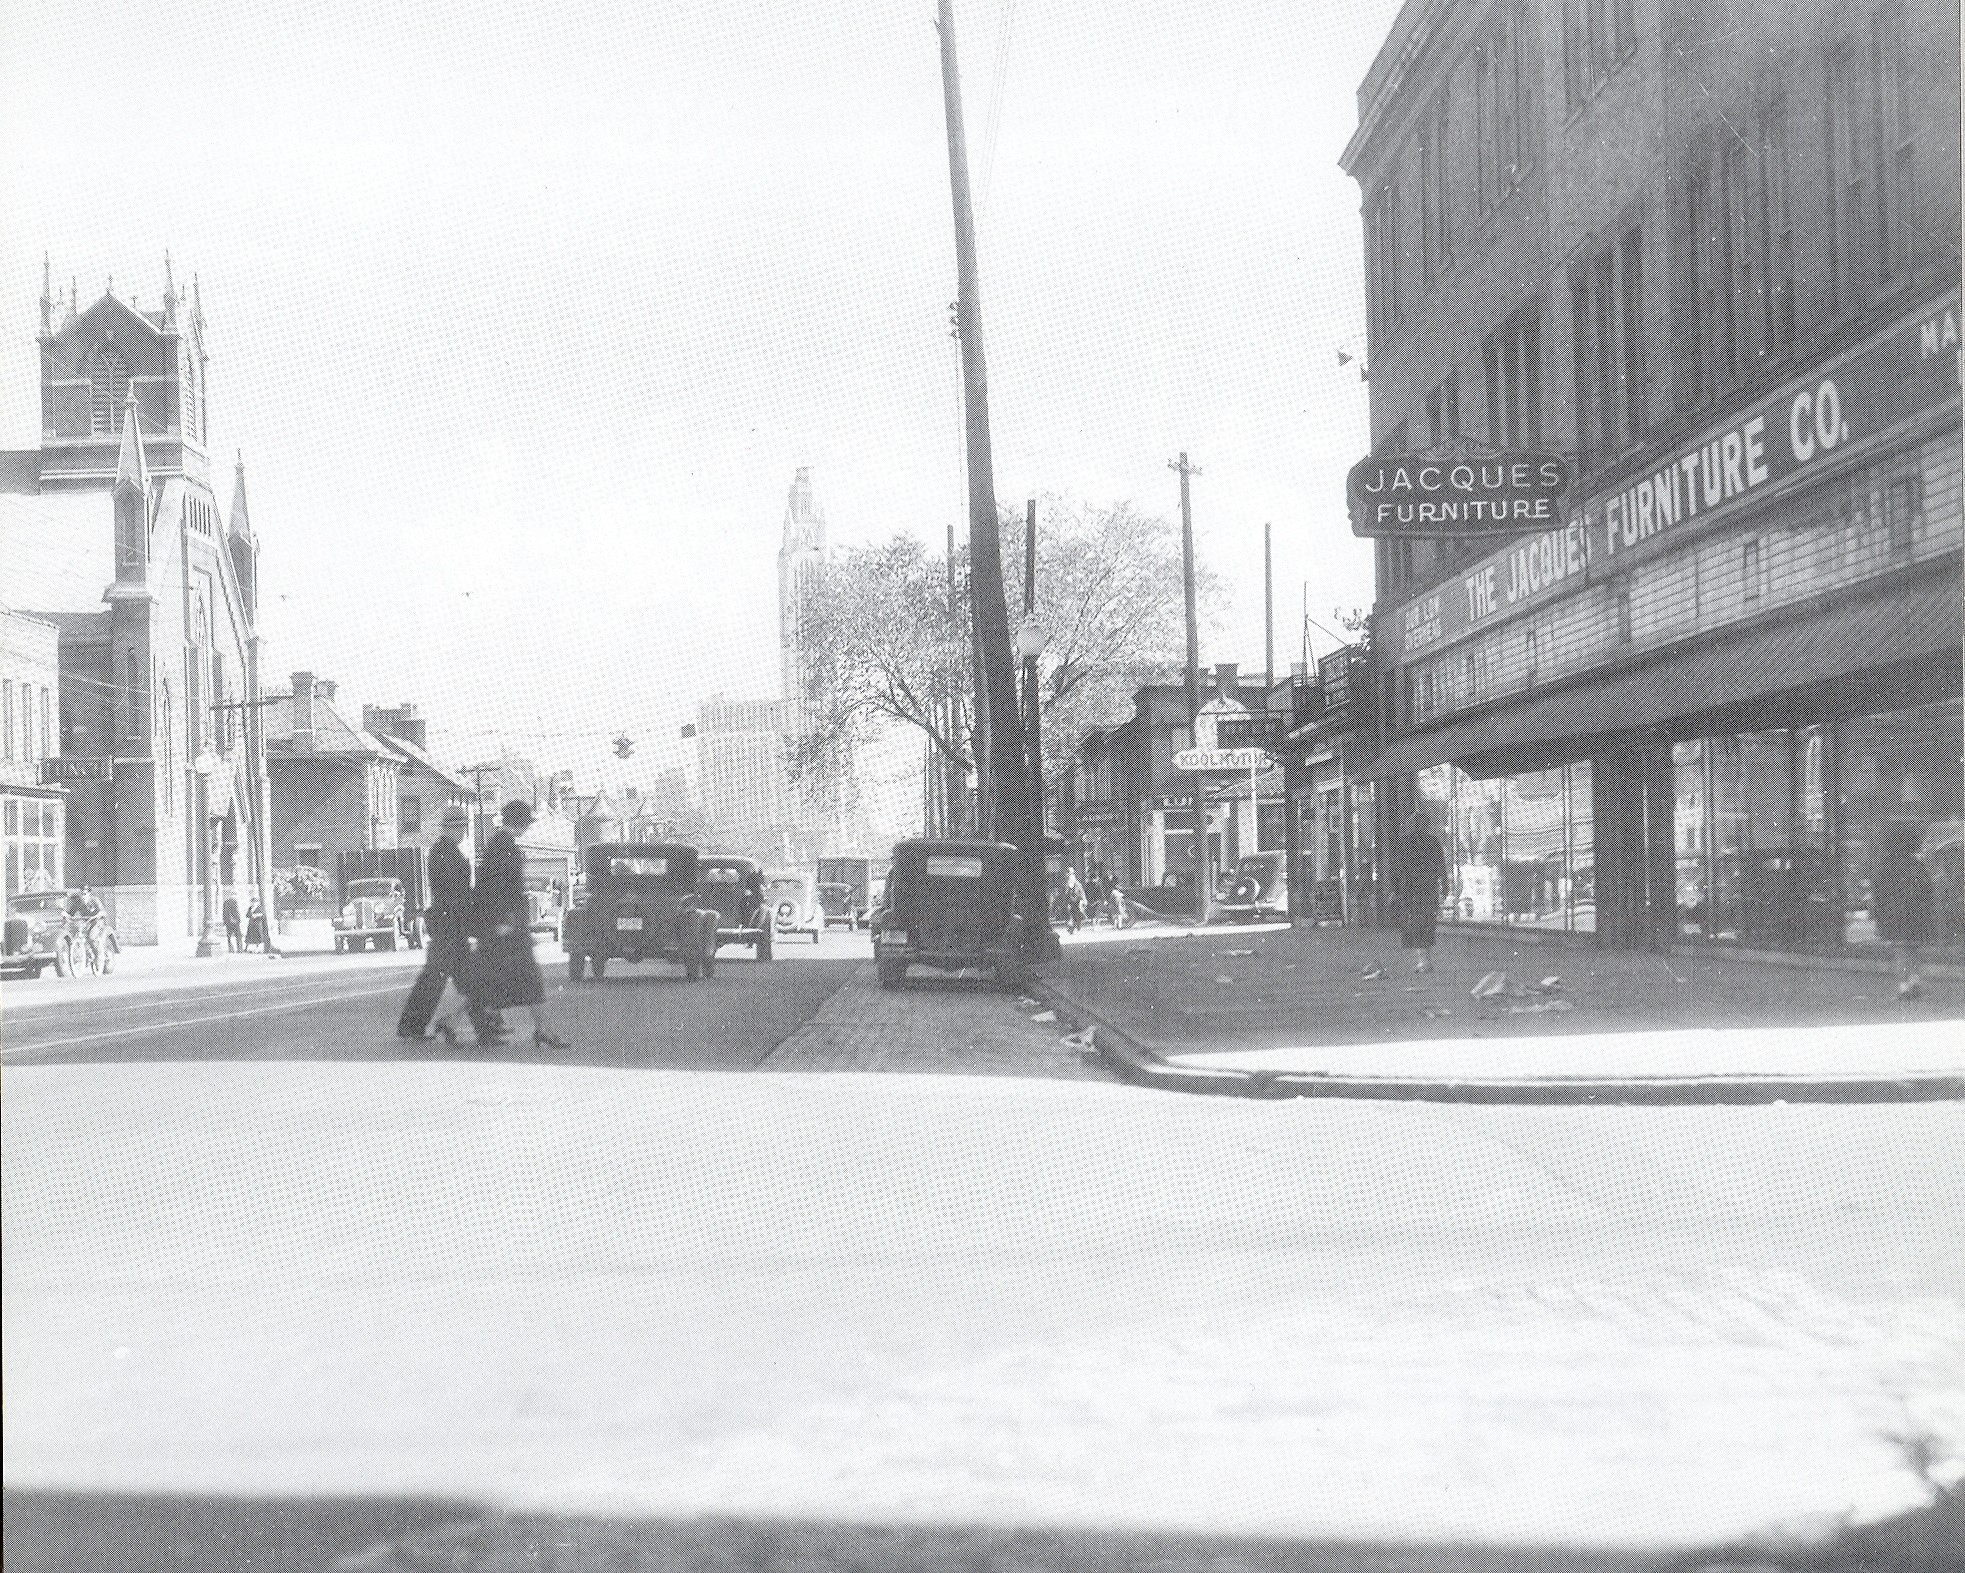
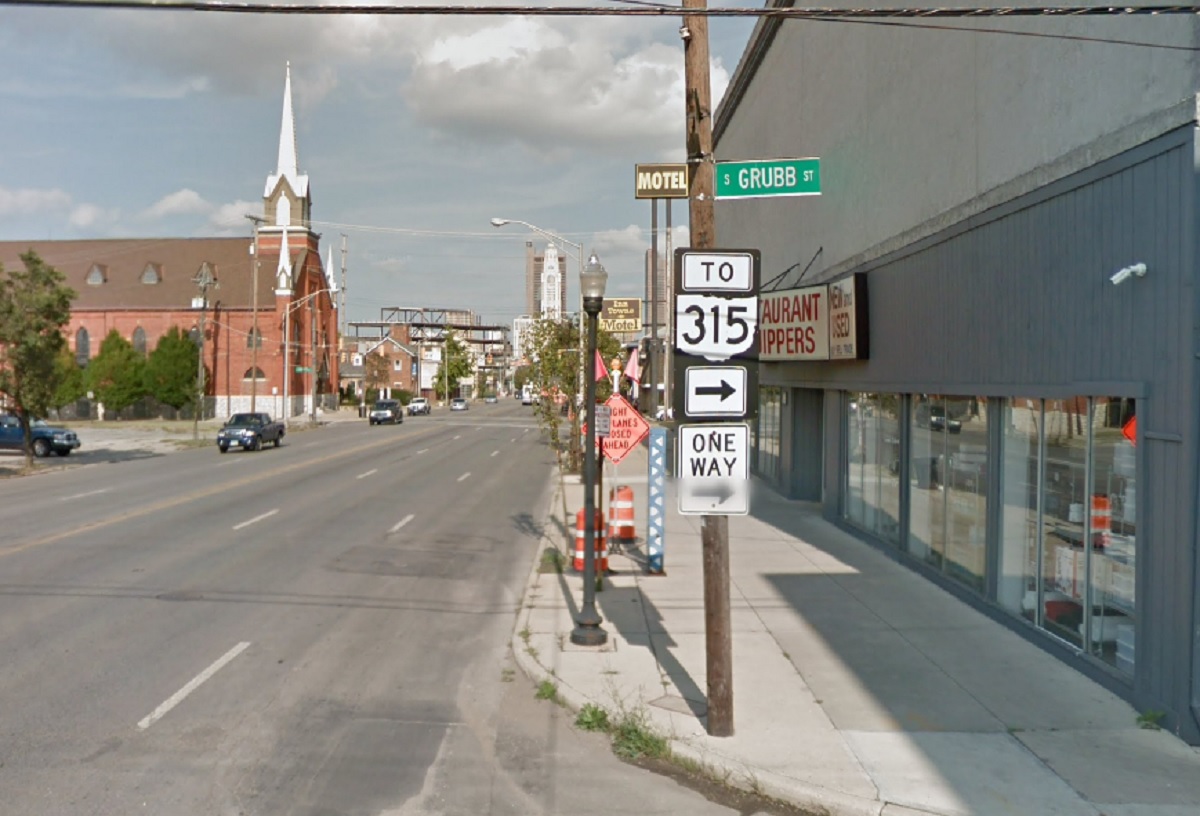
Photo Location: West Broad Street at Grubb Street, looking east.
Photo Date: 1937
Photo History: Franklinton was bustling in this pre-WWII era-photo of Broad Street. It had been 24 years since the Great Flood, and the neighborhood was reaching for its historic population high along with the rest of the urban core. Unfortunately, within 2 decades, the neighborhood would be devastated by yet another flood and would be followed by 50 years of stagnation and decline.
Random Columbus Photos #8 Columbus Ohio

The same view now.


Independence Day Climatology


Independence Day climatology is available going back to 1878. Here’s a breakdown through 2021.

July 4th Normals 1878-2021
High: 84.4
Low: 64
Mean: 74
Precipitation: 0.12″

July 4th Normals 1991-2020
High: 85
Low: 65
Mean: 75
Precipitation: 0.15″


Top 10 Coldest July 4th Highs
1. 1882, 1922: 69
2. 1924, 1967, 1978, 2008: 71
3. 1909, 1927, 1972, 1979, 2016: 72
4. 1920: 73
5. 1937, 1989: 74
6. 1892, 1910, 1940, 1941, 1960, 1997, 2009: 76
7. 1917, 1964, 1968, 1970, 1976, 2013: 77
8. 1891, 1961, 2014: 78
9. 1889, 1933, 1996, 2001, 2015: 79
10. 1898, 1906, 1926, 1938, 1962, 1992; 80
Independence Day climatology average high

Top 10 Warmest July 4th Highs
1. 1911: 104
2. 1897: 102
3. 2012: 100
4. 1919: 97
5. 1900, 1921, 1949, 2002: 96
6. 1990, 1999: 95
7. 1903, 1948, 2020: 94
8. 1881, 1883, 1899, 1918, 1958, 1988, 2018: 93
9. 1913, 1993, 2003: 92
10. 1880, 1901, 1902, 1931, 1944, 1974, 2010: 91

Independence day climatology high temperature days of occurrence

Top 10 Coldest July 4th Lows
1. 1968: 47
2. 1963: 49
3. 1996: 50
4. 1986: 51
5. 1927, 1940: 52
6. 1960, 1961, 1965, 1972: 53
7. 1892, 1909, 1924, 1930, 1979: 54
8. 1895, 1907: 55
9. 1891, 1915, 1922, 1976, 1992: 56
10. 1953, 1964, 1967, 1988, 2014: 57
Independence day climatology average low

Top 10 Warmest July 4th Lows
1. 1911: 79
2. 1897, 1900, 1999: 75
3. 1879, 1921: 74
4. 1883, 1902, 2012, 2018: 73
5. 1899, 1919, 1991, 2002, 2004; 72
6. 1884, 1903, 1913, 1943, 1974, 2005, 2013: 71
7. 1888, 1896, 1901, 1980, 2003, 2011: 70
8. 1878, 1905, 1908, 1935, 1949, 1957, 1966, 1983, 1987, 2000, 2006: 69
9. 1881, 1887, 1894, 1936, 1954, 1973, 1984, 1989, 1990, 1993, 1995, 2020: 68
10. 1912, 1928, 1934, 1939, 1952, 1956, 1969, 1975, 1998, 2017: 67

Independence day climatology low temperature by occurrence

Top 10 Coldest July 4th Means
1. 1927, 1968: 62.0
2. 1922, 1924, 1972: 62.5
3. 1909, 1979: 63.0
4. 1882: 63.5
5. 1940, 1967: 64.0
6. 1960, 1996: 64.5
7. 1892, 1963: 65.0
8. 1961: 65.5
9. 1920: 66.0
10. 1976, 1986, 2008: 66.5
Independence day climatology average mean

Top 10 Warmest July 4th Means
1. 1911: 91.5
2. 1897: 88.5
3. 2012: 86.5
4. 1900: 85.5
5. 1921, 1999: 85.0
6. 1919: 84.5
7. 2002: 84.0
8. 1883, 2018: 83.0
9. 1899, 1903, 1949: 82.5
10. 1902: 82.0

Top 10 Wettest July 4ths
1. 1984: 1.38″
2. 1935: 1.04″
3. 1915: 0.86″
4. 1932: 0.84″
5. 1957: 0.66″
6. 2008: 0.61″
7. 1939: 0.60″
8. 2003: 0.59″
9. 1926: 0.58″
10. 2006: 0.56″
Independence day climatology average precipitation

Independence day climatology precipitation occurrence

The July Weather Records provides additional detailed information on the rest of the month.


Homicide Rates by City


Homicide rates by city

In the second part of this series, we will look at homicide rates by city and state. Out of all violent crimes, it is arguably what gets the most media and public attention, and causes the most general fear. See overall violent crime rates in part 1.

Homicide Rate Per 100K People By Year
2000————————————2010———————————-2020
1. New Orleans: 42.1———–1. New Orleans: 50.9———–1. St. Louis: 87.2
2. Washington DC: 41.8——-2. St. Louis: 45.1—————–2. New Orleans: 52.3
3. Detroit: 41.6——————-3. Detroit: 43.4——————–3. Detroit: 51.3
4. Baltimore: 40.1—————4. Baltimore: 35.9—————–4. Baltimore: 51.0
5. St. Louis: 35.6—————-5. Newark: 32.5——————-5. Memphis: 45.6
6. Atlanta: 32.2——————-6. Oakland: 23.0—————–6. Cleveland: 42.9
7. Kansas City: 25.6————7. Cincinnati: 22.9—————7. Kansas City: 34.6
8. Memphis: 22.6—————-8. Kansas City: 22.2————8. Milwaukee: 33.1
9. Chicago: 21.8—————–9. Atlanta: 22.1——————9. Cincinnati: 29.7
10. Newark, NJ: 21.2———-10. Washington DC: 21.9—–10. Washington DC: 28.7
11. Philadelphia: 21.0———-11. Buffalo: 21.0—————-11. Indianapolis: 24.3
12. Milwaukee: 20.4————12. Cleveland: 20.4————12. Louisville: 23.7
13. Oakland: 20.0—————13. Philadelphia: 20.1———13. Oakland: 23.1
14. Dallas: 19.4——————14. Las Vegas: 18.3———–14. Buffalo: 21.9
15. Las Vegas: 18.8————-15. Pittsburgh: 18.0————15. Greensboro: 19.7
16. Miami: 18.2——————-16. Miami: 17.0—————–16. Toledo: 19.6
17. Durham, NC: 15.0———-17. Stockton: 16.8————–17. Columbus: 19.2
18. Los Angeles: 14.9———–18. Chicago: 16.0————–18. Minneapolis: 18.4
19. Cleveland: 14.8————–19. Milwaukee: 16.0———–19. Chicago: 18.1
20. Charlotte: 13.9—————20. Memphis: 13.8————-20. Dallas: 18.1
21. Buffalo: 13.3——————21. Tulsa: 13.8——————21. Newark: 18.0
22. Nashville: 13.2—————22. Houston: 12.8————–22. Stockton: 17.5
23. Minneapolis: 13.1———–23. Dallas: 12.4—————–23. Houston: 17.4
24. Tampa: 12.5——————24. Columbus: 12.1————24. Tulsa: 17.4
25. Indianapolis: 12.3———–25. Boston: 11.8—————-25. Nashville: 16.4
26. Stockton, CA: 12.3———26. Indianapolis: 11.2———-26. Las Vegas: 15.0
27. Tucson: 12.3—————–27. Jersey City: 10.5———-27. Fort Wayne: 14.8
28. Houston: 11.8—————28. Durham: 10.1—————28. Jacksonville: 14.7
29. Phoenix: 11.5—————29. Tucson: 9.8—————–29. Albuquerque: 14.2
30. Fort Worth: 11.4————30. Jacksonville: 9.7———-30. Fresno: 14.2
31. Orlando: 11.3—————31. Minneapolis: 9.7———–31. Miami: 13.8
32. Pittsburgh: 11.1————-32. Bakersfield: 9.5———–32. Charlotte: 13.6
33. Jacksonville, FL: 10.7—–33. Oklahoma City: 9.3——33. Denver: 13.6
34. Long Beach, CA: 10.6—-34. Fort Wayne: 9.1———–34. Durham: 12.7
35. Fort Wayne, IN: 9.7——–35. Fresno: 9.1—————-35. Philadelphia: 12.5
36. Sacramento: 9.6———–36. Nashville: 9.1————–36. Fort Worth: 12.0
37. Omaha: 9.5——————37. Louisville: 8.7————-37. Atlanta: 11.8
38. Columbus: 9.4————–38. Santa Ana: 8.6———–38. Phoenix: 11.6
39. Greensboro, NC: 9.4——39. Fort Worth: 8.5———-39. Wichita: 11.3
40. Raleigh: 9.4——————40. Charlotte: 8.3———–40. Tucson: 11.2
41. Bakersfield, CA: 9.3——-41. Omaha: 8.3————–41. Bakersfield: 10.9
42. Wichita: 9.0——————42. Phoenix: 8.0————-42. Lubbock: 10.9
43. N. Las Vegas: 8.7———-43. Tampa: 8.0————–43. Corpus Christi: 10.7
44. New York: 8.4—————44. Toledo: 8.0————–44. Tampa: 10.7
45. Tulsa: 8.4———————45. Albuquerque: 7.7——45. Aurora: 10.1
46. Aurora, CO: 8.0————-46. Los Angeles: 7.7——46. Orlando: 10.1
47. San Francisco: 7.6———47. Orlando: 7.6————47. St. Paul: 9.6
48. Oklahoma City: 7.5———48. Aurora: 7.4————-48. Oklahoma City: 9.3
49. Albuquerque: 7.4————49. Greensboro: 7.4——49. San Antonio: 9.1
50. San Antonio: 7.4————50. Sacramento: 7.1——50. Los Angeles: 9.0
51. Jersey City: 7.1————-51. Long Beach: 6.9——-51. Lexington: 8.7
52. St. Paul: 7.0—————–52. N. Las Vegas: 6.9——52. Boston: 8.6
53. Riverside, CA: 6.7———53. New York: 6.6———–53. Pittsburgh: 8.6
54. Boston: 6.6——————54. Lexington: 6.1———–54. Portland: 8.1
55. Cincinnati: 6.6————–55. San Antonio: 6.0——–55. Sacramento: 8.0
56. Seattle: 6.4——————56. San Francisco: 6.0—–56. Long Beach: 7.7
57. Corpus Christi: 6.1——–57. St. Paul: 5.6————–57. Omaha: 7.6
58. Lubbock, TX: 6.0———-58. Honolulu: 5.6————-58. Colorado Springs: 7.5
59. Denver: 5.8—————–59. St. Petersburg: 5.3——59. Seattle: 7.1
60. Laredo, TX: 5.7————60. Corpus Christi: 5.2——60. N. Las Vegas: 6.9
61. Fresno, CA: 5.6————61. Austin: 4.8—————–61. Reno: 6.4
62. St. Petersburg: 5.6——–62. Colorado Springs: 4.8–62. Honolulu: 6.3
63. Honolulu: 5.4—————63. Denver: 4.7—————63. Riverside: 6.3
64. Irving, TX: 5.2————–64. Anchorage: 4.5———-64. Anchorage: 6.2
65. Santa Ana, CA: 5.0——-65. Arlington: 4.4————65. Arlington: 5.8
66. Austin: 4.9——————-66. Lubbock: 4.4————66. Jersey City: 5.8
67. Henderson, NV: 4.6——67. Wichita: 4.2————–67. St. Petersburg: 5.8
68. Reno: 4.6——————-68. Laredo: 3.8————–68. San Francisco: 5.5
69. San Diego: 4.4————69. Portland: 3.8————69. New York: 5.3
70. Arlington, TX: 4.2———70. Reno: 3.8—————-70. Santa Ana: 4.8
71. Colorado Springs: 4.2—71. Raleigh: 3.5————-71. Anaheim: 4.6
72. Lexington, KY: 4.2——-72. Mesa: 3.4—————-72. Austin: 4.6
73. Anchorage: 3.8———–73. Virginia Beach: 3.2—-73. Laredo: 4.6
74. Mesa, AZ: 3.8————-74. Henderson: 3.1——–74. Raleigh: 4.5
75. Toledo: 3.8—————-75. Seattle: 3.1————–75. El Paso: 4.1
76. Portland: 3.6————–76. Riverside: 3.0———-76. Henderson: 4.1
77. El Paso: 3.5—————77. Irving: 2.8—————77. San Diego: 4.0
78. Anaheim: 3.4————–78. Chandler: 2.5———-78. San Jose: 3.9
79. Virginia Beach: 2.6——79. Gilbert: 2.4————–79. Mesa: 3.8
80. Chandler, AZ: 2.3——–80. San Diego: 2.2———80. Madison: 3.7
81. Plano, TX: 2.3————-81. Anaheim: 2.1———–81. Virginia Beach: 3.7
82. San Jose: 2.1————–82. San Jose: 2.1———-82. Chula Vista: 3.6
83. Chula Vista, CA: 1.7—–83. Plano: 1.5—————-83. Irving: 3.5
84. Madison: 1.4—————84. Madison: 0.9————84. Chandler:3.3
85. Lincoln: 1.3—————–85. Chula Vista: 0.8——–85. Lincoln: 1.7
86. Irvine, CA: 0.7————-86. El Paso: 0.8————-86. Gilbert: 1.5
87. Gilbert, AZ: 0.0————-87. Lincoln: 0.8————-87. Plano: 1.1
88. Louisville: N/A————–88. Irvine: 0.0—————88. Irvine: 0.3

Most cities saw their numbers and rates increase by 2020, which is curious given that overall violent crimes decreased in many cities.  In Columbus, homicides rose to near record levels in 2020, but overall violent crimes steadily dropped 2000-2020.  Across the nation, the causes of this could be varied, but it seems the most common factor may be gun proliferation via the relaxation of regulations.  For example, mass shooting incidents across the US have exploded since the mid-2000s, which coincides with the allowed expiration of the Federal Assault Weapons Ban, which existed from 1994 to September, 2004.


State Homicide Rate Per 100K People By Year
2000———————————2010—————————2020
1. Louisiana: 12.5————-1. Louisiana: 11.0————1. Louisiana: 15.8
2. Mississippi: 9.0————-2. Maryland: 7.4————–2. Missouri: 11.8
3. Maryland: 8.1—————3. Missouri: 7.0—————3. Arkansas: 10.6
4. Georgia: 8.0—————–4. Mississippi: 6.9————4. Mississippi: 10.6
5. Alabama: 7.4—————-5. New Mexico: 6.8———-5. South Carolina: 10.5
6. New Mexico: 7.4———–6. Arizona: 6.4—————–6. Alabama: 9.6
7. South Carolina: 7.3——-7. Michigan: 5.9—————7. Tennessee: 9.6
8. Illinois: 7.2——————-8. Nevada: 5.8—————-8. Illinois: 9.1
9. Tennessee: 7.2————-9. Alabama: 5.7————–9. Maryland: 9.1
10. Arizona: 7.0————–10. Delaware: 5.7————10. Georgia: 8.8
11. North Carolina: 7.0—–11. Georgia: 5.7—————11. North Carolina: 8.0
12. Michigan: 6.7————12. South Carolina: 5.7——12. Pennsylvania: 7.9
13. Nevada: 6.5————–13. Tennessee: 5.6———–13. New Mexico: 7.8
14. Arkansas: 6.3————14. Illinois: 5.5—————–14. Michigan: 7.6
15. Kansas: 6.3————–15. Florida: 5.2—————–15. Indiana: 7.5
16. Missouri: 6.2————-16. Oklahoma: 5.2————-16. Delaware: 7.4
17. California: 6.1————17. Pennsylvania: 5.1———17. Oklahoma: 7.4
18. Texas: 5.9—————–18. North Carolina: 5.0——-18. Kentucky: 7.2
19. Indiana: 5.8—————19. Texas: 4.9——————19. Ohio: 7.0
20. Virginia: 5.7—————20. California: 4.8————-20. Arizona: 6.9
21. Florida: 5.6—————-21. Virginia: 4.7—————-21. Alaska: 6.7
22. Oklahoma: 5.3————22. Arkansas: 4.6————-22. Texas: 6.6
23. New York: 5.0————-23. New York: 4.5————23. West Virginia: 6.6
24. Pennsylvania: 4.9——–24. Alaska: 4.3—————-24. Virginia: 6.1
25. Kentucky: 4.8————-25. Kentucky: 4.3————-25.  Florida: 5.9
26. Alaska: 4.3—————-26. New Jersey: 4.2———-26. Nevada: 5.7
27. Rhode Island: 4.3——-27. Ohio: 4.2——————-27. California: 5.6
28. Nebraska: 3.7————28. Indiana: 4.1—————-28. Wisconsin: 5.3
29. Ohio: 3.7——————29. Connecticut: 3.7———-29. Colorado: 5.1
30. New Jersey: 3.4———30. Kansas: 3.4—————-30. Montana: 5.0
31. Washington: 3.3———31. Massachusetts: 3.3——31. South Dakota: 4.5
32. Delaware: 3.2————32. West Virginia: 3.1——–32. New York: 4.2
33. Wisconsin: 3.2———–33. Nebraska: 3.0————-33. North Dakota: 4.2
34. Colorado: 3.1————34. Rhode Island: 2.8———34. Connecticut: 3.9
35. Minnesota: 3.1———–35. South Dakota: 2.8——–35. Washington: 3.9
36. Connecticut: 2.9———36. Wisconsin: 2.7————-36. New Jersey: 3.7
37. Hawaii: 2.9—————37. Colorado: 2.6—————37. Nebraska: 3.6
38. West Virginia: 2.5——-38. Montana: 2.5—————38. Iowa: 3.5
39. Wyoming: 2.4————39. Oregon: 2.5—————–39. Kansas: 3.4
40. Montana: 2.2————-40. Washington: 2.3————40. Minnesota: 3.4
41. Massachusetts: 2.0—–41. Utah: 1.9———————41. Utah: 3.1
42. Oregon: 2.0—————42. Hawaii: 1.8——————42. Wyoming: 3.1
43. Utah: 1.9——————-43. Maine: 1.8——————-43. Rhode Island: 3.0
44. New Hampshire: 1.8—–44. Minnesota: 1.8————44. Hawaii: 2.9
45. Iowa: 1.6——————–45. North Dakota: 1.5——–45. Oregon: 2.9
46. Vermont: 1.5—————46. Idaho: 1.4——————-46. Massachusetts: 2.3
47. Idaho: 1.2——————-47. Wyoming: 1.4————-47. Idaho: 2.2
48. Maine: 1.2——————48. Iowa: 1.2——————–48. Vermont: 2.2
49. South Dakota: 0.9——–49. Vermont: 1.1—————49. Maine: 1.6
50. North Dakota: 0.6———50. New Hampshire: 1.0—-50. New Hampshire: 0.9

The Southeast states all appear in the top 25 worst, including 8 of the top 10. Most states saw declines 2000-2010, followed by increases 2010-2020.


Columbus Economy May 2022


Columbus Economy May 2022

Now hiring sign

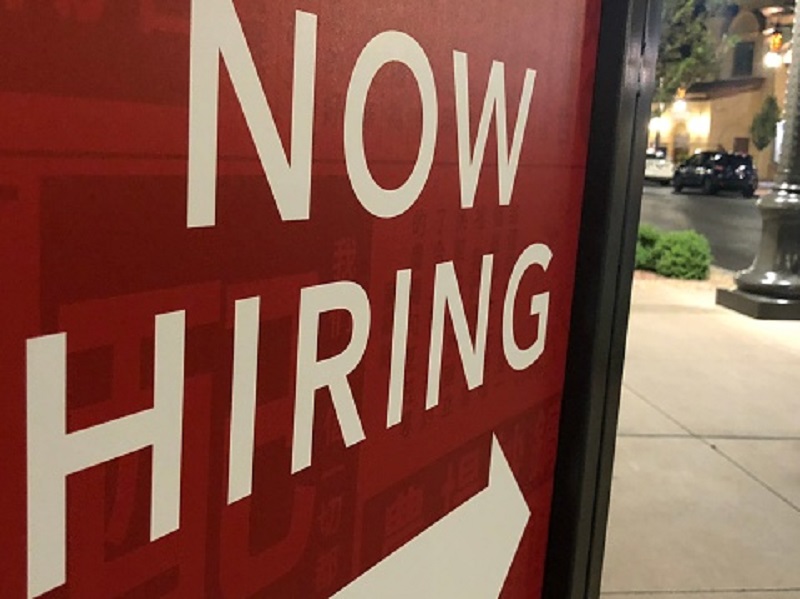
For the Columbus economy May 2022 report, we will look for any signs that the local economy is being negatively affected by ongoing inflation and higher energy prices.

Overall Metro Area May 2022 and Change from May 2021
Labor Force: 1,132,871 +24,699
Employed: 1,100,438 +43,723
Unemployed: 32,433 -19,024
Unemployment Rate: 2.9% -1.7
Total Non-Farm Jobs: 1,123,200 +28,300

The 2.9% May unemployment rate for the Columbus metro remains one of the lowest in more than 30 years, and all metrics were better than they were a year ago.

Overall Metro Area May 2022 and Change from February 2020 (Pre-Pandemic)
Labor Force: 1,132,871 +12,067
Employed: 1,100,438 +23,598
Unemployed: 32,433 -11,531
Unemployment Rate: 2.9% -1.0
Total Non-Farm Jobs: 1,123,200 +11,800
The metro area has surpassed pre-pandemic data across the board.

Now let’s view the results by industry.

Mining/Logging/Construction
5/2020———–5/2021———-5/2022

43,200————45,700———47,500
This industry has fully recovered from the pandemic and continues to set new highs.

Manufacturing
5/2020———–5/2021———-5/2022

66,700———–71,900———-72,300
Although manufacturing has largely recovered from pandemic lows, it remains *well* below anytime before 2000.

Trade/Transportation/Utilities
5/2020———–5/2021———-5/2022

205,400———-221,000———238,000
This industry is at 30 year highs.

Information
5/2020———–5/2021———-5/2022

15,500———–15,600———-16,600
The industry has been in somewhat of a decline overall since the Dot.com boom of the late 1990s. It recovered most pandemic losses, but seems unlikely to do much better in the long run.

Financial Activities
5/2020———–5/2021———-5/2022

83,900———–84,500———-83,700
Financial activities jobs have declined slightly since recovering its pandemic losses.

Professional and Business Services
5/2020———–5/2021———-5/2022
166,500———-179,600———178,200
As with the financial activities industry, this industry initially recovered from the pandemic, but has stagnated a bit since then.

Education and Health Services
5/2020———–5/2021———-5/2022

145,600———-159,700———158,800
These industries have been somewhat stagnant as well since around October, 2020.

Leisure and Hospitality
5/2020———–5/2021———-5/2022
69,000———-97,200———-107,600
This industry was arguably hit the hardest of any during the pandemic crash, but have recovered fairly strongly since then. However, because the fall was so great, it has not completely come back to date.

Other Services
5/2020———–5/2021———-5/2022

32,800———–39,800———-41,500
This industry is on track for full recovery by late summer.

Government
5/2020———–5/2021———-5/2022

177,500———-179,900———179,000
Government jobs remain below where they were pre-pandemic, and have shown little movement either way.

Overall, the metro has recovered from the pandemic and most metrics are generally positive, but not all industries are doing equally well. There remains no sign of any impending downturn.

The Bureau of Labor Statistics, the source of this data, is useful for local employment data for any metro area in the United States.

Housing Market Update May 2022


Local housing market update May 2022 Columbus, Ohio

In this latest edition of the Housing Market Update May 2022, we see that home prices continue to reach record levels in the metro area, and houses are selling faster than ever. With rising mortgage interest rates, will the region eventually see a slowdown?

Note: LSD= Local School District, CSD= City School District. In both cases, school district boundaries differ from city boundaries.

Top 15 Most Expensive Locations By Median Sales Price in May 2022
1. New Albany: $789,900
2. New Albany Plain LSD: $650,000
3. Big Walnut LSD: $572,127
4. Powell: $565,000
5. Upper Arlington CSD: $558,000
6. Dublin: $555,000
7. Grandview Heights: $545,000
8. Granville CSD: $530,000
9. Dublin CSD: $515,000
10. Olentangy LSD: $505,000
11. Buckeye Valley LSD: $495,000
12. Worthington: $481,000
13. German Village: $475,000
14. Bexley: $470,000
15. Pickerington: $444,000
16. Canal Winchester CSD: $430,000
Several suburbs now have median prices at or above half a million dollars, with several others not too far behind.

Top 15 Least Expensive Locations by Median Sales Price in May 2022
1. Lancaster CSD: $175,000
2. Miami Trace LSD: $180,000
3. Newark CSD: $184,000
4. Circleville CSD: $187,500
5. Whitehall CSD: $205,000
6. Jefferson LSD: $220,000
7. London CSD: $227,450
8. Groveport Madison LSD: $243,000
9. Hamilton LSD: $256,700
10. Obetz: $256,700
11. Columbus CSD: $257,500
12. Columbus: $277,750
13. Reynoldsburg CSD: $280,500
14. Minerva Park: $291,500
15. South Western CSD: $295,450
On the opposite side of things, even some of the cheapest markets are approaching the $300K mark. Columbus itself remains *relatively* affordable in comparison to the market overall.

Overall Market Median Sales Price in May: $303,460
Based on the 10 Columbus Metro Area counties.

Top 15 Locations with the Highest Median Sales Price % Growth Between May 2021 and May 2022
1. Canal Winchester CSD: +65.4%
2. Big Walnut LSD: +50.4%
3. Whitehall: +48.6%
4. Northridge LSD: +42.6%
5. Groveport Madison LSD: +39.0%
6. Grandview Heights: +38.3%
7. Granville CSD: +31.7%
8. Gahanna: +27.6%
9. Teays Valley LSD: +26.4%
10. Pataskala: +26.3%
11. Pickerington: +25.1%
12. Downtown: +24.3%
13. Johnstown-Monroe LSD: +23.5%
14. Powell: +22.8%
15. Sunbury: +22.5%

Top 15 Locations with the Lowest Median Sales Price % Growth Between May 2021 and May 2022
1. German Village: -24.6%
2. Miami Trace LSD: -19.3%
3. Obetz: -14.0%
4. Bexley: -5.5%
5. Delaware CSD: -4.7%
6. New Albany: -2.5%
7. Minerva Park: -2.2%
8. Lancaster CSD: -0.6%
9. Newark CSD: -0.1%
10. Jonathan Alder LSD: 0.0%
11. Short North: 0.5%
12. London CSD: +1.1%
13. Westerville: +2.4%
14. Circleville CSD: +3.0%
15. Beechwold/Clintonville: +3.5%
So far, the “Intel Effect” has yet to kick in in places like Newark and some Northeast Side communities. Only Johnstown is seeing a significant price increase. This may have to do with some of these places already being overvalued, especially New Albany.

Overall Market Median Sales Price % Change May 2022 vs. May 2021: +14.5%
Based on 53 metro market locations.

Top 10 Locations with the Most New Listings in May 2022
1. Columbus: 1,337
2. Columbus CSD: 898
3. Olentangy LSD: 214
4. South Western CSD: 210
5. Hilliard CSD: 162
6. Dublin CSD: 146
7. Westerville CSD: 139
8. Worthington CSD: 94
9. Dublin: 90
10. Lancaster CSD: 88

Top 10 Locations with the Fewest New Listings in May 2022
1. Valleyview: 0
2. Lithopolis: 2
3. Minerva Park: 5
4. Obetz: 6
5. Jefferson LSD: 12
6. Northridge LSD: 14
7. Johnstown-Monroe LSD: 15
8. Miami Trace LSD: 18
9. Sunbury: 20
10. Granville CSD: 20
11. German Village: 21

Total New Listings in the Columbus Metro in May 2022: +3,362
Overall Metro New Listings % Change May 2022 vs May 2021: -3.1%
New listings fell in May year-over-year even though the late spring is often a time when more homes go onto the market. Franklin County had one of the largest declines in inventory, dropping about 6.9%.


Top 10 Fastest-Selling Locations by # of Days Homes Remain on the Market Before Sale in May 2022
1. Grandview Heights: 3
2. Canal Winchester CSD: 4
3. Hilliard: 4
4. Miami Trace LSD: 4
5. Minerva Park: 4
6. Westerville: 4
7. Westerville CSD: 4
8. German Village: 5
9. Hilliard CSD: 5
10. Marsyville CSD: 5
11. Powell: 5
12. Reynoldsburg CSD: 5
13. Sunbury: 5
14. Worthington: 5
15. Worthington CSD: 5
16. Bexley: 6
17. Dublin: 6
18. Groveport Madison LSD: 6
19. Jefferson LSD: 6
20. Pickerington: 6
21. Hamilton LSD: 7
22. Lancaster CSD: 7
23. Newark CSD: 7
24. Pickerington LSD: 7
25. Upper Arlington CSD: 7
26. Whitehall: 7
27. Beechwold/Clintonville: 8
28. Gahanna: 8
29. Delaware CSD: 9
30. South Western CSD: 9
31. Blacklick: 10
32. Columbus: 10
33. Johnstown-Monroe LSD: 10
34. Gahanna Jefferson LSD: 12
35. Dublin CSD: 13
36. Grove City: 13

The “Top 10” became the Top 36 just given that most of the local markets are selling so similarly quickly. There is relatively little spread between the fastest and slowest-selling markets, with some obvious exceptions.

Top 10 Slowest-Selling Locations by # of Days Homes Remain on the Market Before Sale in May 2022
1. Northridge LSD: 84
2. Downtown: 75
3. New Albany: 29
4. Buckeye Valley LSD: 28
5. Granville CSD: 27
6. Teays Valley LSD: 27
7. London CSD: 26
8. Short North: 25
9. Jonathan Alder LSD: 22
10. Big Walnut LSD: 20
11. New Albany LSD: 19
12. Obetz: 19
13. Pataskala: 19

Top 10 Locations with the Greatest % Decline of # of Days on the Market Before Sale May 2022 vs. May 2021
1. Bexley: -76.0%
2. Jefferson LSD: -73.9%
3. Lancaster CSD: -72.0%
4. Dublin: -68.4%
5. Johnstown-Monroe LSD: -64.3%
6. Grandview Heights: -62.5%
7. Reynoldsburg CSD: -58.3%
8. Short North: -51.0%
9. Hamilton LSD: -50.0%
10. Hilliard: -50.0%
11. Westerville: -50.0%
12. Hilliard CSD: -44.4%

Top 10 Locations with the Lowest % Decline of # of Days on the Market Before Sale May 2022 vs. May 2021
1. Northridge LSD: +1,300.0%
2. Jonathan Alder LSD: +633.3%
3. Valleyview: +400.0%
4. London CSD: +188.9%
5. New Albany: +141.7%
6. New Albany LSD: +111.1%
7. Downtown: +92.3%
8. Granville CSD: +80.0%
9. Circleville CSD: +77.8%
10. Teays Valley LSD: +68.8%

% Change for the # of Days Homes Remain on the Market Before Sale Across the Metro Overall: 15.6
Overall Metro Days on Market % Change May 2022 vs May 2021: -1.3%

Columbus Realtors offers monthly housing reports and other data back several years.