Columbus City Civilian Labor Force January 2012: 422,500 Civilian Labor Force December 2012: 426,600 Yearly Change: +4,100 Employment January 2012: 392,700 Employment December 2012: 403,800 Yearly Change: +11,100 Unemployment January 2012: 29,800 Unemployment December 2012: 22,700 Yearly Change: -7,100 Unemployment Rate January 2012: 7.1% Unemployment Rate December 2012: 5.3% Yearly Change: -1.8%
Franklin County Civilian Labor Force January 2012: 617,700 Civilian Labor Force December 2012: 623,900 Yearly Change: +6,200 Employment January 2012: 574,400 Employment December 2012: 590,600 Yearly Change: +16,200 Unemployment January 2012: 43,300 Unemployment December 2012: 33,300 Yearly Change: -10,000 Unemployment Rate January 2012: 7.0% Unemployment Rate December 2012: 5.3% Yearly Change: -1.7%
City and County numbers are rounded.
Columbus Metro Area Civilian Labor Force January 2012: 949,737 Civilian Labor Force December 2012: 958,689 Yearly Change: +8,952 Employment January 2012: 880,680 Employment December 2012: 906,886 Yearly Change: +26,206 Unemployment January 2012: 69,057 Unemployment December 2012: 51,803 Yearly Change: -17,254 Unemployment Rate January 2012: 7.3% Unemployment Rate December 2012: 5.4% Yearly Change: -1.9%
Metro Area Continued Non-Farm Jobs January 2012: 927,300 Non-Farm Jobs December 2012: 962,300 Yearly Change: +35,000
Metro Yearly Jobs Changes by Industry Mining/Logging/Construction: +2,400 Manufacturing: +1,300 Trade/Transportation/Utilities: +10,700 Information: -100 Financial Activities: +1,800 Professional and Business Services: +4,400 Education and Health Services: +5,700 Leisure and Hospitality: +6,100 Other Services: +700 Government: +2,000
Ohio Overall Civilian Labor Force January 2012: 5,780,410 Civilian Labor Force December 2012: 5,728,748 Yearly Change: -51,662 Employment January 2012: 5,339,657 Employment December 2012: 5,344,151 Yearly Change: +4,494 Employment January 2012: 440,753 Employment December 2012: 384,597 Yearly Change: -56,156 Unemployment Rate January 2012: 7.6% Unemployment Rate December 2012: 6.7% Yearly Change: -0.9%
This Columbus housing market update for March 2013 includes an expansion of data, specifically the time it takes for homes to sell on the current market.
Note: LSD= Local School District, CSD= City School District. In both cases, school district boundaries differ from city boundaries.
Top 15 Most Expensive Locations By Median Sales Price in March 2013 1. New Albany: $471,000 2. Dublin: $330,000 3. Powell: $317,000 4. New Albany Plain LSD: $316,000 5. Upper Arlington CSD: $302,450 6. Olentangy LSD: $291,250 7. Granville CSD: $282,050 8. Downtown: $269,000 9. German Village: $267,250 10. Dublin CSD: $266,500 11. Hilliard: $250,000 12. Big Walnut LSD: $245,000 13. Buckeye Valley LSD: $243,000 14. Johnstown Monroe LSD: $207,250 15. Bexley: $205,000
Top 15 Least Expensive Locations by Median Sales Price in March 2013 1. Whitehall: $45,250 2. Obetz: $56,450 3. Groveport Madison LSD: $63,625 4. Hamilton LSD: $66,750 5. Columbus CSD: $85,000 6. Lancaster CSD: $89,550 7. Newark CSD: $89,900 8. South-Western CSD: $100,000 9. Columbus: $103,250 10. Sunbury: $106,900 11. Reynoldsburg CSD: $115,000 12. Jefferson LSD: $122,000 13. Blacklick: $123,500 14. London CSD: $128,000 15. Grandview Heights: $136,000
Whitehall was the cheapest market yet again, though its median prices have been going up slowly.
Overall Market Median Sales Price in March 2013: $139,028
Top 15 Locations with the Highest Median Sales Price % Growth Between March 2012 and March 2013 1. Minerva Park: +223.8% 2. Jonathan Alder LSD: +99.0% 3. Circleville CSD: +63.3% 4. Buckeye Valley LSD: +59.3% 5. Johnstown Monroe LSD: +53.5% 6. Reynoldsburg CSD: +47.4% 7. Hilliard: +47.1% 8. Downtown: +34.6% 9. Big Walnut LSD: +31.5% 10. Westerville CSD: +28.3% 11. Powell: +28.1% 12. Gahanna: +22.0% 13. Olentangy LSD: +18.4% 14. Marysville CSd: +14.8% 15. Worthington: +13.9%
Downtown continued to do well, but otherwise few places inside 270 did.
Top 15 Locations with the Lowest Median Sales Price % Growth Between March 2012 and March 2013 1. Grandview Heights: -43.7% 2. Sunbury: -42.6% 3. Obetz: -29.3% 4. Whitehall: -24.3% 5. Bexley: -21.1% 6. Lithopolis: -20.1% 7. Hamilton LSD: -15.8% 8. Blacklick: -12.0% 9. Pataskala: -9.2% 10. Delaware CSD: -5.3% 11. Gahanna Jefferson CSD: -5.1% 12. Beechwold/Clintonville: -4.1% 13. South-Western CSD: -2.9% 14. London CSD: -1.9% 15. Columbus CSD: -1.0%
Overall Market Median Sales Price % Change March 2012 vs. March 2013: +9.9%
Top 10 Locations with the Most New Listings in March 2013 1. Columbus: 1,309 2. Columbus CSD: 811 3. South-Western CSD: 221 4. Olentangy LSD: 197 5. Hilliard CSD: 195 6. Westerville CSD: 185 7. Dublin CSD: 140 8. Pickerington LSD: 100 9. Worthington CSD: 97 10. Dublin: 93
Top 10 Locations with the Fewest New Listings in March 2013 1. Valleyview: 1 2. Lithopolis: 2 3. Minerva Park: 4 4. Jefferson LSD: 6 5. Johnstown Monroe LSD: 8 6. Jonathan Alder LSD: 9 7. Obetz: 10 8. Hamilton LSD: 13 9. Grandview Heights: 14 10. Sunbury: 17 11. Circleville CSD: 17
Total New Listings in the Columbus Metro in March 2013: 3,222 Overall Metro New Listings % Change March 2012-March 2013: +0.2%
Prices were up almost 10% year over year for the month despite a small increase in overall supply.
Top 10 Fastest-Selling Locations by # of Days Homes Remain on the Market Before Sale in March 2013 1. Minerva Park: 3 2. Worthington: 29 3. Granville CSD: 35 4. Jonathan Alder LSD: 36 5. Upper Arlington CSD: 51 6. Downtown: 54 7. Pickerington: 54 8. Pickerington LSD: 60 9. Dublin CSD: 61 10. Grandview Heights: 63 11. Groveport Madison LSD: 63 12. Reynoldsburg CSD: 63 13. South-Western CSD: 63 14. Grove City: 65 15. Powell: 65
Top 10 Slowest-Selling Locations by # of Days Homes Remain on the Market Before Sale in March 2013 1. Bexley: 188 2. Circleville CSD: 168 3. Sunbury: 163 4. Lancaster CSD: 140 5. Big Walnut LSD: 129 6. Hilliard: 125 7. Lithopolis: 121 8. Newark CSD: 120 9. Obetz: 119 10. Gahanna: 117
The Columbus Realtors provides market condition reports going back many years.
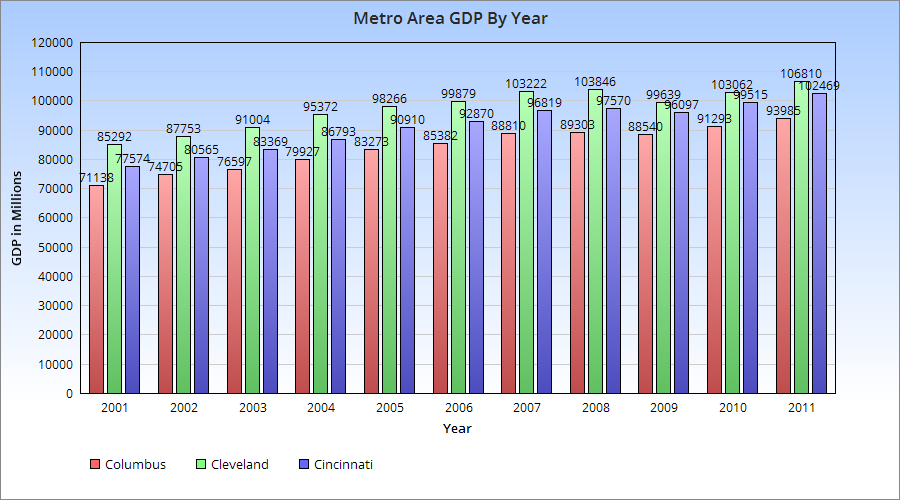
Recently the US Bureau of Economic Analysis released GDP numbers for metro areas for 2011. Below is a chart for Ohio’s 3-Cs of GDP from 2001 to 2011.
All the metros saw GDP growth during this period, and all saw dips during the recession before growing again the past few years.
Total Growth (in Millions) 2001-2011 Cincinnati: $24,795 Columbus: $22,850 Cleveland: $21,518
GDP % Growth 2001-2011 Columbus: 32.1% Cincinnati: 31.9% Cleveland: 25.2%
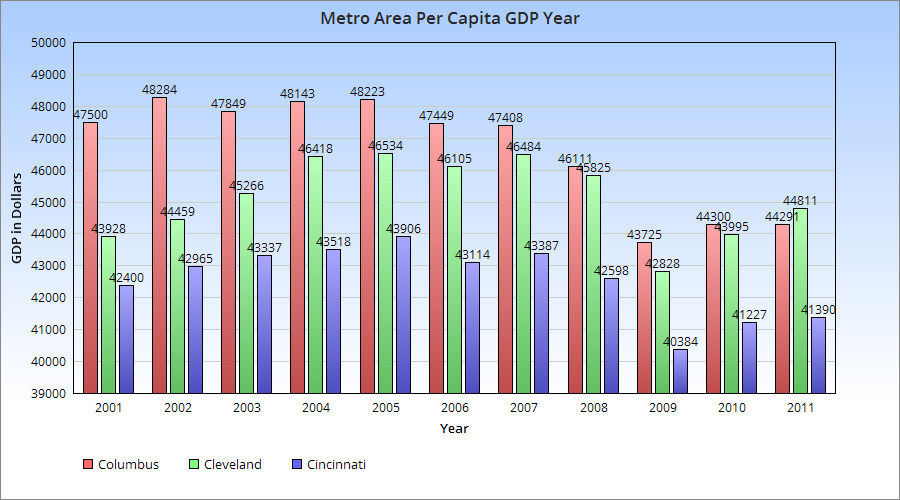
So this shows that the Columbus metro has had the fastest growth the past 10 years in its GDP, albeit only a bit faster than Cincinnati. The graph above shows the metro GDP per capita. Columbus was clearly ahead the first half of the last decade, but has fallen since. There are two reasons for this: Continuously growing population and the recession. A growing population and stagnant GDP during the recession meant that the GDP was diluted between more people. Neither of the other two faced the strong population growth during the recession. I expect the trends will reverse again over the next few years, however.
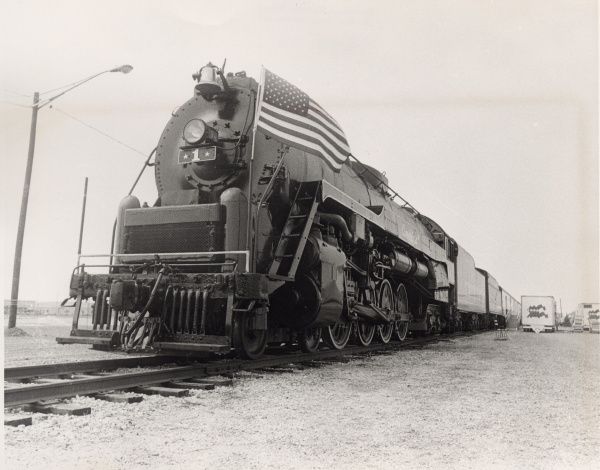
Rail in some form existed in Columbus from the 1850s through the mid-1970s. For generations, rail travel was the way to go. It was the connector of distances, the driver of local and state economies. On the local scale, it brought folks to and from their city’s downtown areas for shopping and employment, and the trolley, interurban and other rail systems were as prolific as the horse and buggy before them. So what happened? In this Why Columbus Doesn’t Have Rail Part 1, we will review all of the history of rail travel within the city.
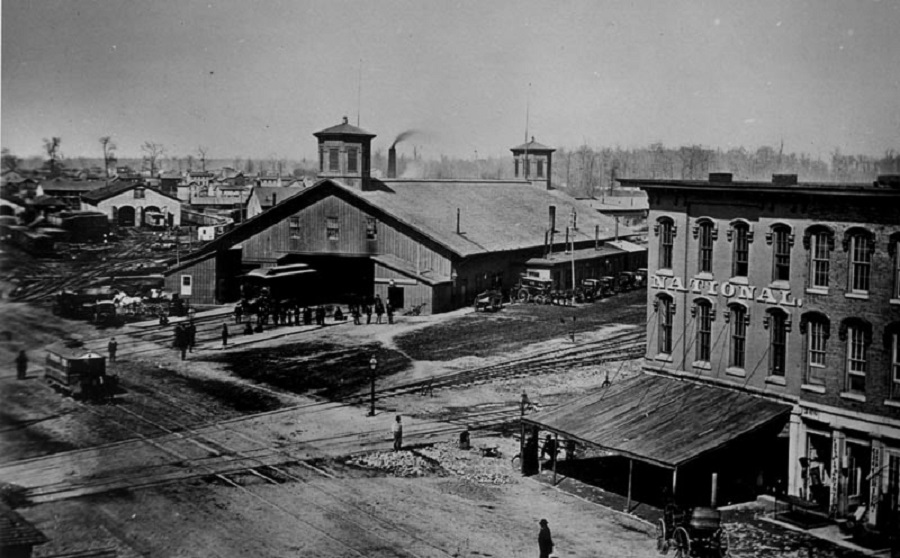
Most people today are aware of the Union Station that existed on High Street where the Convention Center is now, but there were actually 2 more depots that proceeded it. Columbus got it’s first real taste of rail travel in 1851, when the Columbus Union Depot opened, a year after the city’s first railroad, the Columbus & Xenia, entered the city. It was followed by the Cleveland, Columbus & Cincinnati Railroad in 1851. Both railroads wanted their depots to be as close to the downtown area as possible, as this was the center of the city’s population and commercial activity. At the time, the city was significantly smaller than it is now. Today, Chestnut and Naughten Streets are within the heart of Downtown, but in the early 1850s, there was almost no development north of these streets, so the two railroads collaborated and purchased a plot of land at the northeastern corner of the North High Street and Naughten intersection, about where the Hyatt Regency is today. This would be the location of their new terminal, the Columbus Union Depot.
The first Union Station that operated between 1851-1875.
This was the first depot in the city and resembled a barn, in some ways similar to the first North Market building that would go up nearby. It was built to handle 3 railroads but by the early 1870s was handling the traffic of 5, well exceeding capacity. Beyond the inadequate size, the depot’s trains dangerously and regularly blocked traffic on High Street, much to the anger of many residents. The push for a new depot began.
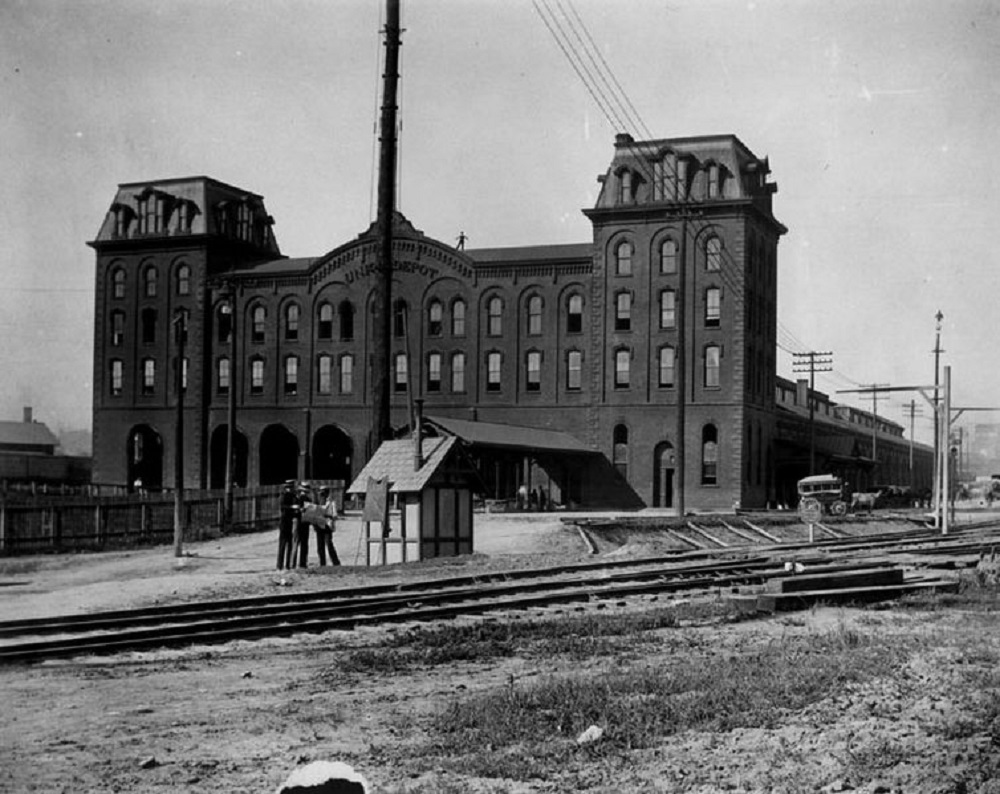
Plans were approved in 1871 for the new depot and it was completed and opened in February 1875, with the old depot torn down and many of the old tracks relocated/rerouted to the much larger depot, now located further east of the old depot location, just north of Naughten. Not only was it much larger, but much grander in design. No longer a giant, single story barn, it was instead a 3-story red brick structure and had many architectural features that the previous depot lacked. Tracks still crossed High, but a 160-ft tunnel underneath helped to relieve congestion. For years, this new setup solved many of the previous problems, but a steady increase in train traffic (there were over 120 daily trains by the early 1890s), as well as pedestrian and horse and buggy traffic getting too and from the depot began to cause major problems in the area once more. A new depot was once again needed.
Union Station 1875-1897.
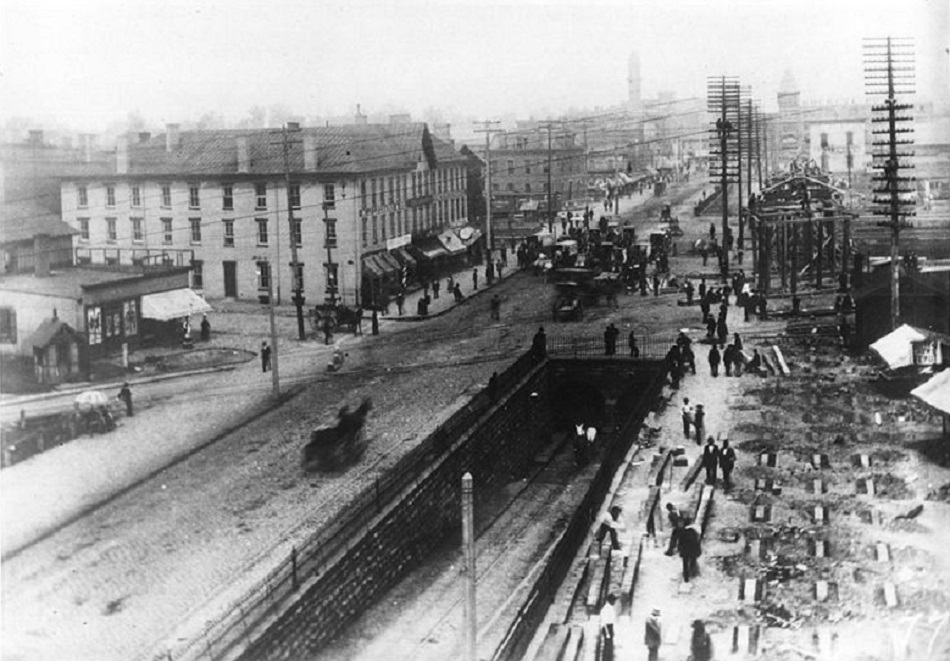
The High Street tunnel that connected the 2nd depot, around 1888.
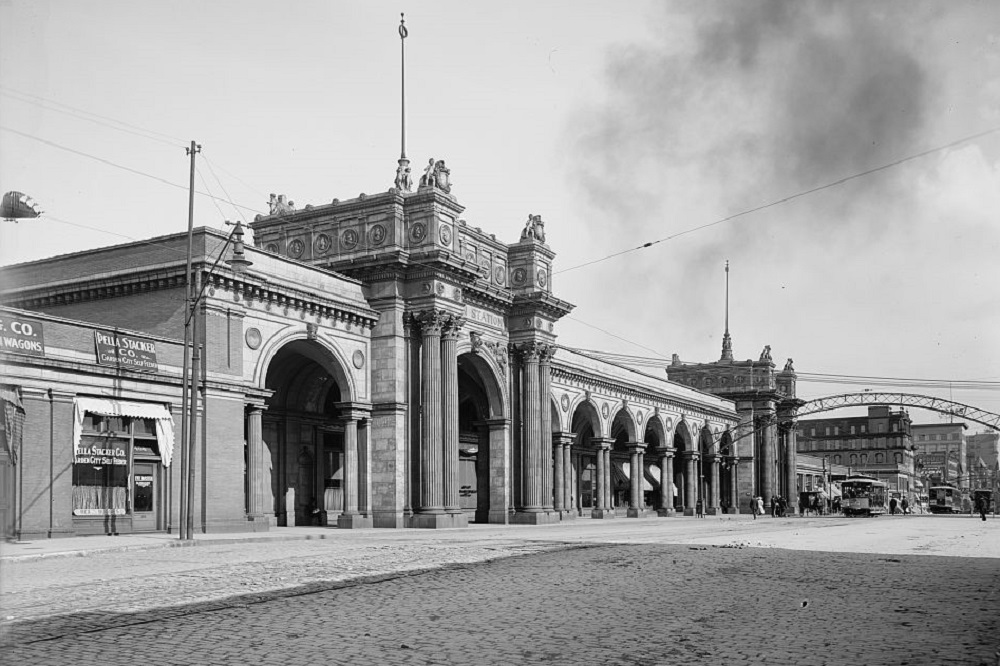
The third and most recognizable depot was completed in 1897: Union Station. It was, by far, the largest and most elaborately designed depot of the three, with 45-ft ceilings, a grand concourse and ornate plaster details. Much of the glamour was lost in a 1920′s remodeling, however, and falling numbers of daily trains gradually eroded maintenance levels. Union Station continued to serve passengers for nearly 50 more years, until the last passenger train passed through Union Station on April 28, 1977, ending over 125 years of passenger rail in the city. Demolition of Union Station had begun almost 7 months earlier, in an underhanded tactic to make way for a proposed convention center. The depot, particularly the arcade section along High Street, had been put on the National Register of Historic Places in 1974, and preservationists had won an injunction to stop demolition. However, a coalition led by Battelle rushed to demolish the building anyway, and by the time preservationists could act, most of it had already been lost. A single archway was all that remained, and today it sits on the northern corner of McPherson Commons park in the Arena District, a lonely testament to what was lost. The rest of the station was demolished by the fall of 1979. Ironically, the best evidence of how preservation attitudes have changed is just a bit further north with the I-670 retail cap. It is designed to resemble the Union Station arcade.
Union Station in 1910. It existed from 1897-1977.
Beyond heavy passenger rail, Columbus also had a streetcar system. The Columbus Street Railroad Company was formed in 1854, but the first streetcar did not come about until June 1863, when a horse-powered car arrived on High Street. By the 1890s, more than a dozen street rail companies were in the city and had almost 35 miles of tracks. Most of these were also horse-drawn until the early 1890s, when electrified lines proved far more efficient, making horse-drawn lines obsolete.
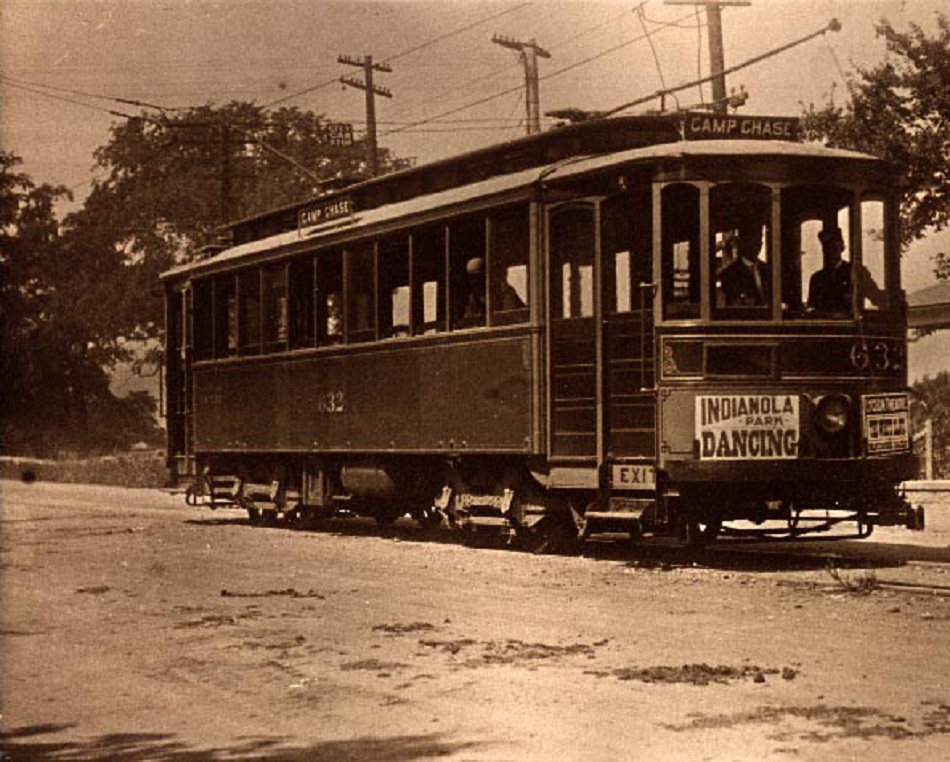
The Camp Chase streetcar.
Electric lines and passenger totals continued to grow over the next few decades and, by the mid 1910s, annual passenger tickets exceeded 65 million, equating to almost one trip per day for every man, woman and child living in Columbus at the time. By the 1920s, streetcar lines had spread to almost all of the urban core neighborhoods and inner ring suburbs, but passenger totals were already falling as the automobile increased in popularity. In the 1930s, an attempt was made to adapt to this changing transit environment and the fixed-track streetcars began to be replaced with trolley buses, with the last streetcar decommissioned in 1948. They too, however, only lasted until 1965, when they were replaced with the standard diesel bus.
In Part 2, I’ll examine what happened and why rail has, to this date, not returned to the city.