Columbus Area Zip Codes and Their Economies


A lot of requests for zip code data come into this site, so I thought it might be a good idea to provide some.

First, we have a map for the Columbus area that includes the % of of employees in a particular zip code from 2000-2010.
Columbus area zip codes and their economies

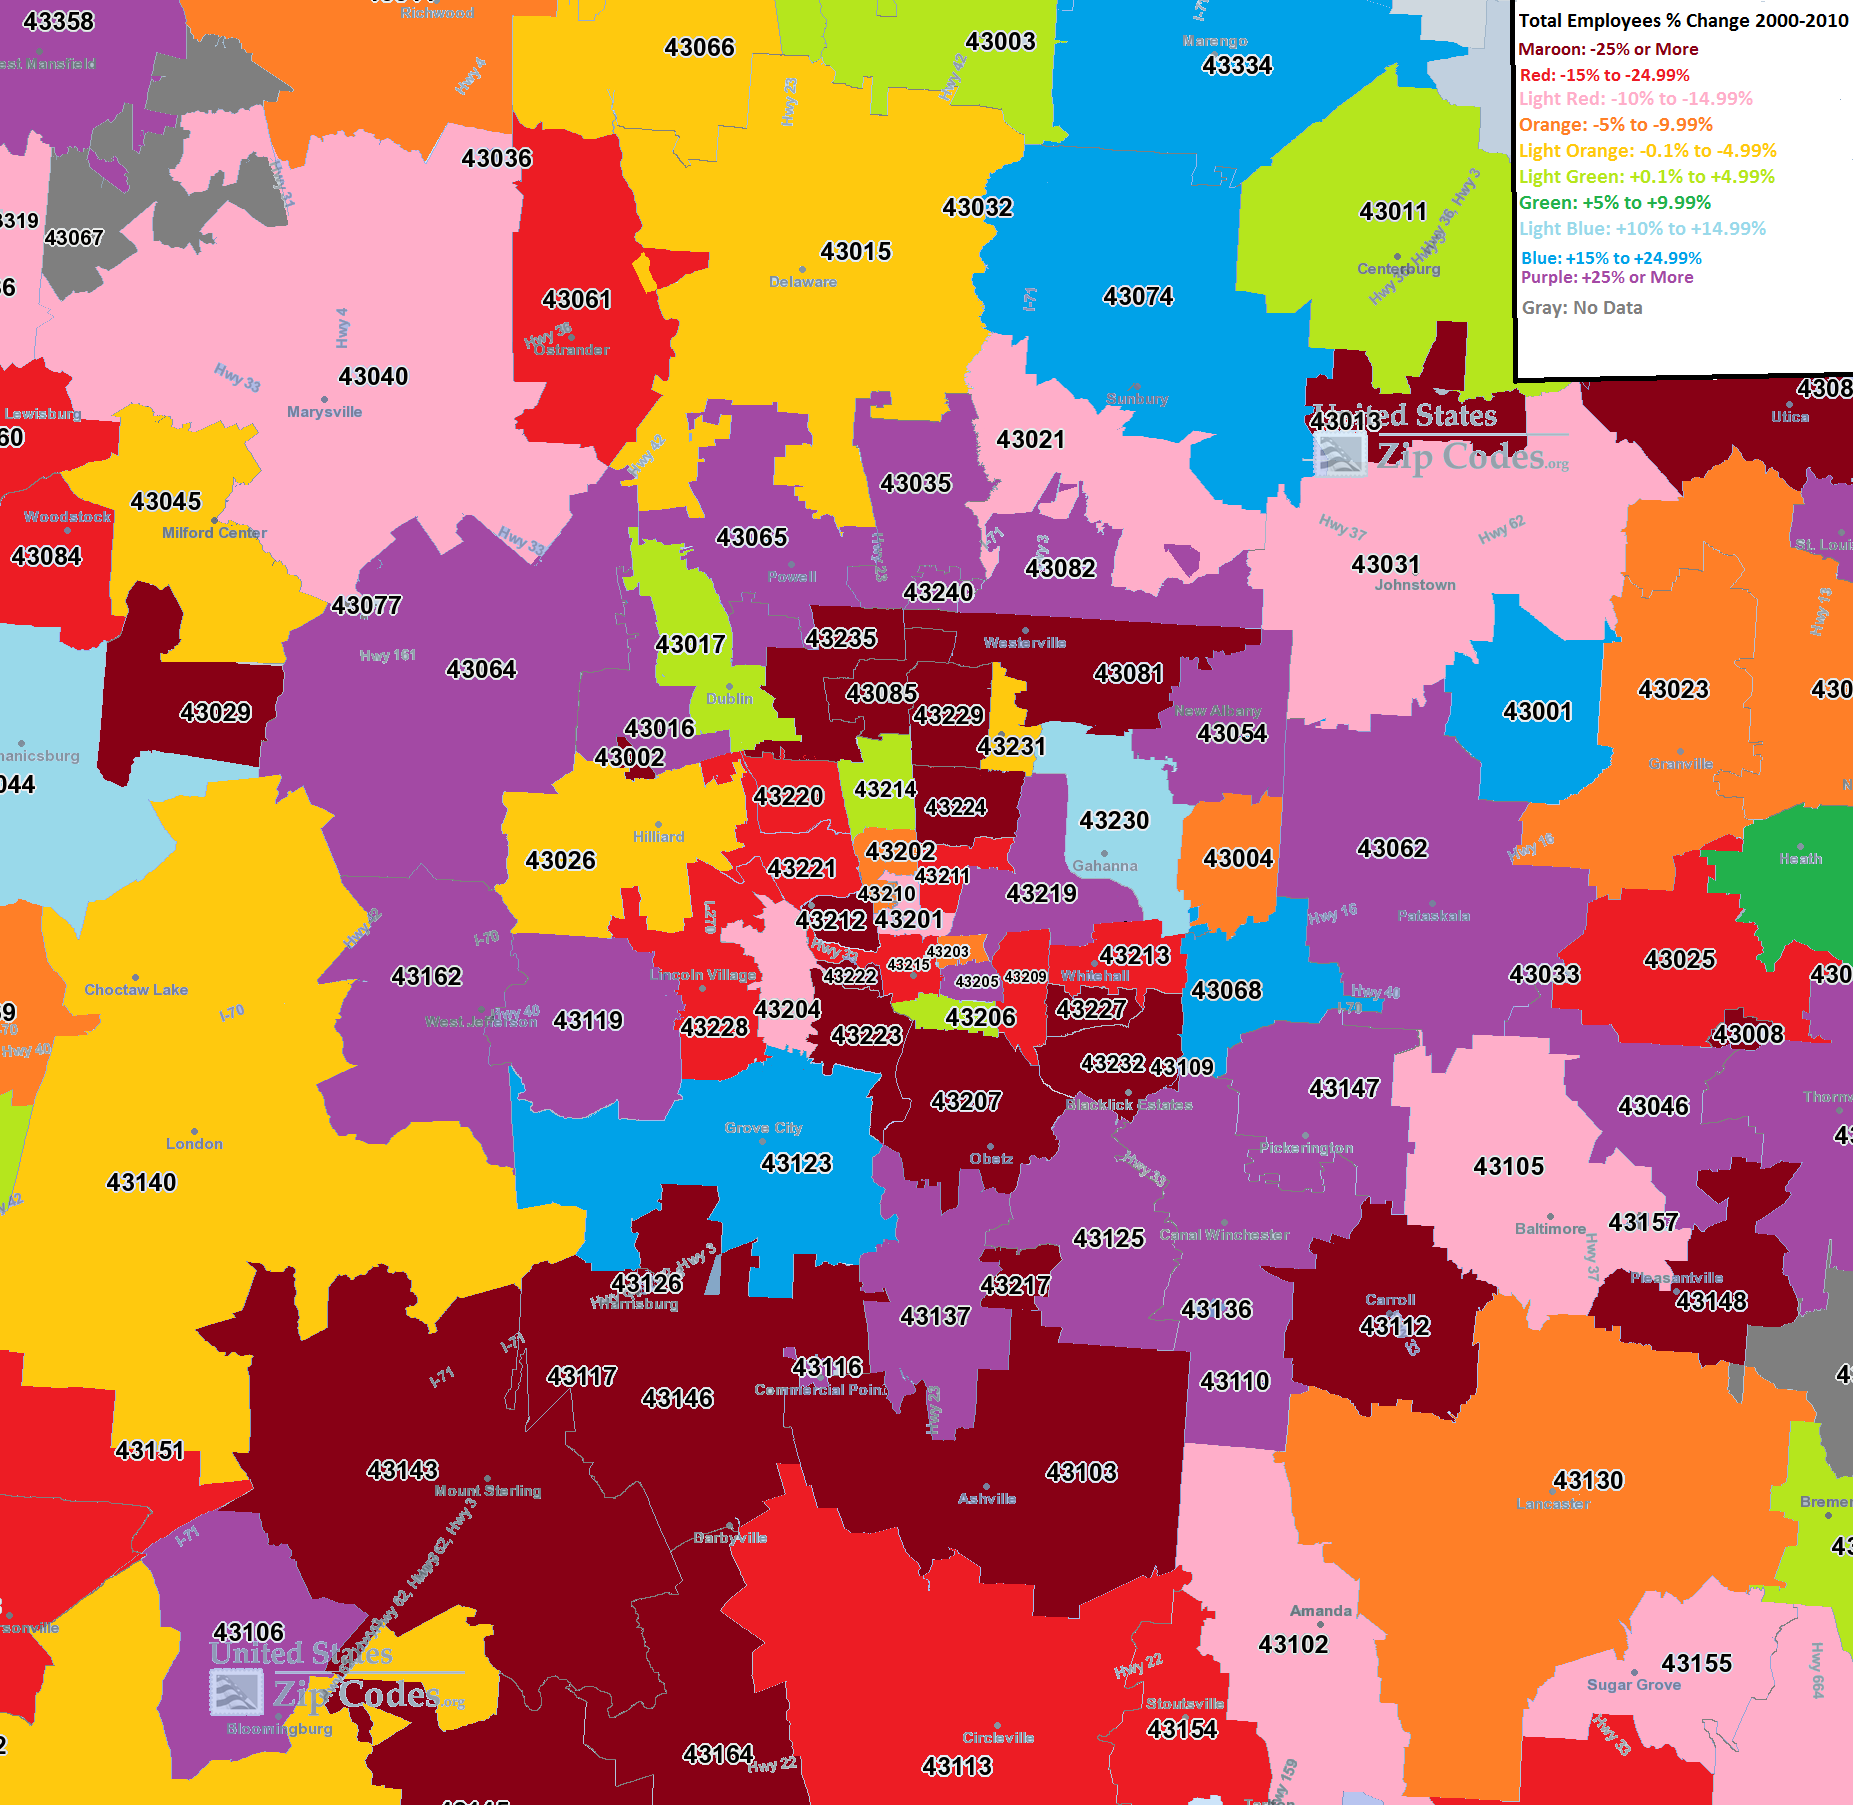
From this map, the urban areas of Columbus seem to have lost the most % of their employees the last decade, along with the far suburban and rural areas. The biggest growth was in the areas along and just outside of 270. This is an interesting map as it implies that the nearest suburban areas are attracting the most jobs, but that these suburbs are are both pulling from the inner core, but also from much further out.

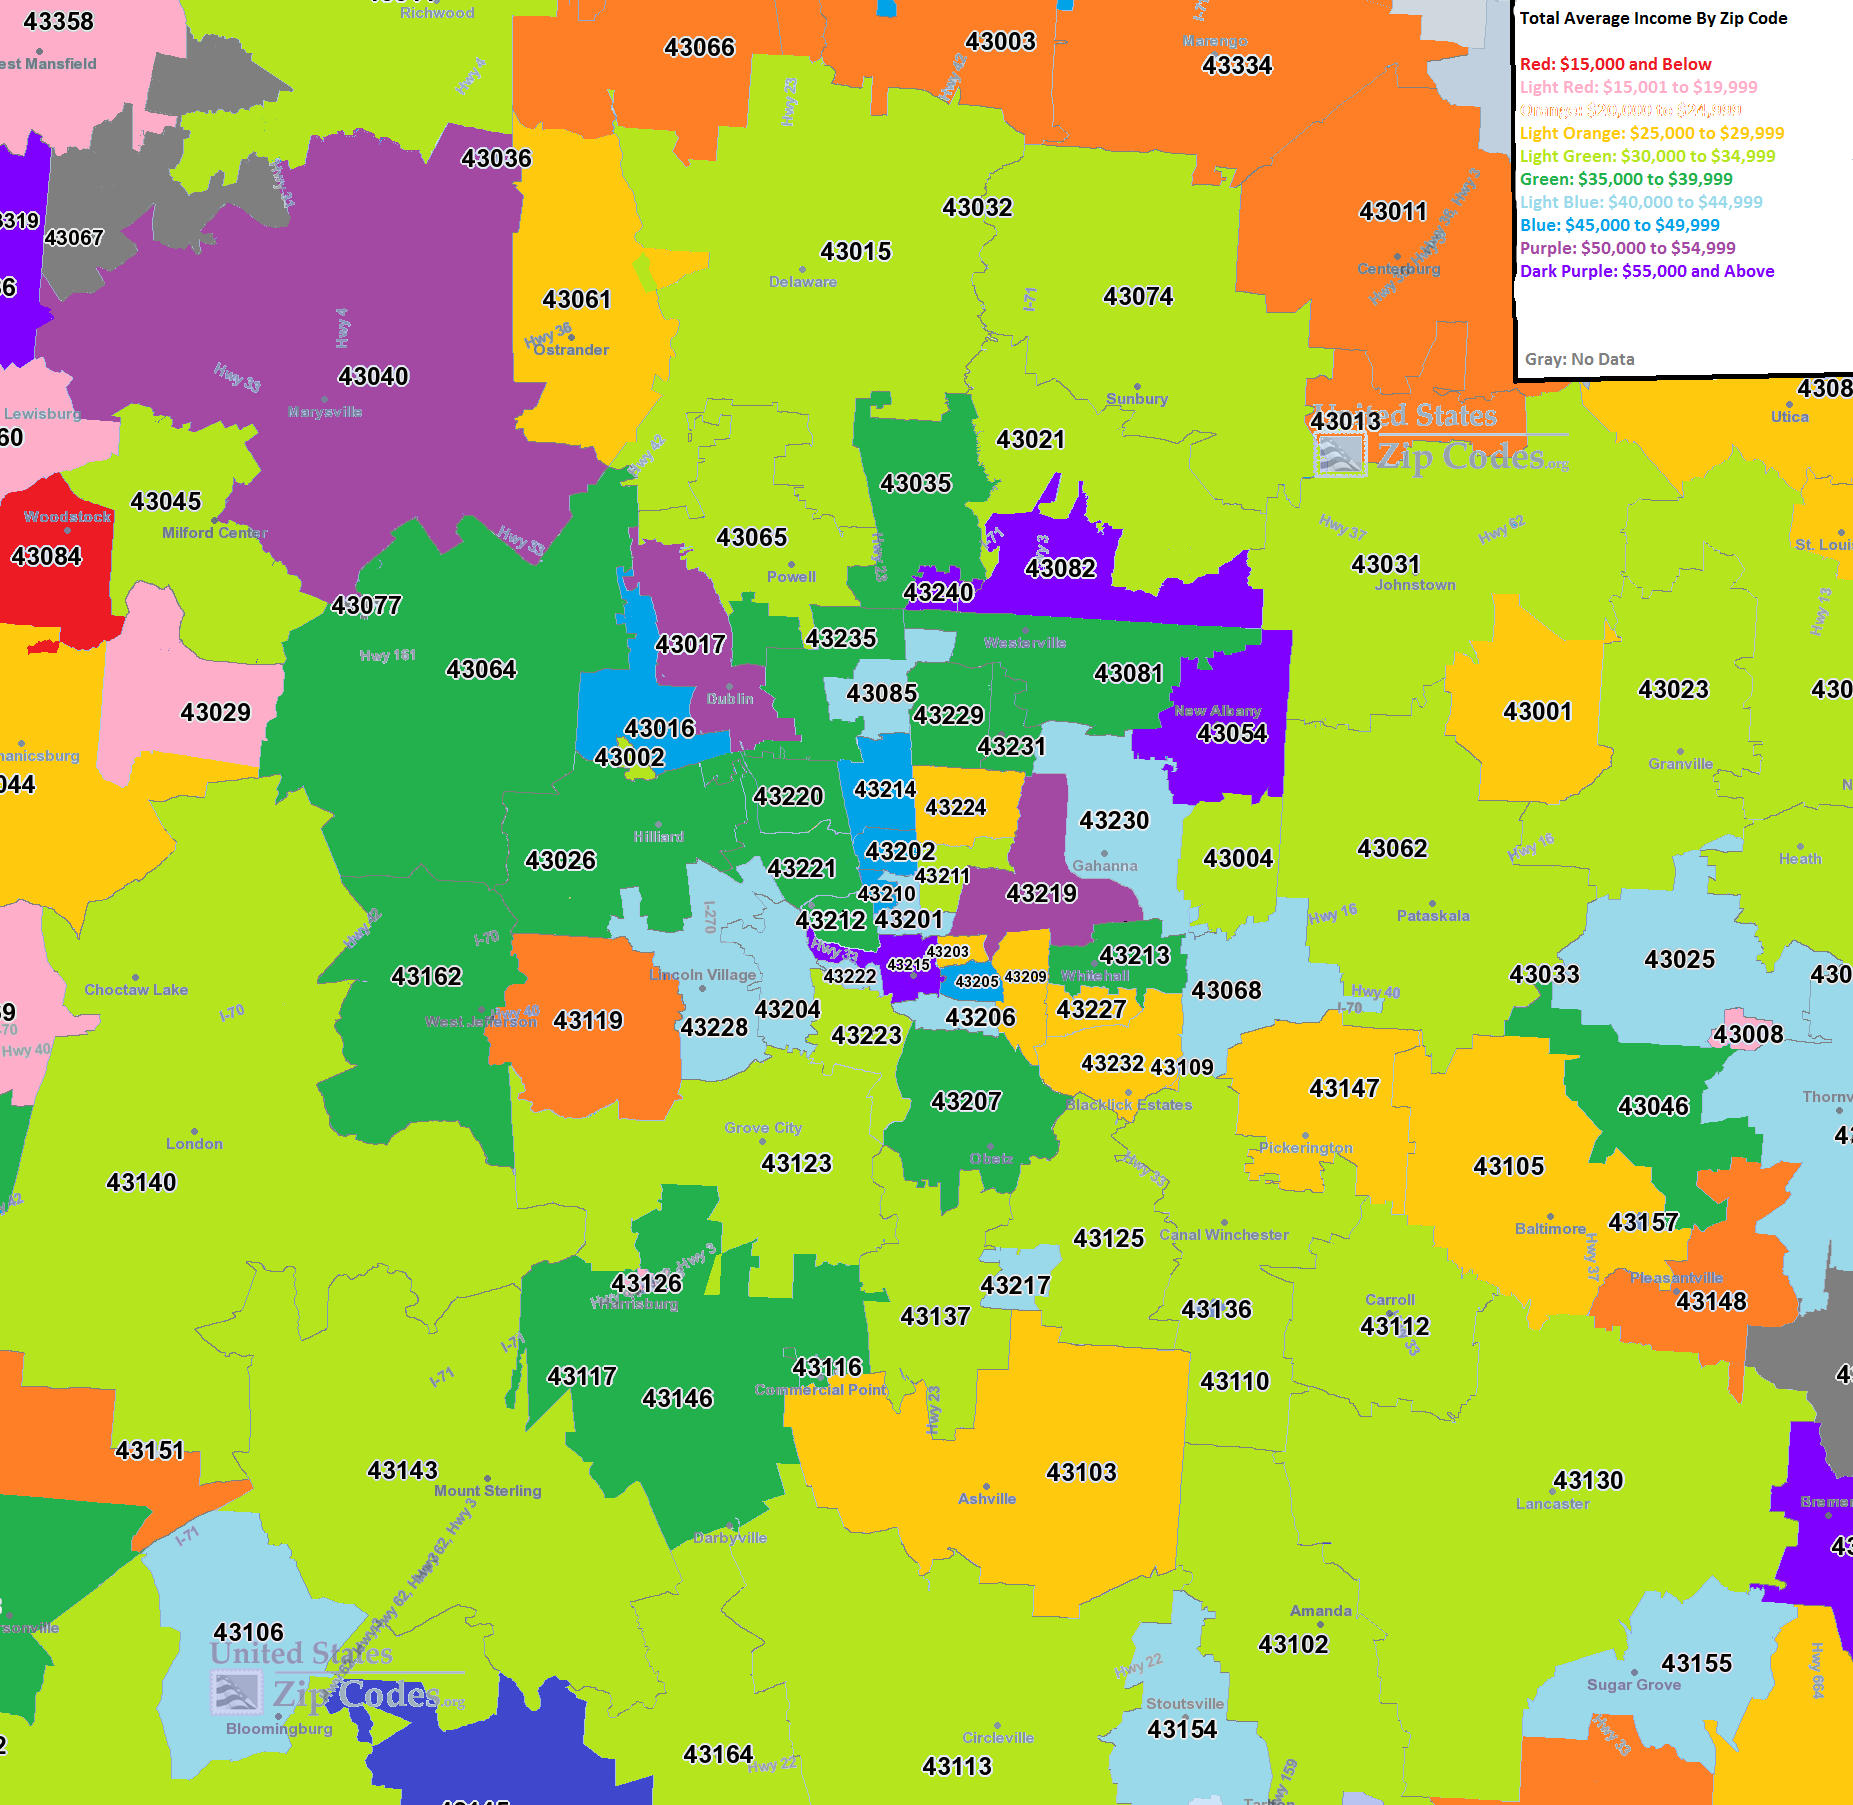
The second map is for average employee income by zip code.

What this map seems to show is that, while jobs may be moving to the I-270 suburbs, pay for those jobs is decidedly mixed across the city. Downtown, for example, averaged some of the highest incomes in the city. Other strong areas include parts of Westerville, New Albany and Dublin. Most of the High Street corridor was fairly strong as well. The lowest incomes were almost entirely in rural and far suburban areas.

Finally, the % change of average income from 2000-2010.

This map is also a mixed bag. Most of the area saw wage growth, but where it occurred the strongest was definitely all over the map. Some suburbs had good and bad, and so did the urban core areas.

So what’s all this mean? Well, certainly it means that the total # of jobs as far as growth shifted to the 270 suburbs the last decade, but at the same time, those jobs that remained in the core areas still grew in income. So it appears that the city is becoming richer about on par with the suburbs, at least the last 10 years. The question becomes, what happens the next decade? If urban trends continue the way they have the past few years (which these maps don’t really take into account), it is entirely possible that some of the job growth will move back inward towards the urban core.

To continue with local and national economic data, the US’ Bureau of Economic Analysis gives the option to look at cities, metro areas and other levels. Zip Code Maps gives population and demographic data in an interactive format.


Housing Market Update January 2013


housing market update January 2013

Columbus housing market update January 2013

We’re starting a new year in this edition of the Columbus Housing Market Update, with new January 2013 data now available!

Note: LSD= Local School District, CSD= City School District. In both cases, school district boundaries differ from city boundaries.

Top 15 Most Expensive Locations By Median Sales Price in January 2013
1. New Albany: $447,500
2. Powell: $342,500
3. Upper Arlington CSD: $320,000
4. New Albany Plain LSD: $314,400
5. Dublin: $284,00
6. Bexley: $269,950
7. Olentangy LSD: $250,101
8. German Village: $241,618
9. Worthington: $228,938
10. Grandview Heights: $223,000
11. Downtown: $210,000
12. Granville CSD: $207,000
13. Dublin CSD: $190,450
14. Big Walnut LSD: $187,000
15. Marysville CSD: $182,000

New Albany continued to be the most expensive market.

Top 15 Least Expensive Locations by Median Sales Price in January 2013
1. Whitehall: $29,750
2. Hamilton LSD: $54,500
3. Columbus CSD: $68,500
4. Groveport Madison LSD: $70,000
5. Lancaster CSD: $71,250
6. Valleyview: $79,850
7. Newark CSD: $84,500
8. Reynoldsburg CSD: $94,500
9. Columbus: $95,000
10. Jefferson LSD: $95,000
11. South-Western CSD: $103,000
12. Circleville CSD: $109,000
13. Canal Winchester CSD: $112,000
14. Pataskala: $120,000
15. London CSD: 122,000

Whitehall was by far the cheapest market to buy into this month.

Overall Market Median Sales Price in January 2013: $120,885

Top 15 Locations with the Highest Median Sales Price % Growth Between January 2012 and January 2013
1. Newark CSD: +83.3%
2. Valleyview: +76.5%
3. Lithopolis: +71.1%
4. Circleville CSD: +61.4%
5. Groveport Madison LSD: +60.9%
6. Marysville CSD: +38.8%
7. London CSD: +34.8%
8. New Albany: +29.7%
9. Columbus CSD: +28.0%
10. Grandview Heights: +27.4%
11. Columbus: +26.7%
12. Upper Arlington CSD: +24.3%
13. Downtown: +19.3%
14. Sunbury: +18.4%
15. South-Western CSD: +16.1%

Downtown and Columbus overall made the top markets for appreciation in the past year.

Top 15 Locations with the Lowest Median Sales Price % Growth Between January 2012 and January 2013
1. Granville CSD: -50.7%
2. Jonathan Alder LSD: -33.0%
3. Westerville: -29.2%
4. Dublin CSD: -23.3%
5. Hamilton LSD: -21.6%
6. Jefferson LSD: -20.8%
7. Big Walnut LSD: -19.7%
8. Bexley: -17.6%
9. Gahanna: -17.0%
10. Johnstown Monroe LSD: -16.2%
11. Westerville CSD: -14.8%
12. Worthington CSD: -12.5%
13. German Village: -10.5%
14. Grove City: -6.4%
15. Whitehall: -4.9%

Overall Market Median Sales Price % Change January 2012 vs. January 2013: +8.6%

Top 10 Locations with the Most New Listings in January 2013
1. Columbus: 957
2. Columbus CSD: 605
3. South-Western CSD: 210
4. Olentangy LSD: 146
5. Hilliard CSD: 126
6. Westerville CSD: 109
7. Dublin CSD: 94
8. Pickerington LSD: 81
9. Grove City: 66
10. Groveport Madison LSD: 65

Top 10 Locations with the Fewest New Listings in January 2013
1. Valleyview: 1
2. Minerva Park: 1
3. Lithopolis: 2
4. Jefferson LSD: 3
5. Obetz: 6
6. Jonathan Alder LSD: 8
7. Grandview Heights: 9
8. Sunbury: 10
9. Johnstown Monroe LSD: 10
10. Hamilton LSD: 12
11. Whitehall: 15

Total New Listings in the Columbus Metro in January 2013: 2,388
Overall Metro New Listings % Change January 2012-January 2013: -3.7%

This month, prices increased as overall supply slipped.

For more information on the local market, go here: Columbus Realtors


Columbus as a Tech City


Columbus has been mentioned a few times over the years as a growing tech job market. Forbes named it the #1 Up and Coming Tech City in 2008, for example, although Forbes seems to randomly choose cities for its exhausting number of rankings each year, so that can be taken with a grain of salt. So is Columbus as a tech city really a thing? The latest ranking suggests it might be.

The actual tech growth numbers aren’t subjective. Out of the 51 largest metros, here is how Columbus ranked the last decade or so in STEM jobs (Science, Technology, Engineering and Mathematics).

2001-2012 % Growth in Total STEM Jobs: +10.4% Rank of 51: 13th
2005-2012 % Growth in Total STEM Jobs: +12.8% Rank of 51: 9th
2010-2012 % Growth in Total STEM Jobs: +4.7% Rank of 51: 16th
2012 Location Quotient*: 1.27 LQ Rank of 51: 14th
2001-2012 Location Quotient Change: +7.6% Change Rank of 51: 5th

*Location Quotient is the local share of STEM jobs divided by the national share of STEM jobs. Anything above 1.0 indicates that the local share is higher than the national average.

So Columbus is clearly doing well and is handily beating out many much larger cities. It is one of only two Midwestern cities in the top 15 (Indianapolis is #15), and its rate of growth in concentration of STEM jobs is in the top 5 nationally. As the article discusses, traditional tech centers are actually losing STEM jobs while other areas, like Columbus, are gradually becoming bigger players. A well-educated workforce is paramount, and one of Columbus’ greatest strengths is its abundance of colleges and universities and young population. There are over 100,000 students in the area, and this ensures a strong workforce available for tech jobs. An example of how this attracts new STEM jobs was the recently announced plan by IBM to open its worldwide HQ for Advanced Analytics in Dublin along with 500 new jobs. The article with more details on this project can be found here.


Some Great Economic News


First, http://www.bizjournals.com/columbus/morning_call/2013/01/columbus-hangs-on-to-no-4-spot-in.html
In this ranking, Columbus was 4th behind OKC, Austin and Houston on the overal “Economic Vitality Index”, a measure that uses 18 catergories to determine the strength of an economy.

Second is this: http://www.bizjournals.com/columbus/news/2013/01/15/columbus-only-midwest-city-to-regain.html
This link shows that the Columbus metro is one of only 14 major metros nationally (out of 102) that had gained more jobs through November 2012 than it lost during the Great Recession, meaning it has exceeded a 100% recovery from the downturn. It was also the only Midwestern metro to have achieved this feat.

Stories and rankings like this prove that Columbus has little or nothing in common with its nearby Rust Belt neighbors. It has long had a steady, growing economy that has been able to recover quickly from economic downturns. Say what you will about weather or other factors, but the #1 reason for people to move somewhere has to do with economics. So long as there are jobs available and a decent cost of living, people should continue to flock to that place. In that regard, Columbus definitely seems to have a bright future.

Housing Market Update December 2012


housing market update December 2012

In a first of its kind, this is the Columbus housing market update for December 2012. In it, the local housing market will be detailed by categories such as most expensive market, market listing rankings and more.

Note: LSD= Local School District, CSD= City School District. In both cases, school district boundaries differ from city boundaries.

Top 15 Most Expensive Locations By Median Sales Price in December 2012
1. New Albany: $535,000
2. New Albany Plain LSD: $397,450
3. German Village: $376,000
4. Grandview Heights: $362,500
5. Powell: $354,950
6. Dublin: $343,600
7. Granville CSD: $330,000
8. Bexley: $325,000
9. Upper Arlington CSD: $319,500
10. Olentangy LSD: $315,000
11. Big Walnut LSD: $306,250
12. Dublin CSD: $271,500
13. Worthington: $$270,000
14. Buckeye Valley LSD: $259,000
15. Sunbury: $253,000

New Albany was by far the most expensive local market around Columbus.

Top 15 Least Expensive Locations by Median Sales Price in December 2012
1. Obetz: $80,100
2. Hamilton LSD: $80,100
3. Whitehall: $85,950
4. Newark CSD: $86,900
5. Lancaster CSD: $103,000
6. Jefferson LSD: $123,000
7. London CSD: $124,000
8. Groveport Madison LSD: $125,900
9. Reynoldsburg CSD: $125,950
10. Columbus CSD: $129,900
11. South-Western CSD: $131,000
12. Columbus: $140,026
13. Jonathan Alder LSD: $150,000
14. Minerva Park: $159,500
15. Grove City: $160,950

Southern and eastern suburbs tend to perform best on this list, as well as Columbus itself.

Overall Market Median Sales Price in December 2012: $158,645

Top 15 Locations with the Highest Median Sales Price % Growth Between December 2011 and December 2012
1. Whitehall: +69.5%
2. Circleville CSD: +64.9%
3. Sunbury: +63.0%
4. Jefferson LSD: +53.5%
5. Big Walnut LSD: +44.1%
6. Canal Winchester CSD: +40.9%
7. Westerville: +29.8%
8. Westerville CSD: +27.3%
9. Powell: +25.4%
10. Pataskala: +24.0%
11. Olentangy LSD: +23.5%
12. Gahanna Jefferson CSD: +21.8%
13. Grandview Heights: +21.2%
14. Granville CSD: +20.0%
15. Pickerington: +17.7%

Top 15 Locations with the Lowest Median Sales Price % Growth Between December 2011 and December 2012
1. London CSD: -53.5%
2. Obetz: -38.3%
3. Hamilton LSD: -27.1%
4. Jonathan Alder LSD: -25.2%
5. Buckeye Valley LSD: -23.0%
6. Reynoldsburg CSD: -18.7%
7. Hilliard: -17.7%
8. Lancaster CSD: -17.6%
9. Grove City: -15.3%
10. Dublin CSD: -12.8%
11. Johnstown Monroe LSD: -10.8%
12. Upper Arlington CSD: -8.5%
13. Newark CSD: -8.1%
14. Dublin: -7.1%
15. South-Western CSD: -6.4%

Overall Market Median Sales Price % Change December 2011 vs. December 2012: -0.3%

Top 10 Locations with the Most New Listings in December 2012
1. Columbus: 829
2. Columbus CSD: 544
3. South-Western CSD: 136
4. Olentangy LSD: 122
5. Westerville CSD: 100
6. Hilliard CSD: 94
7. Dublin CSD: 89
8. Worthington CSD: 66
9. Dublin: 64
10. Pickerington LSD: 60

Top 10 Locations with the Fewest New Listings in December 2012
1. Valleyview: 0
2. Lithopolis: 1
3. Sunbury: 2
4. Minerva Park: 2
5. Obetz: 3
6. Johnstown Monroe LSD: 5
7. Jefferson LSD: 8
8. German Village: 8
9. Hamilton LSD: 8
10. Whitehall: 11
11. Granville CSD: 12

Total New Listings in the Columbus Metro in December 2012: 2,002
Overall Metro New Listings % Change December 2011-December 2012: +10.5%

Overall, prices are slightly down as supply is currently outstripping demand.

For more information on the local market, go here: Columbus Realtors