Part 2 is now available for more great before and after comparisons.
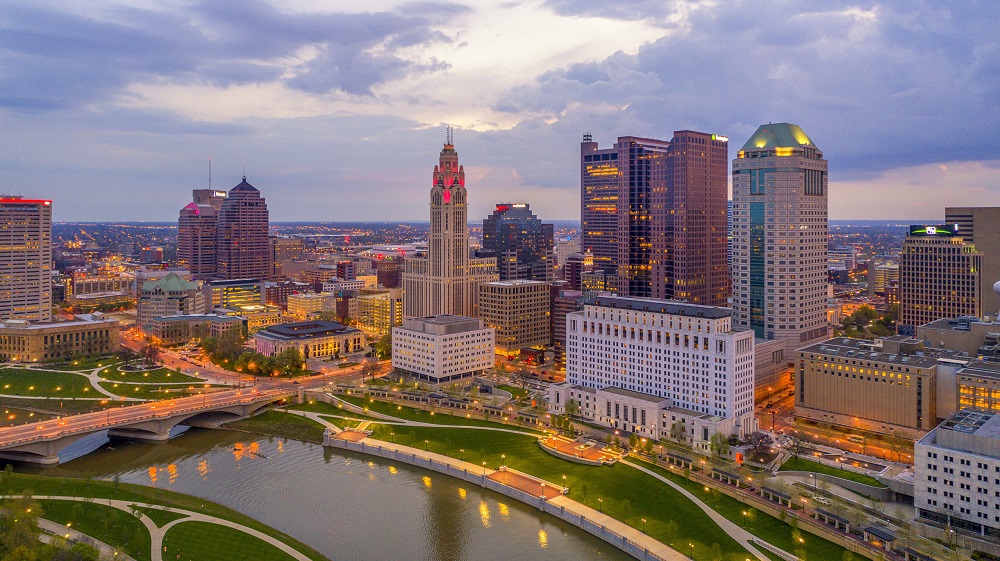
How Columbus has changed in 10 years is not always easily quantifiable. Columbus added more people in the past decade than during any previous similar period in its history. I’ve posted a lot about the 2020 Census data and updated many pages worth of information to the site. However, examining only population change through numbers is just one part of the story. How has that population growth manifested in terms of how the city appears in its built environment? This before and after look shows how the city has been transformed on a visual scale, and shows how some of the hottest neighborhoods have been radically altered in a short time.
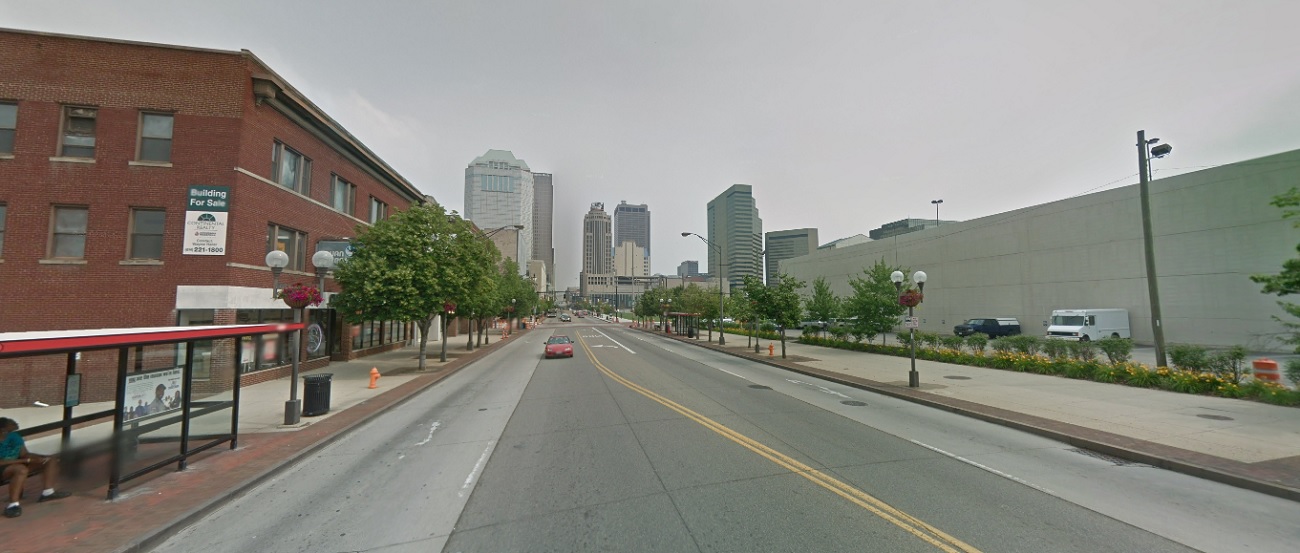
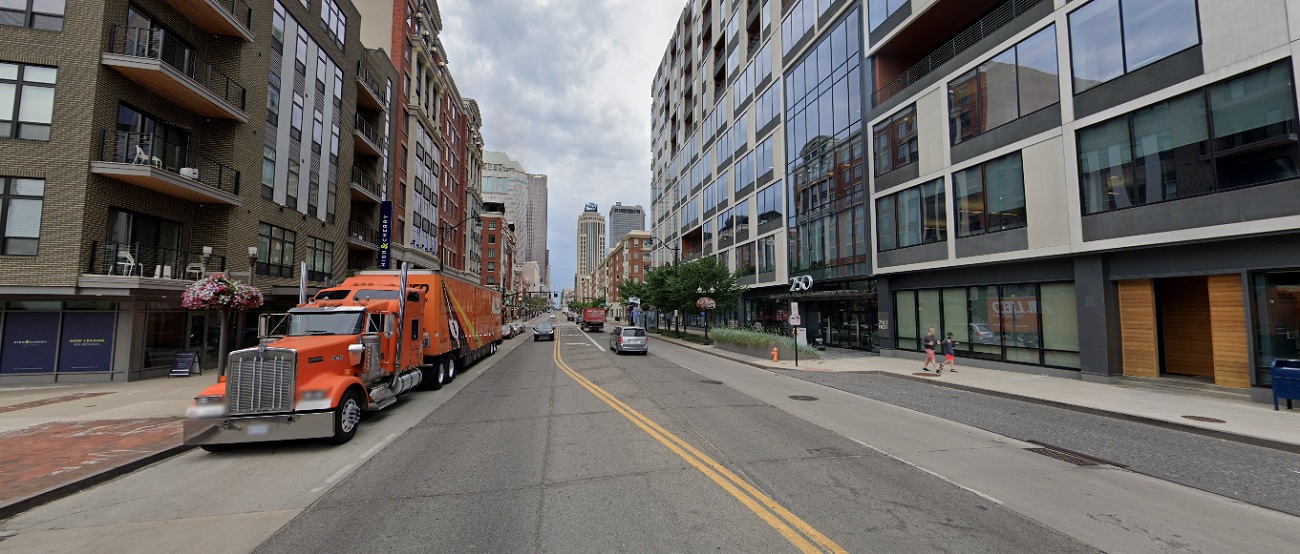
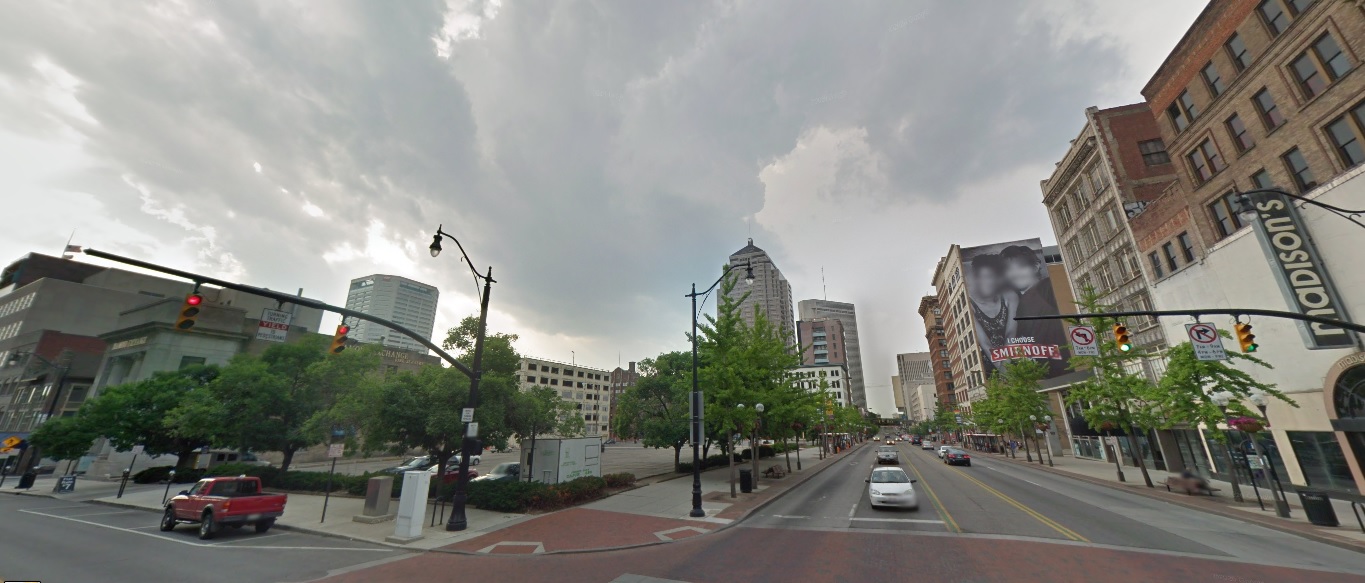
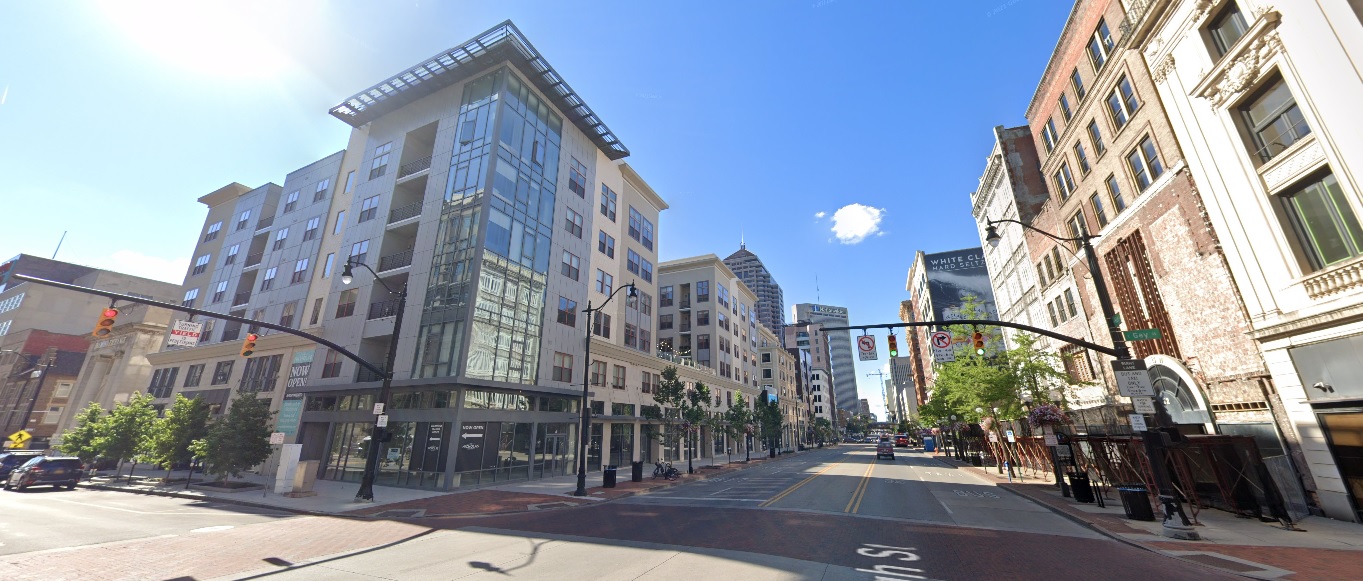
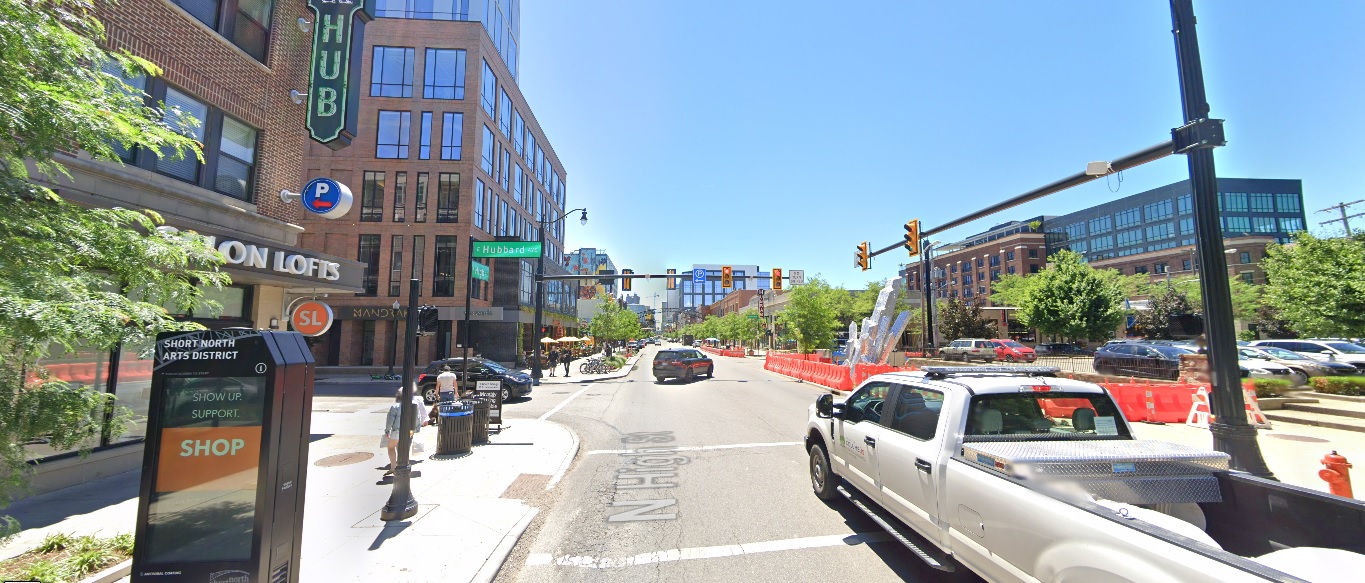
Downtown High Street, looking north from Rich Street Before: 2011 After: 2021 High Street, looking north from Gay Street Before: 2011 After: 2021
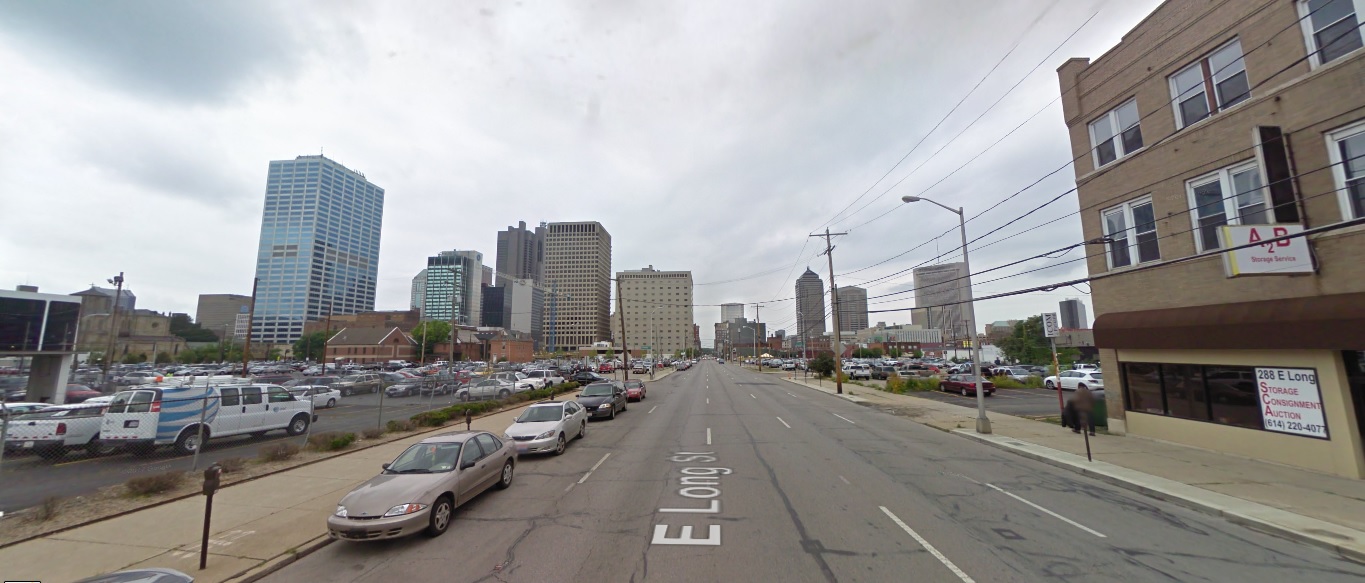
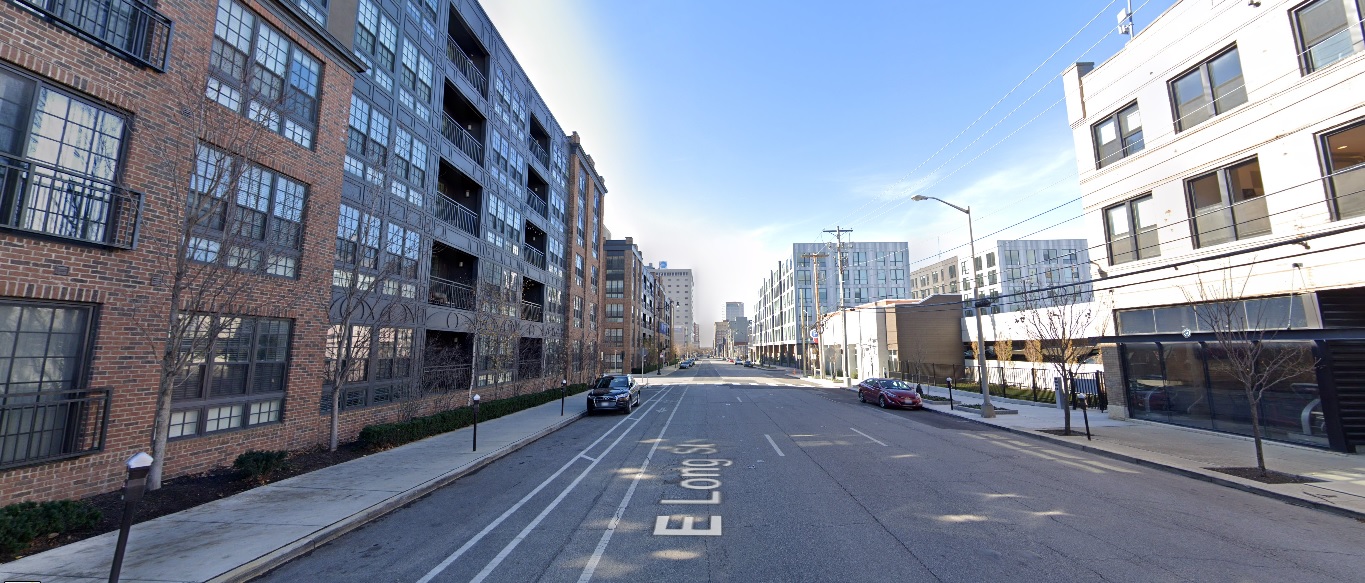
Long Street, looking east from 6th Street Before: 2011 After: 2020
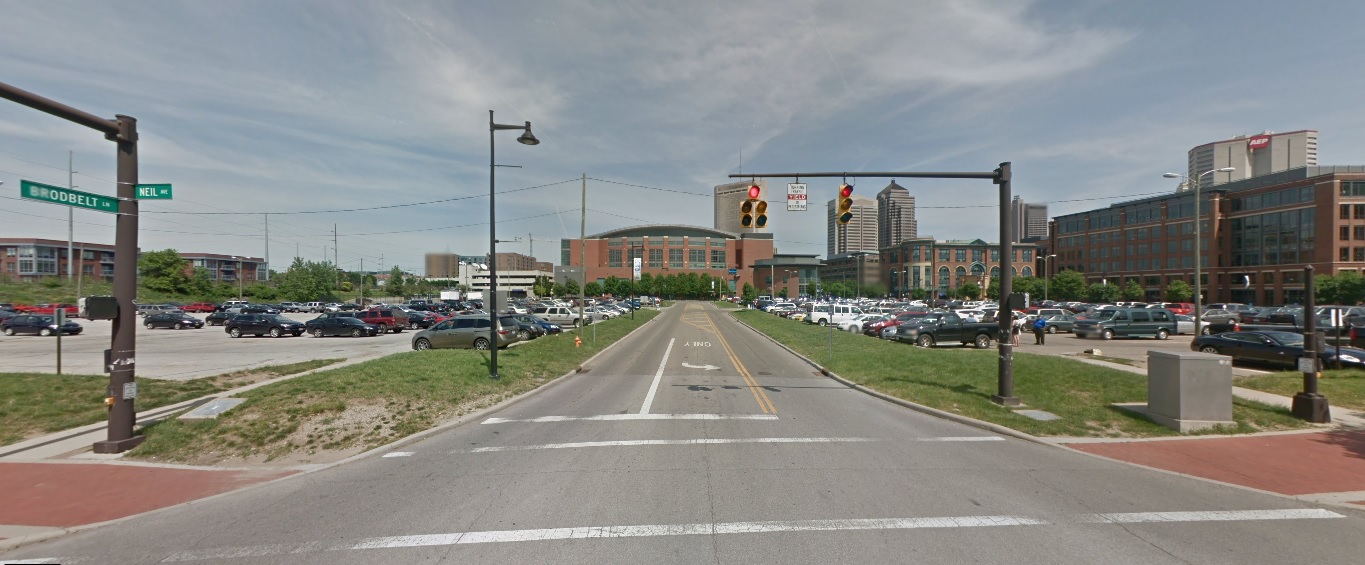
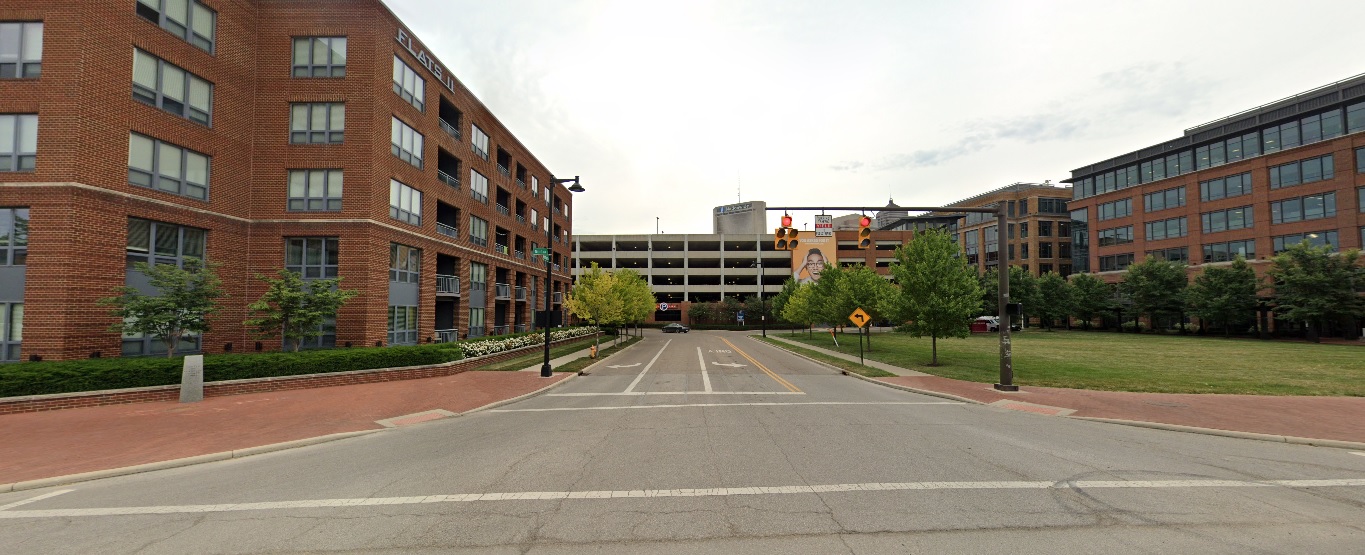
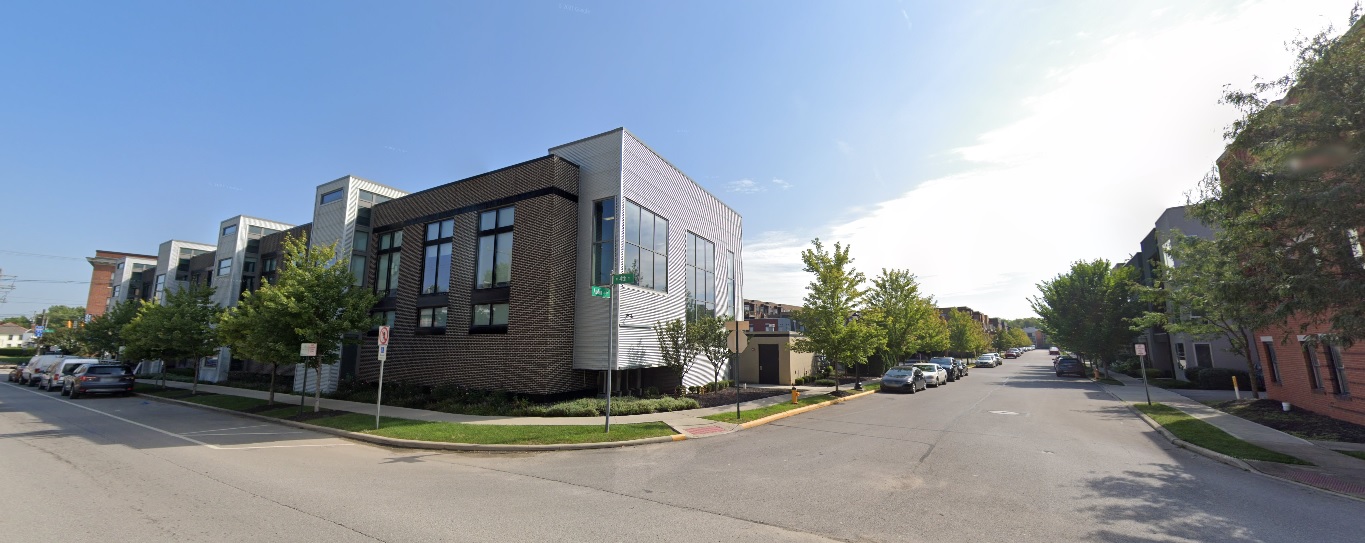
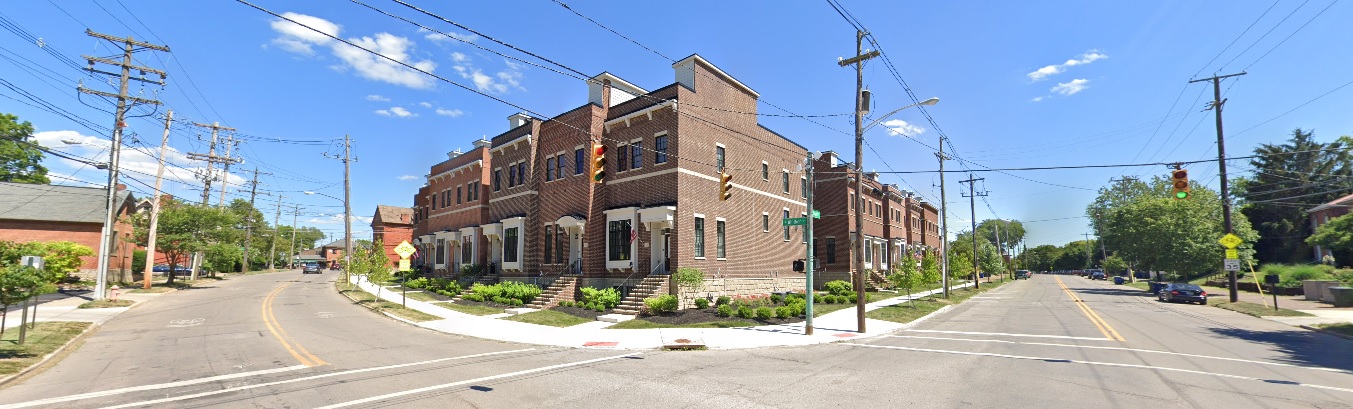
Neil Avenue, looking east at Broadbelt Lane Before: 2011 After: 2021
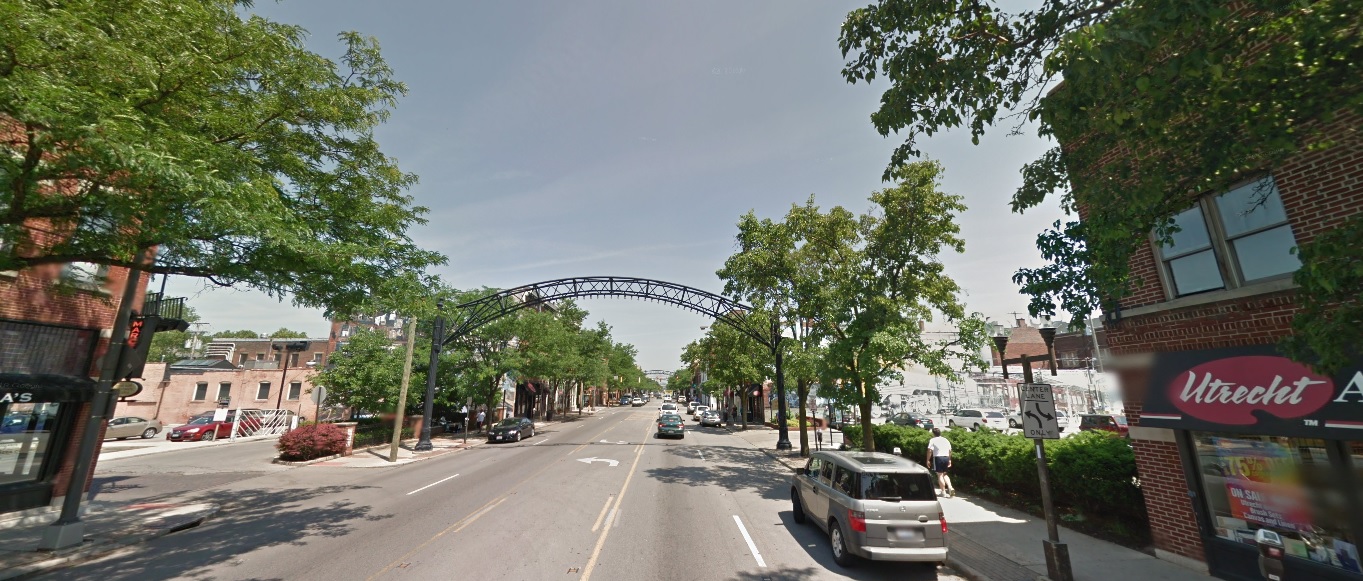
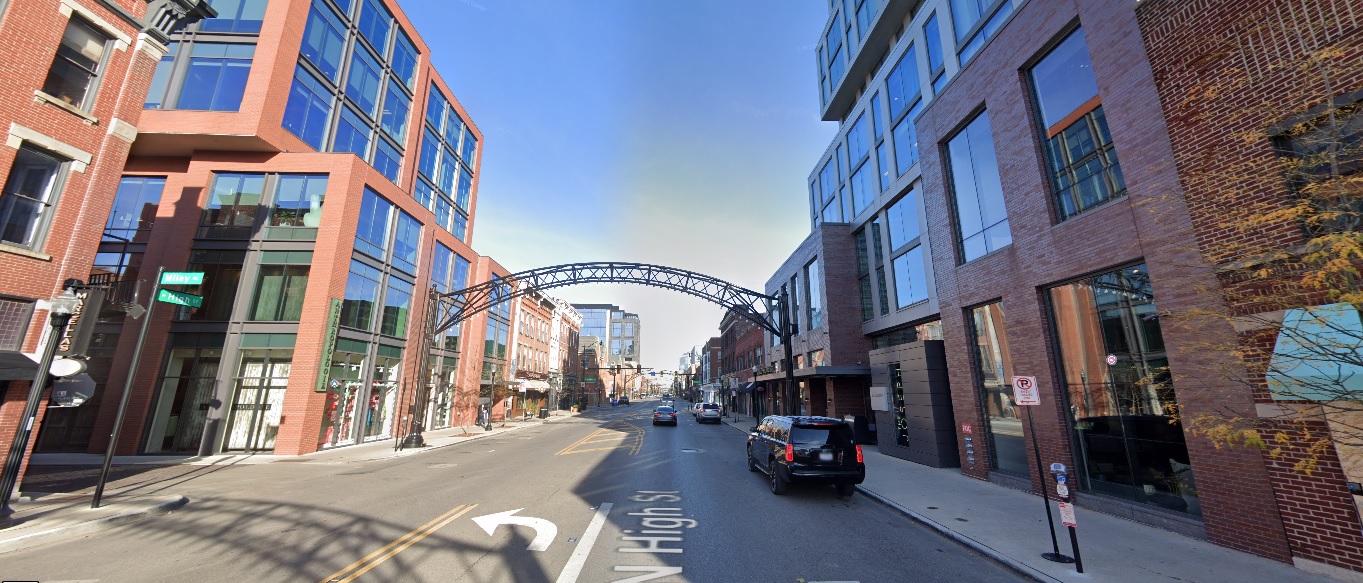
The Short North High Street, looking north from Milay Alley Before: 2011 After: 2020
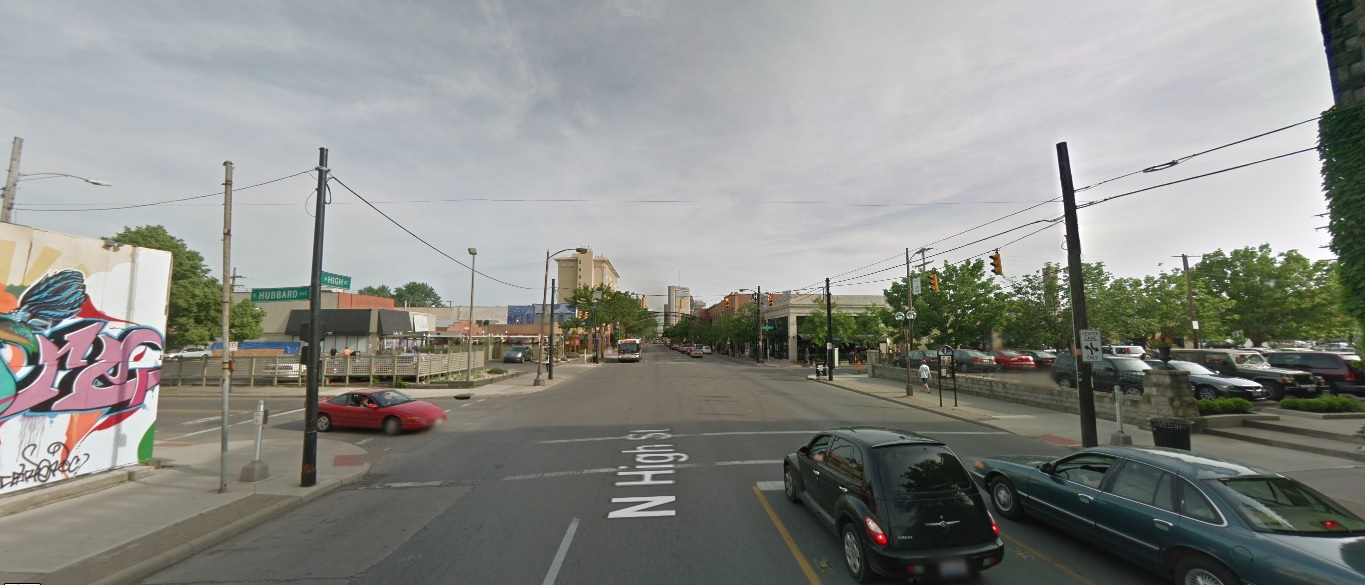
High Street, looking south from Buttles Avenue Before: 2011 After: 2021
Fourth Street, looking east at Auden Avenue Before: 2011 Before: 2021
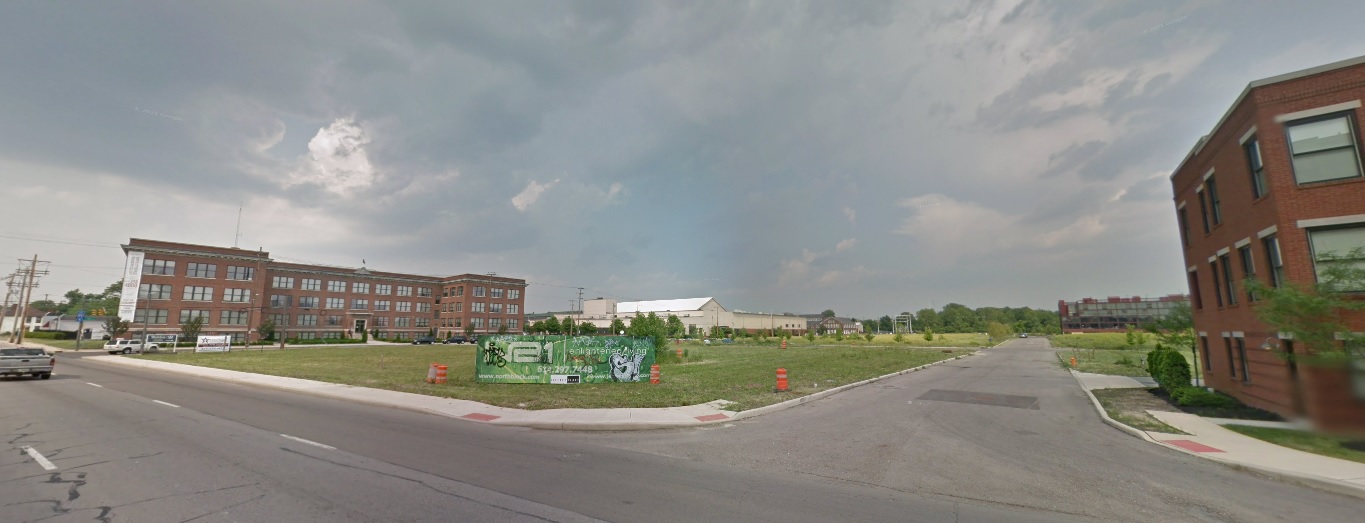
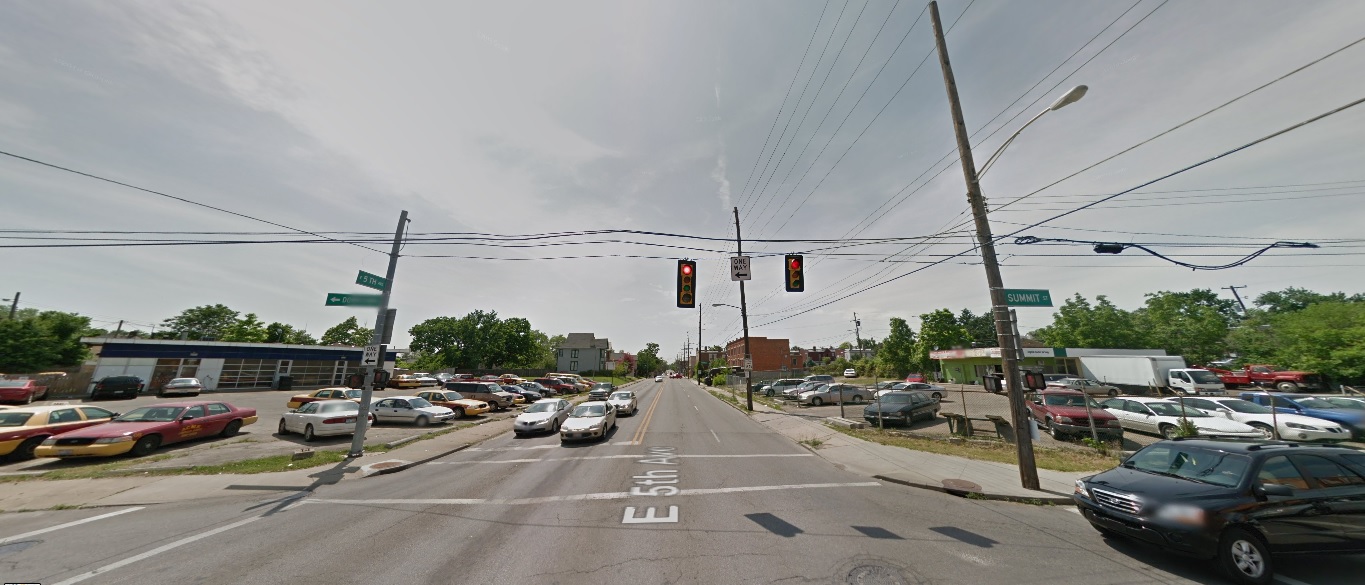
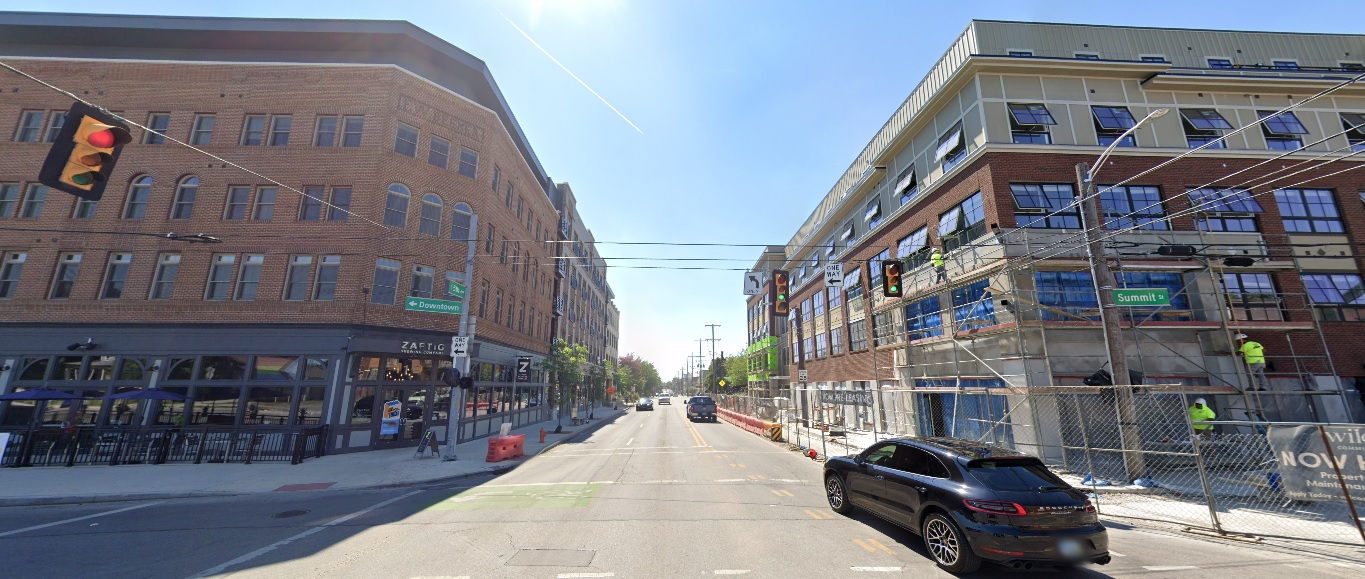
Summit Street, looking west at 5th Avenue Before: 2011 After: 2021
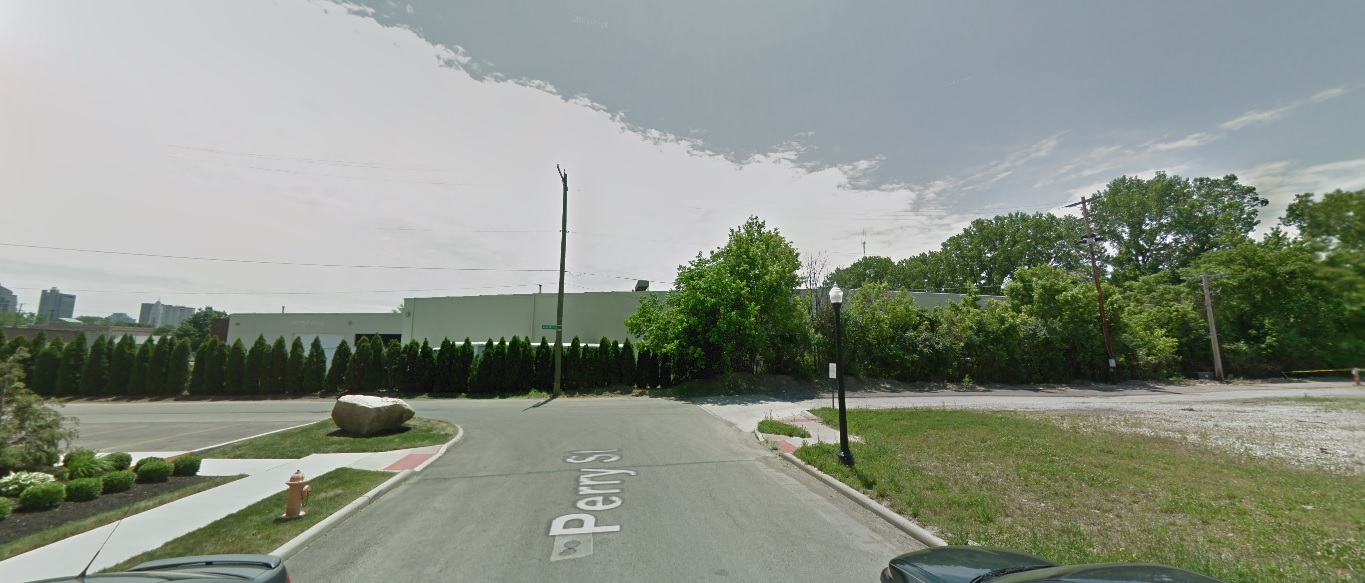
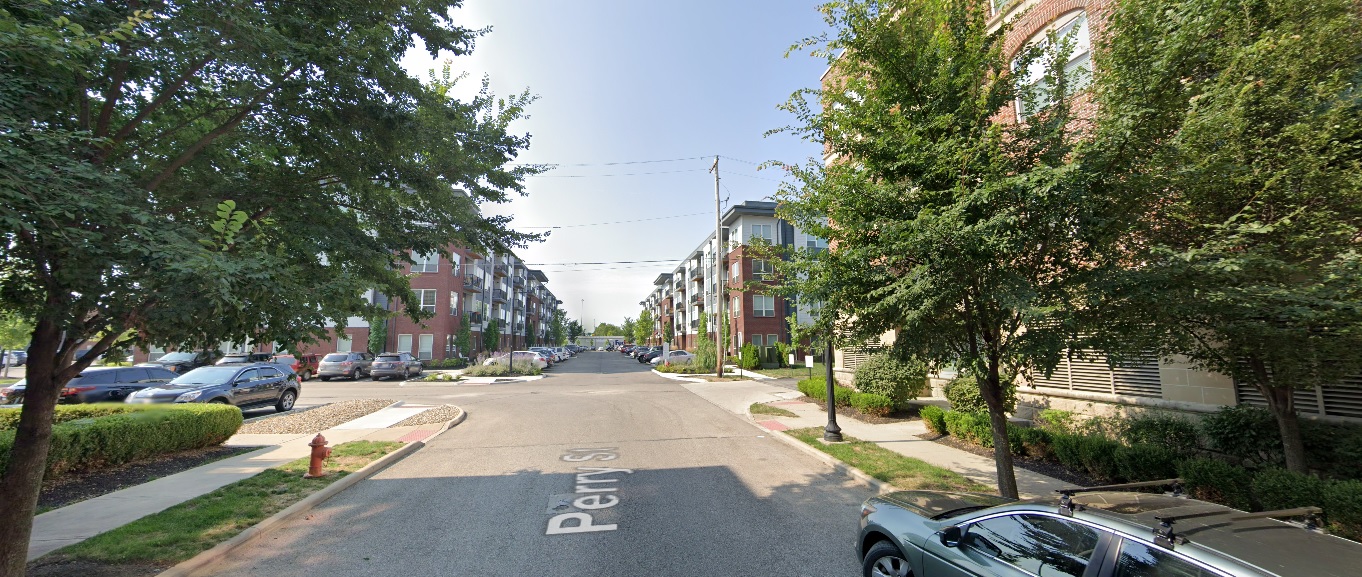
Perry Street, looking south at Quality Place Before: 2011 After: 2021
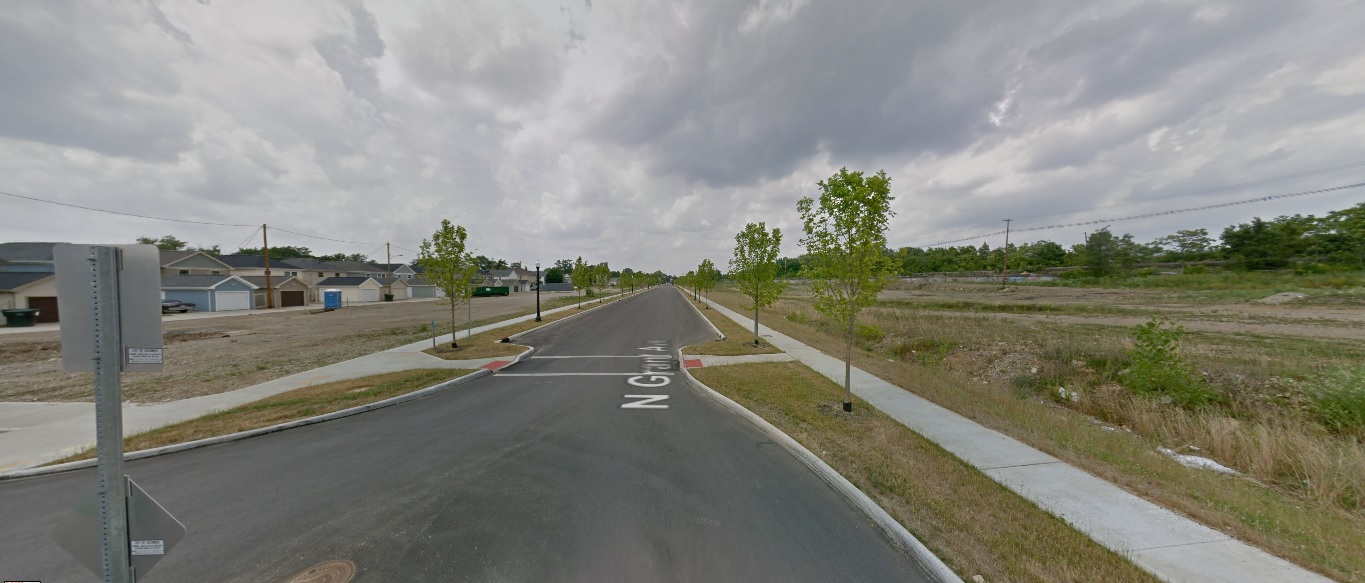
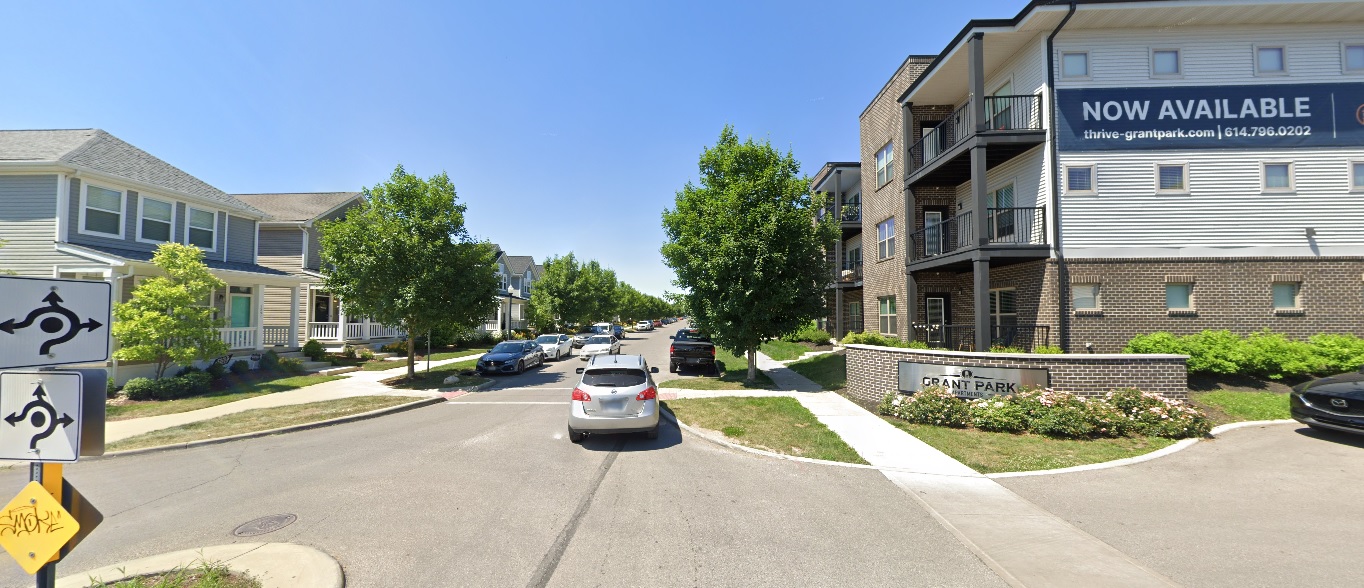
Weinland Park Grant Avenue, looking north from 7th Avenue Before: 2012 After: 2021
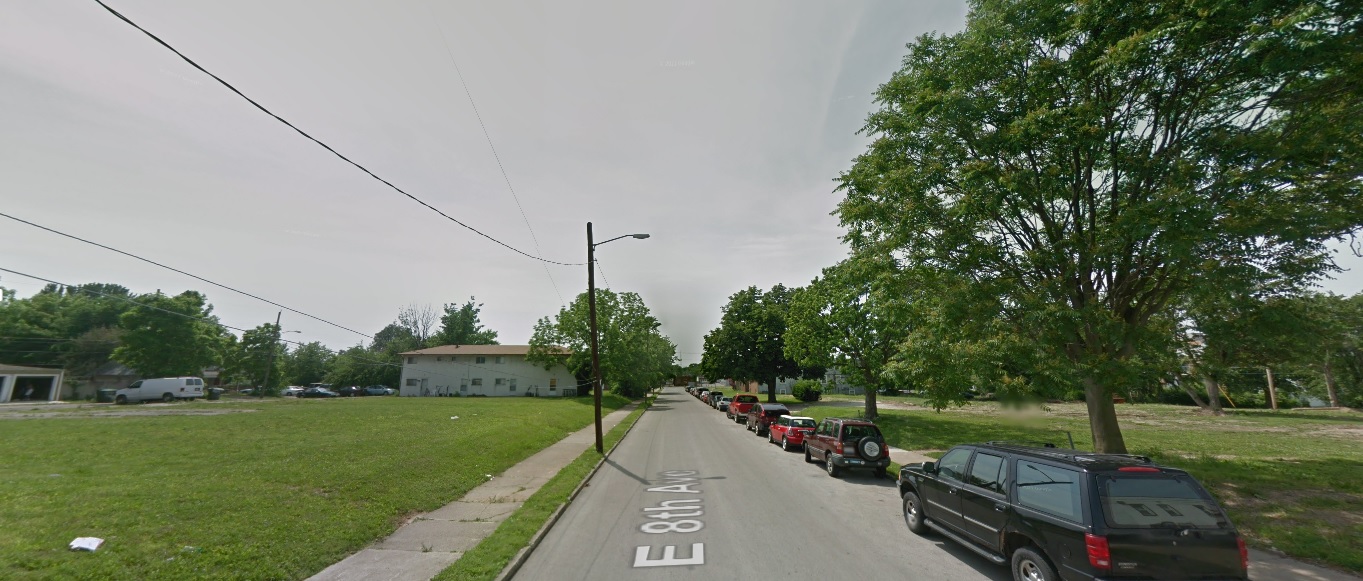
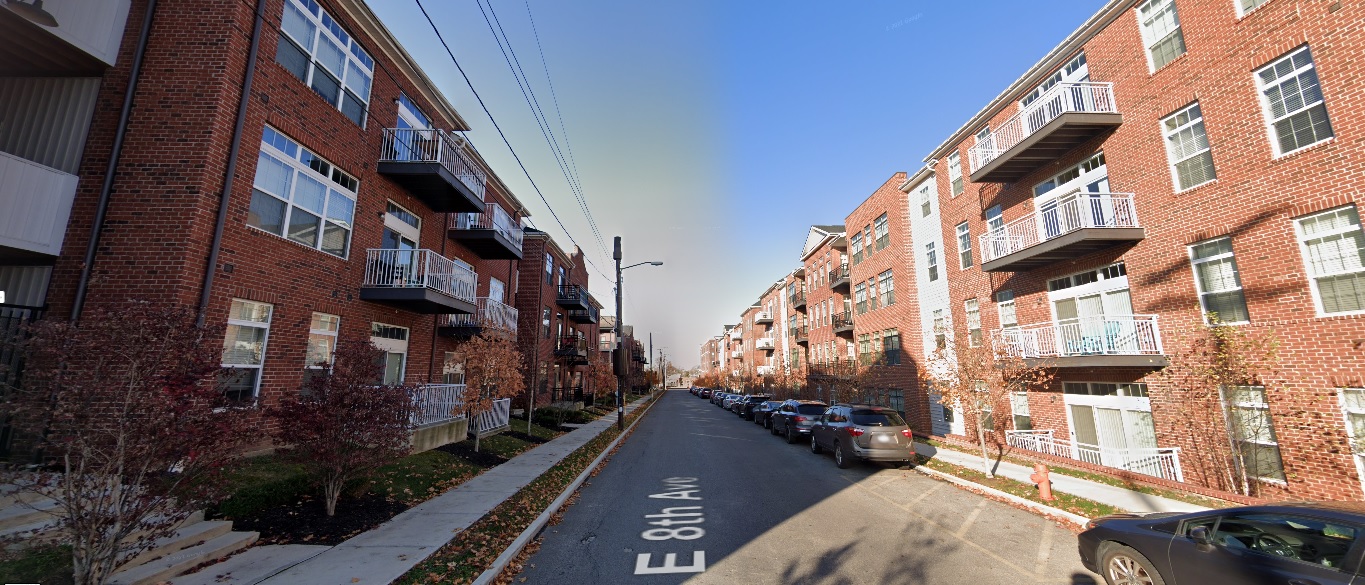
Eighth Avenue, looking west from Section Alley Before: 2011 After: 2020
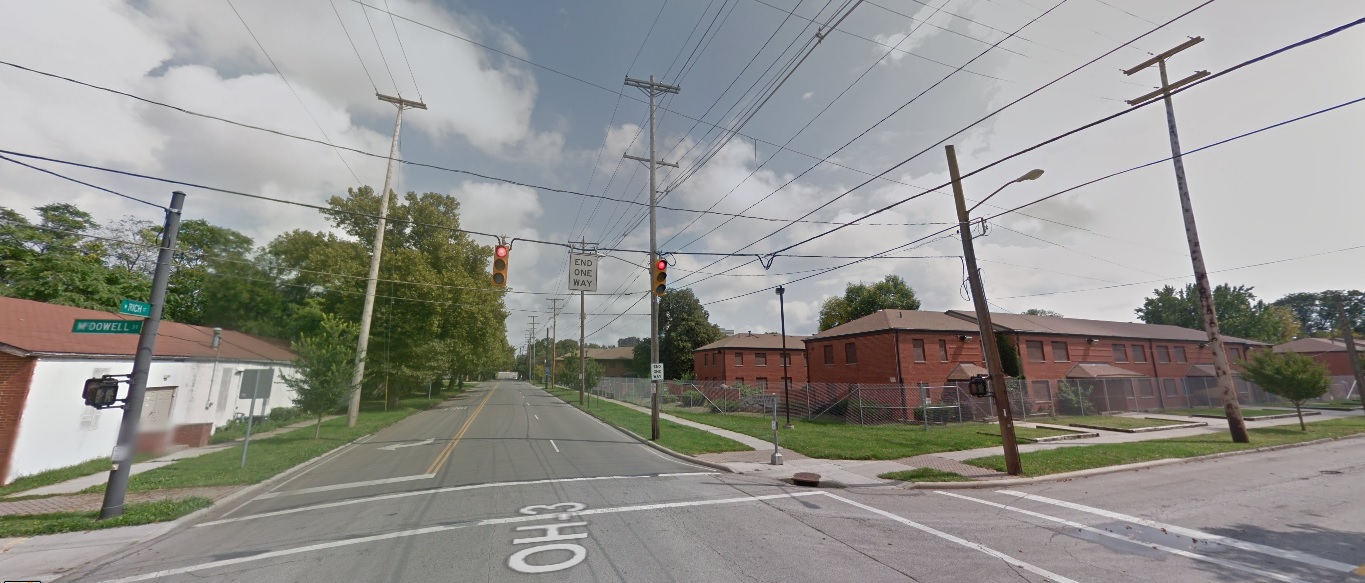
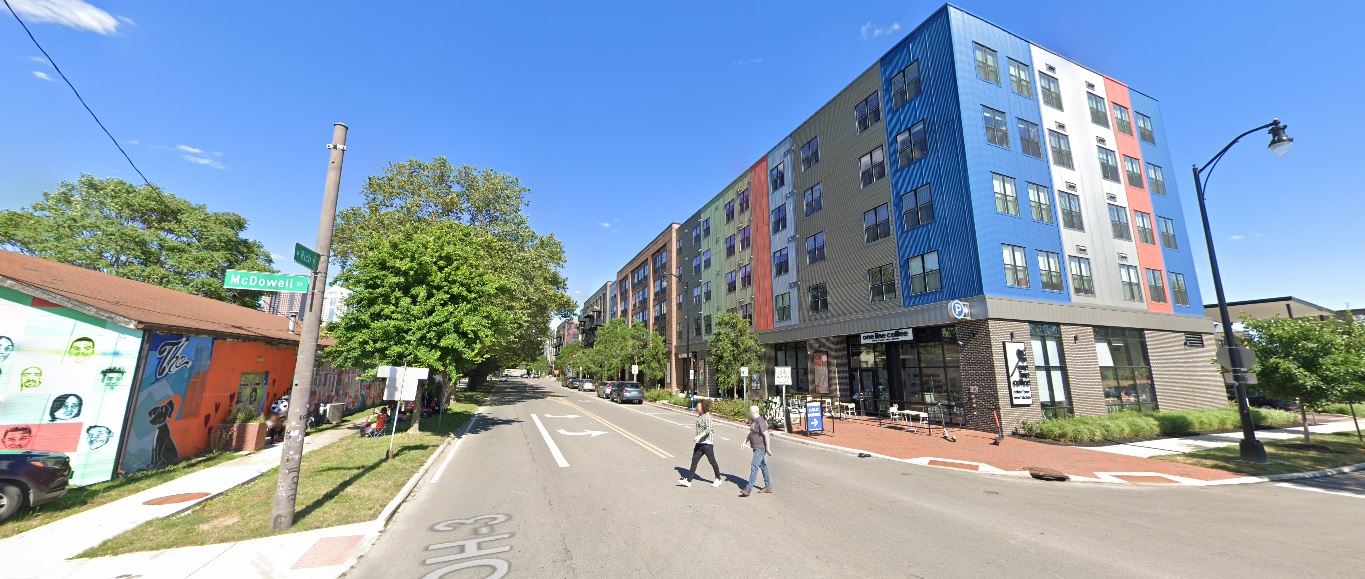
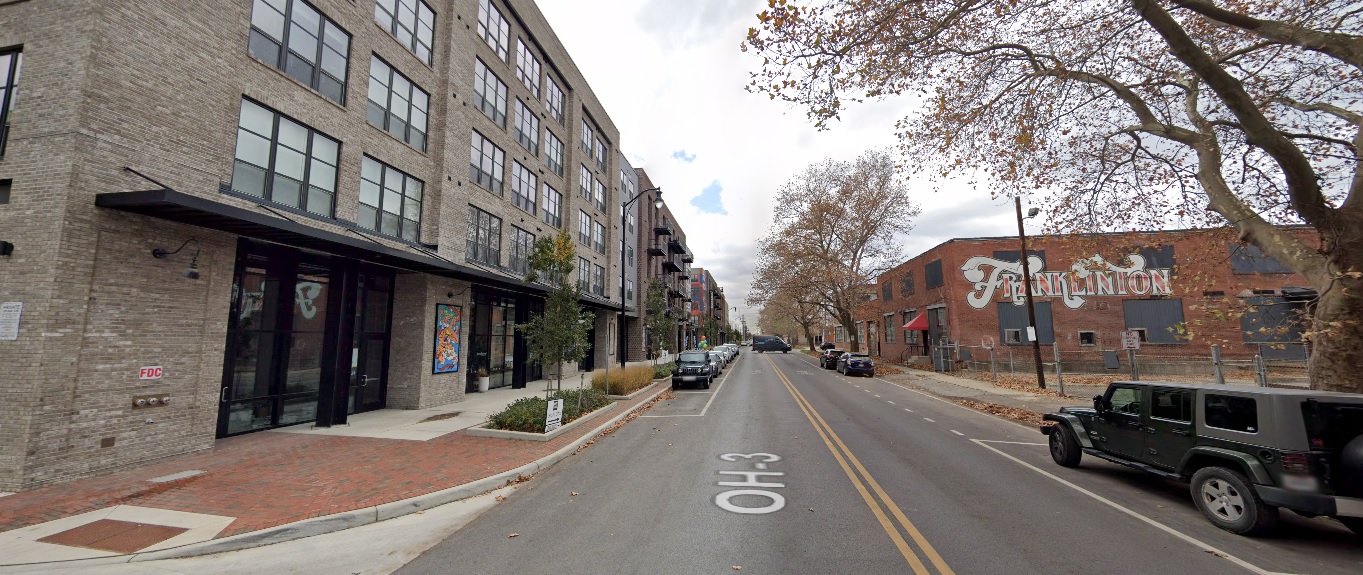
Franklinton Rich Street, looking east from McDowell Street Before: 2011 After: 2021
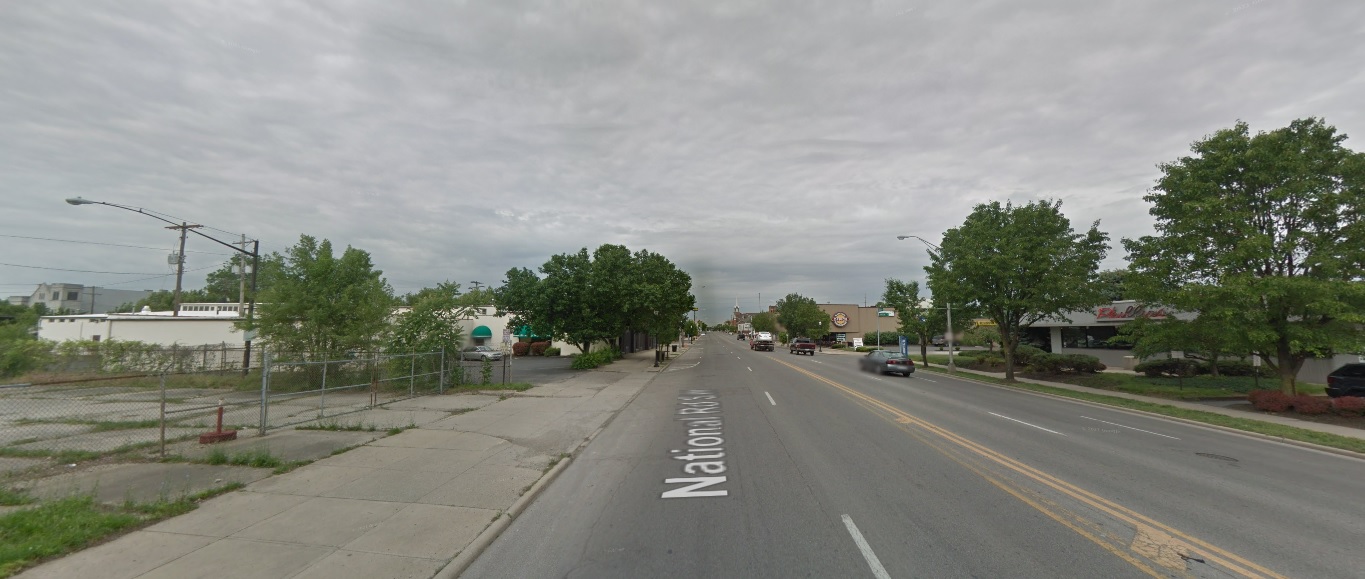
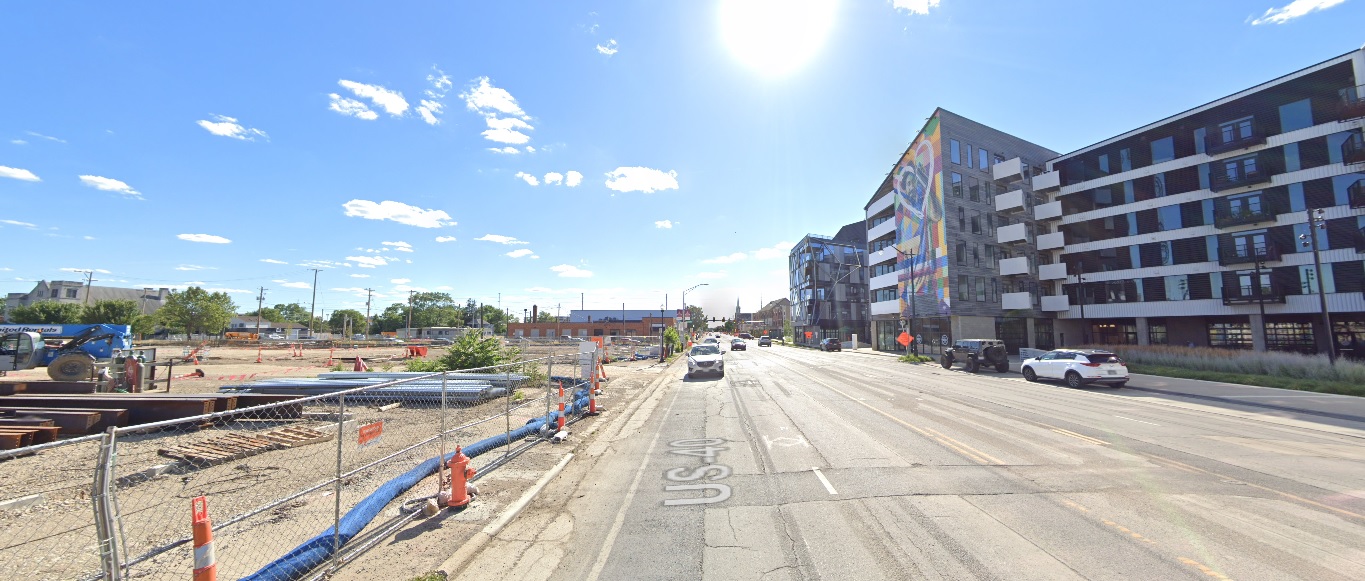
Broad Street, looking west from the railroad tracks. Before: 2011 After: 2021
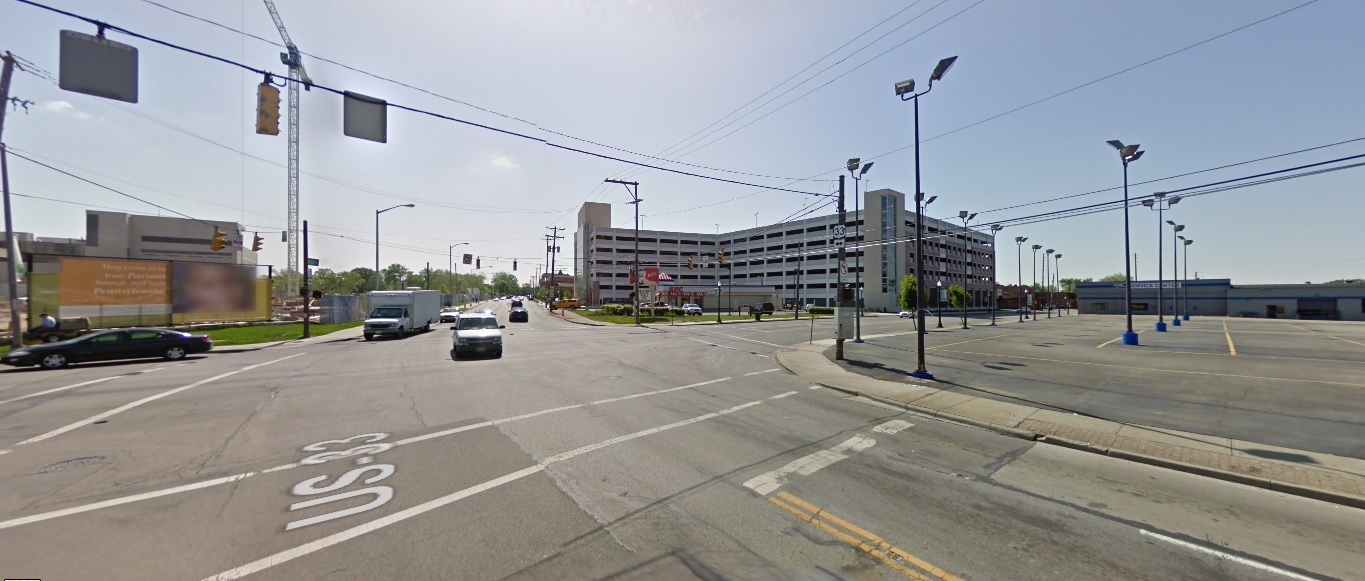
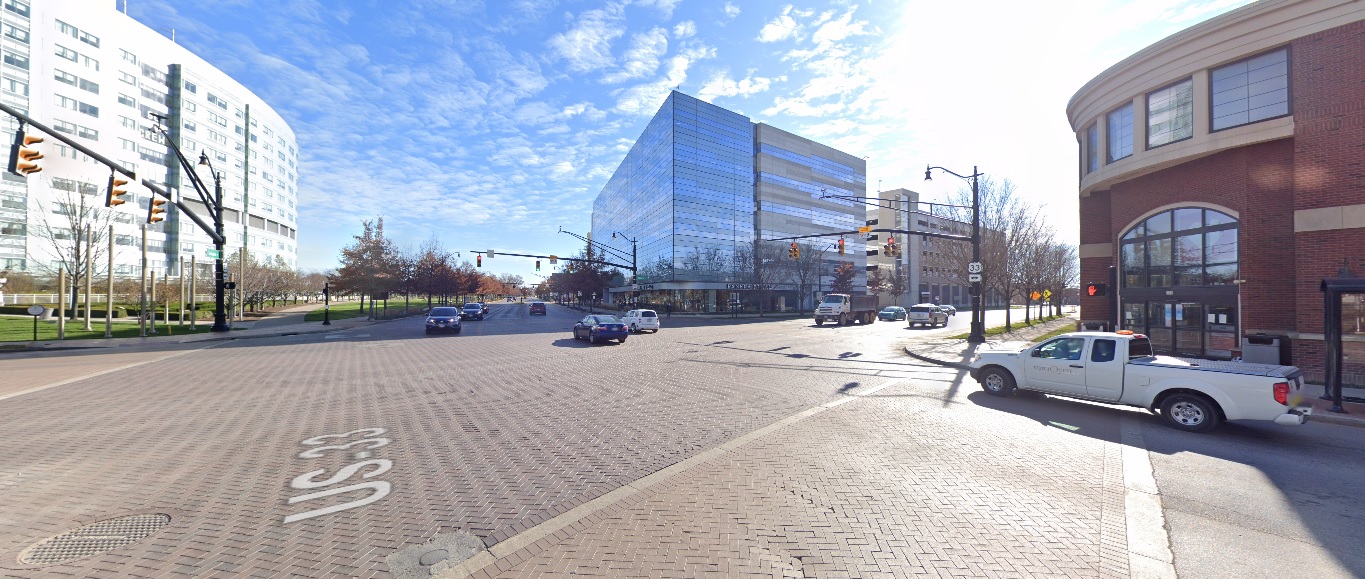
South Side Livingston Avenue, looking east at Parsons Avenue Before: 2009 After: 2020
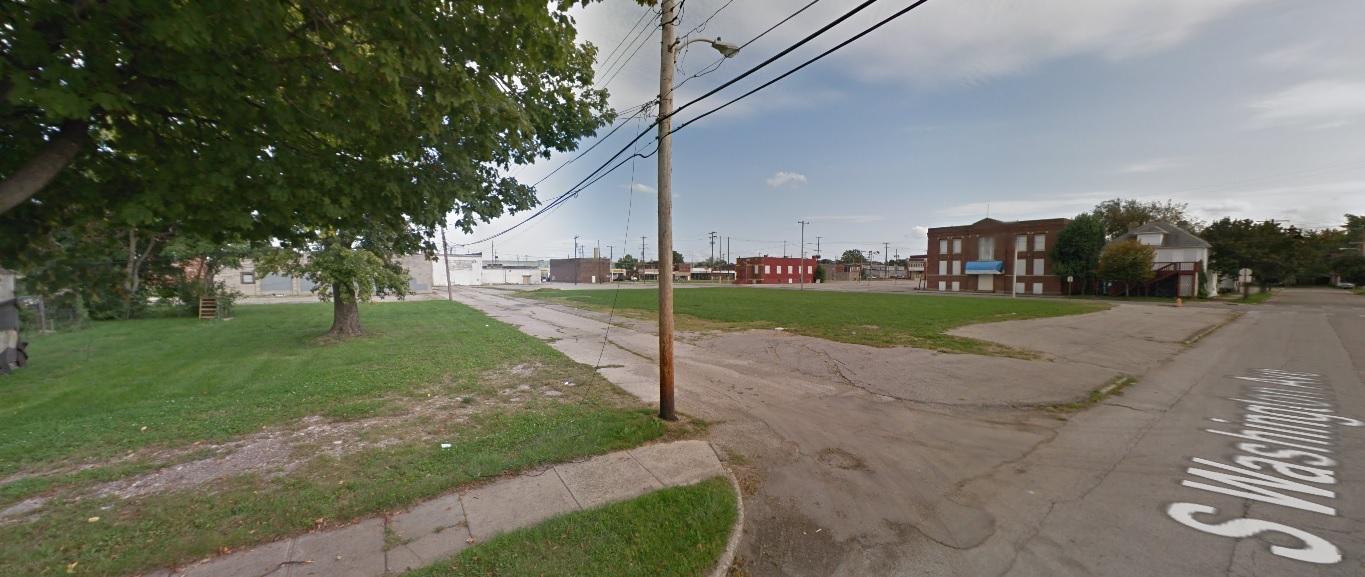
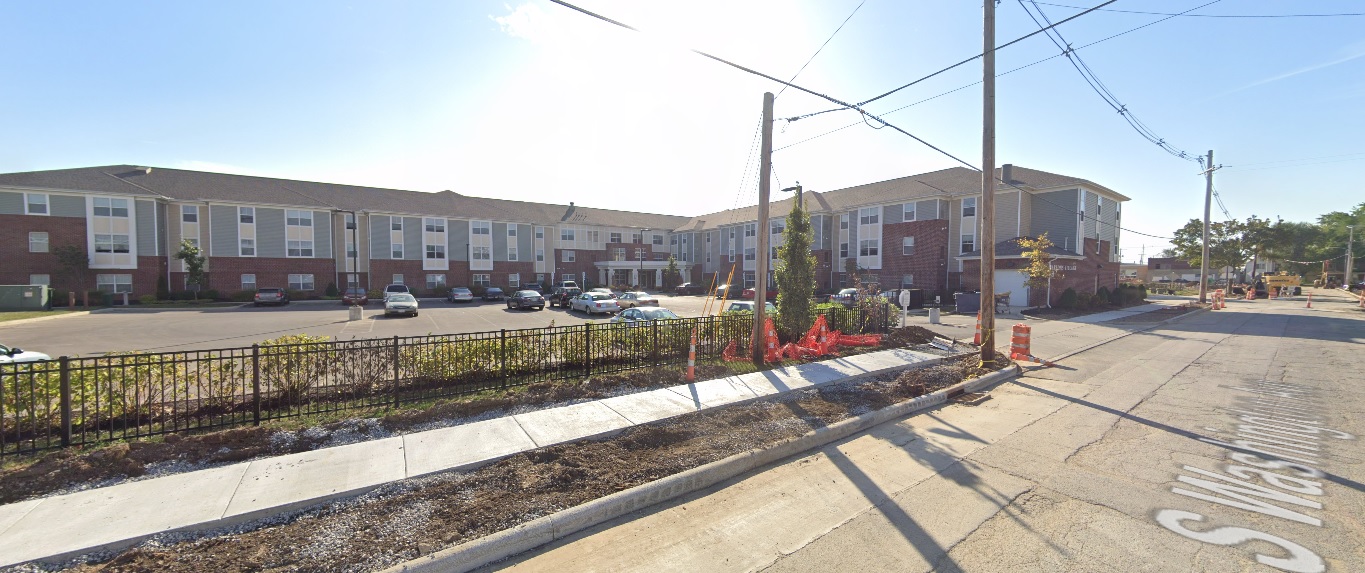
Washington Avenue, looking southeast from Innis Avenue Before: 2011 After: 2020
Front Street, looking south at Whittier Street Before: 2011 After: 2021
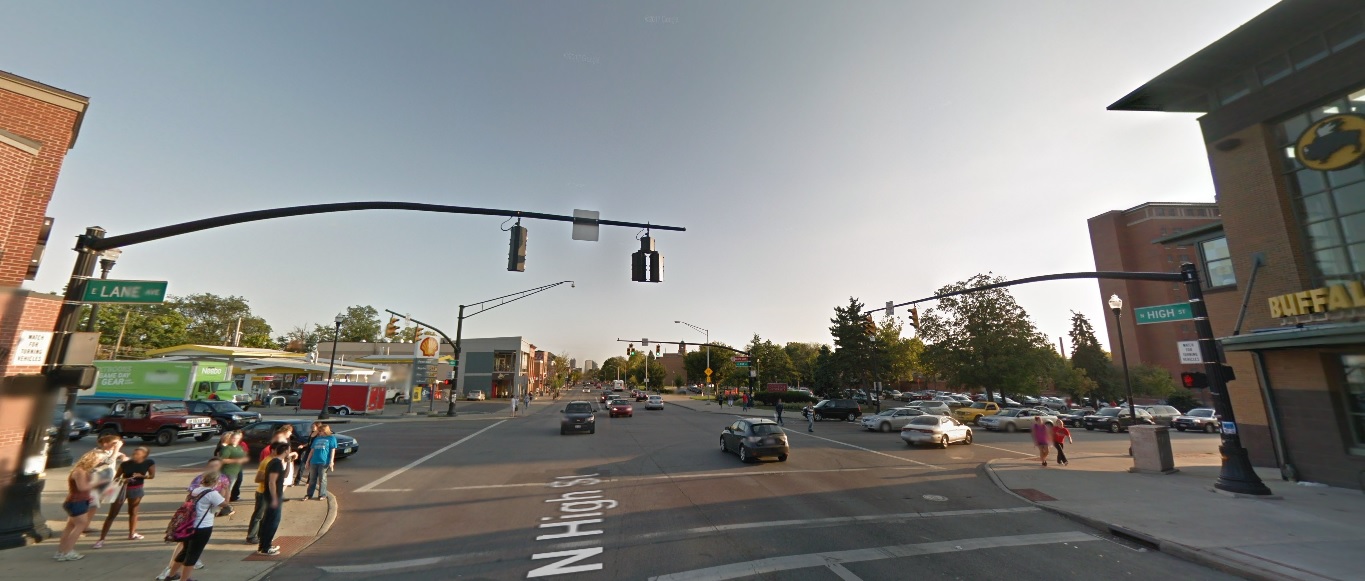
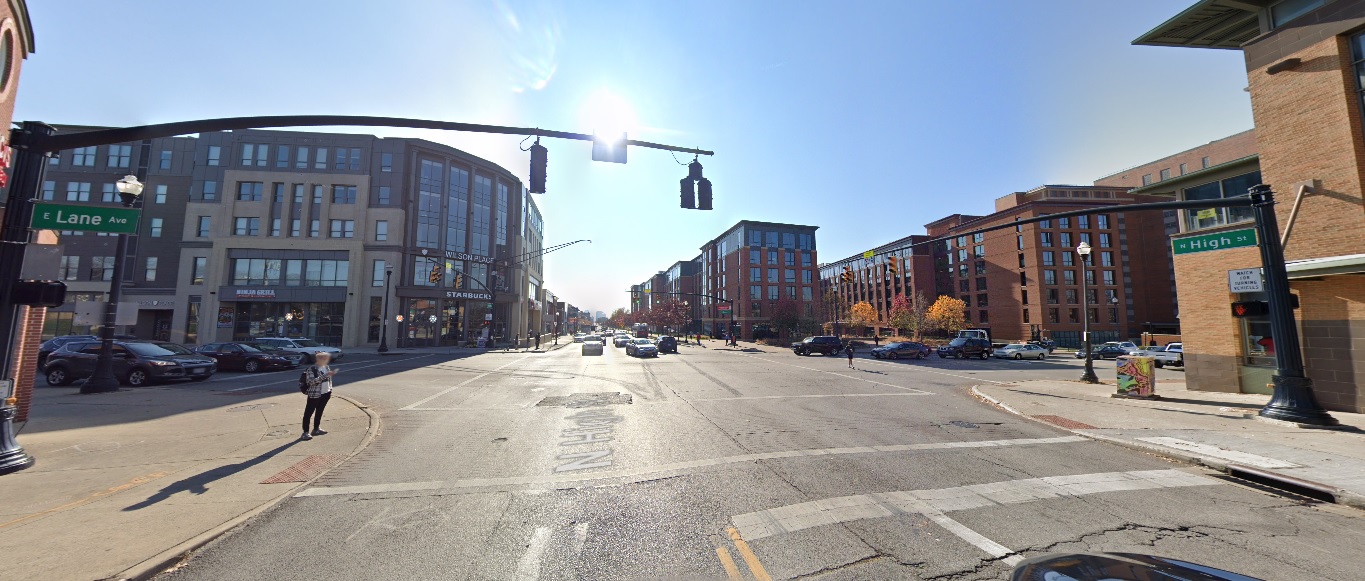
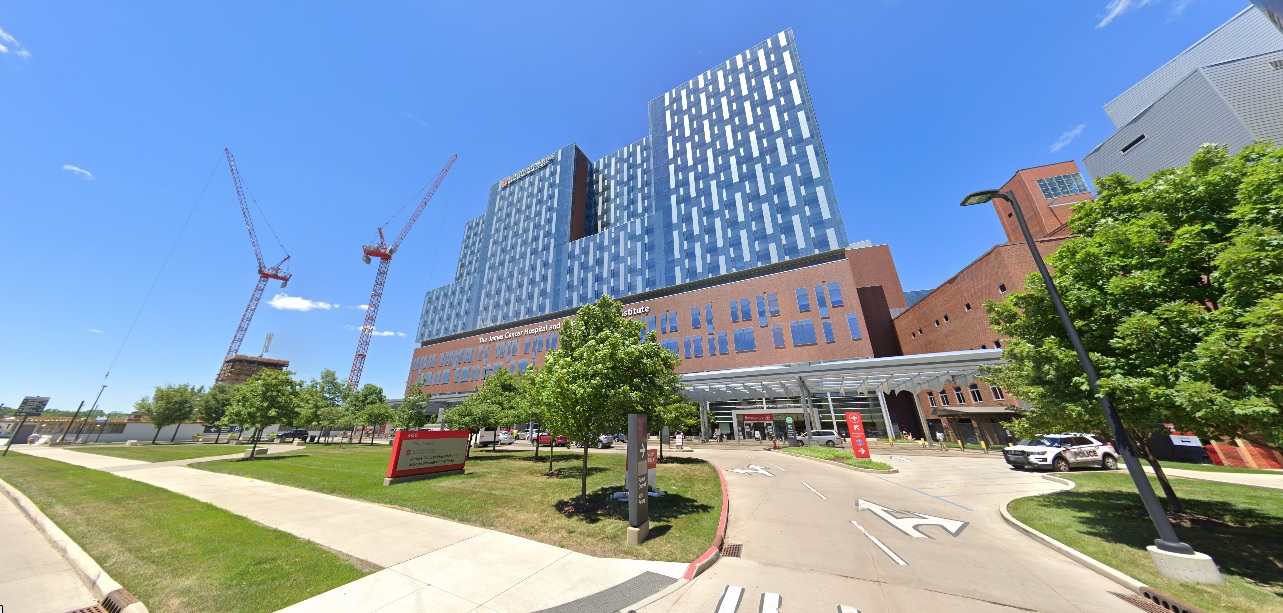
Campus High Street, looking south from Lane Avenue Before: 2011 After: 2020
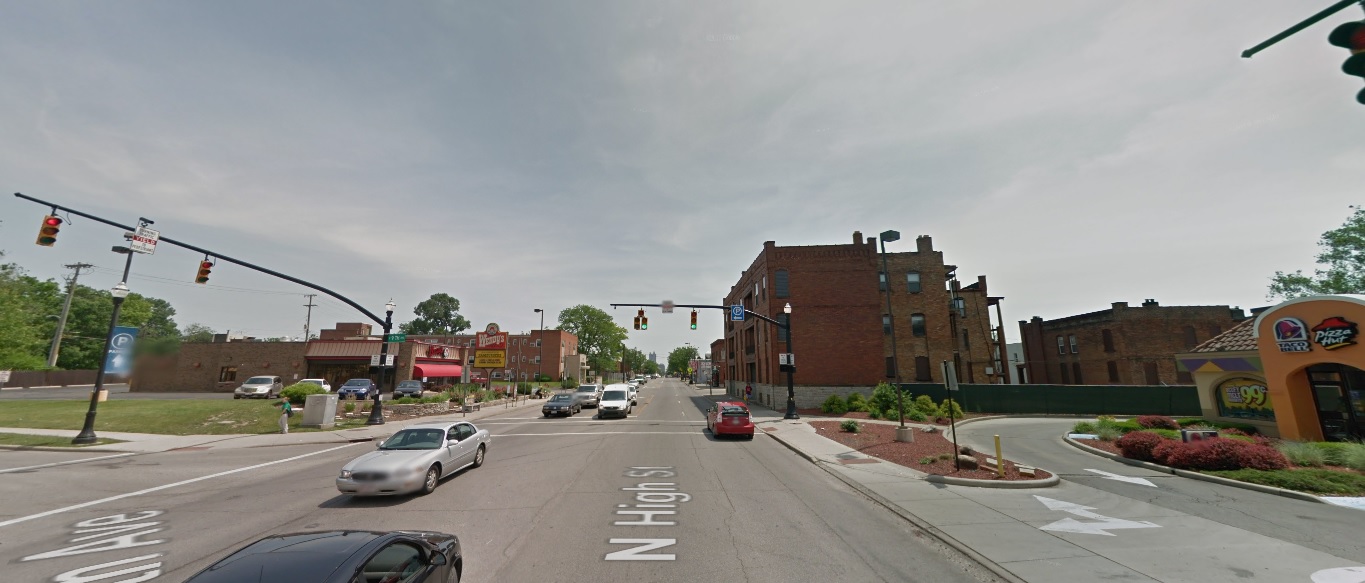
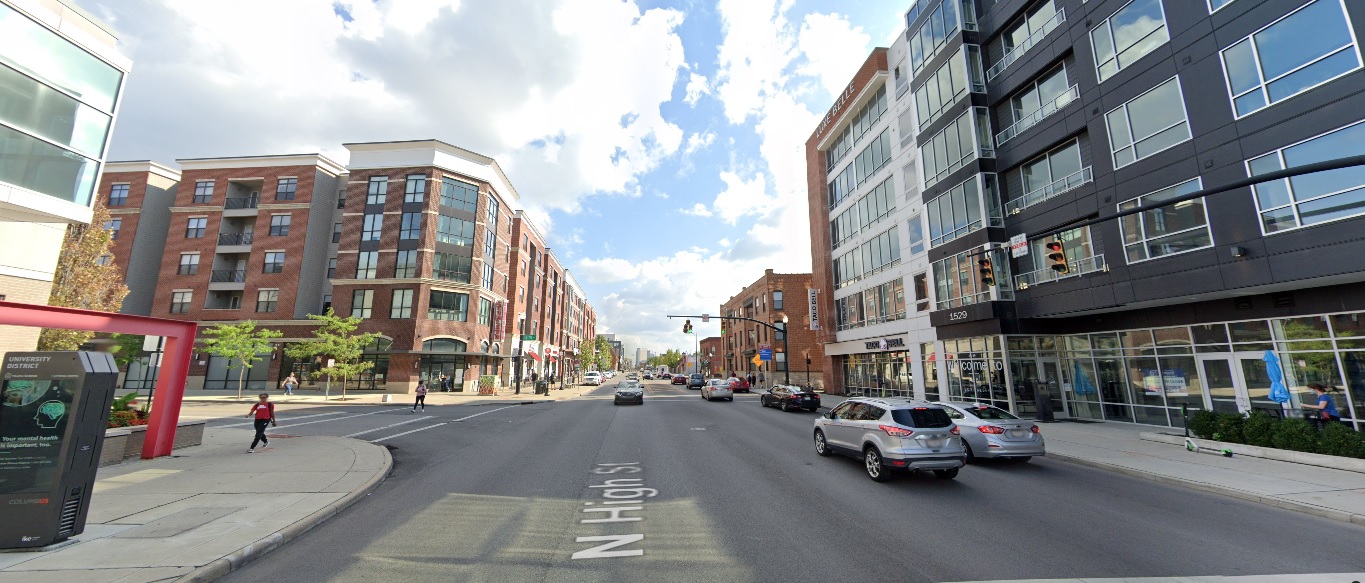
High Street, looking south from 8th Avenue Before: 2011 After: 2021
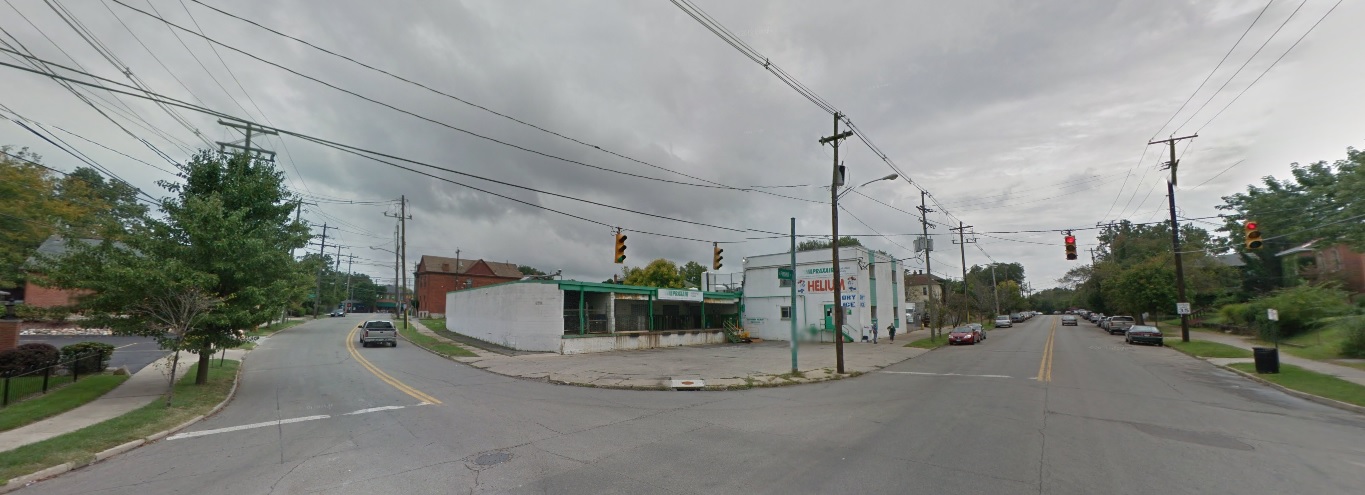
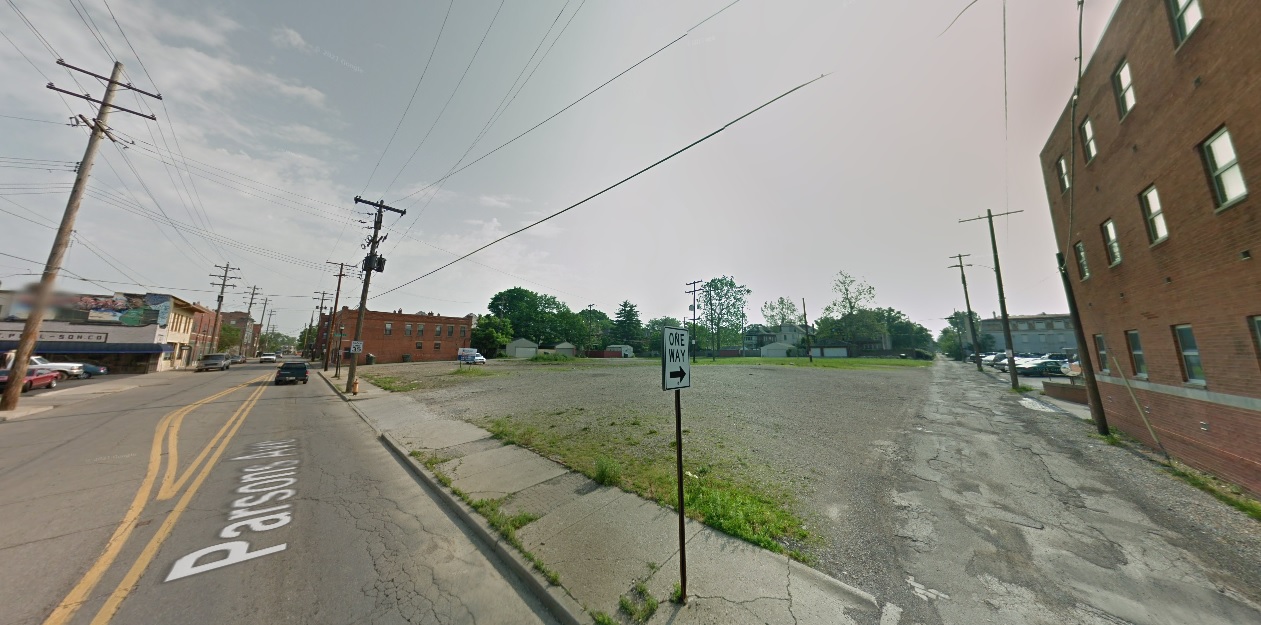
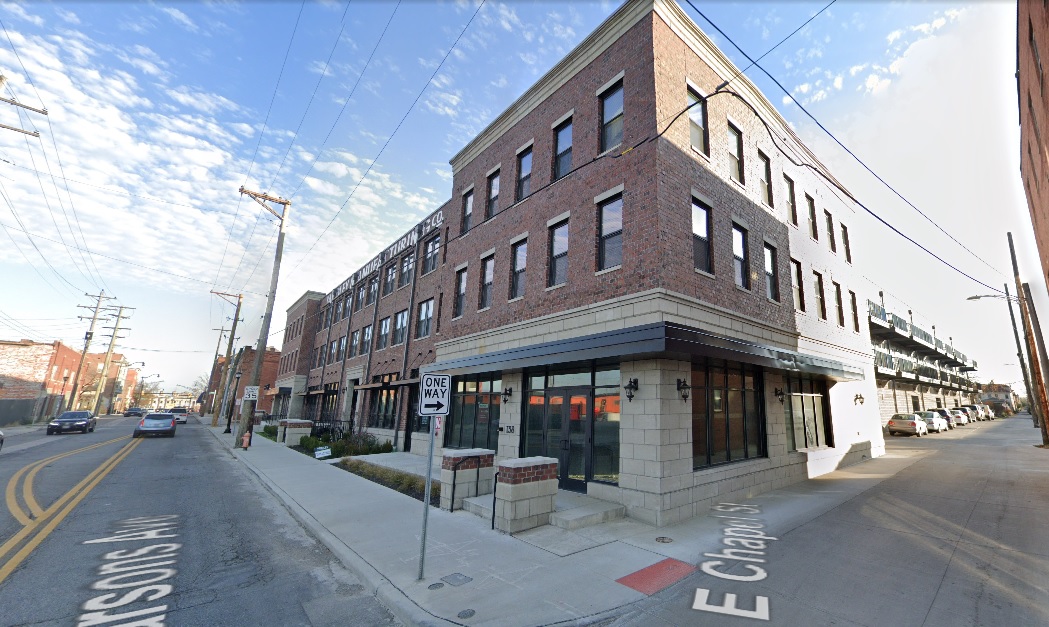
West Side Parsons Avenue, looking northeast from Chapel Street Before: 2011 After: 2020
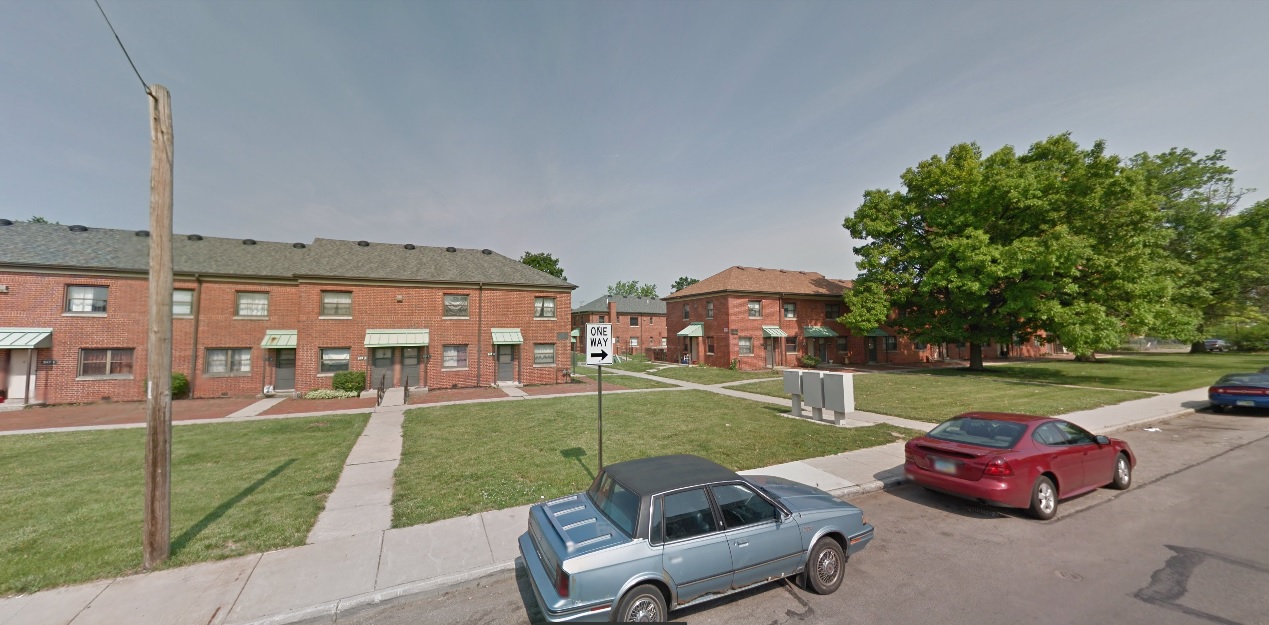
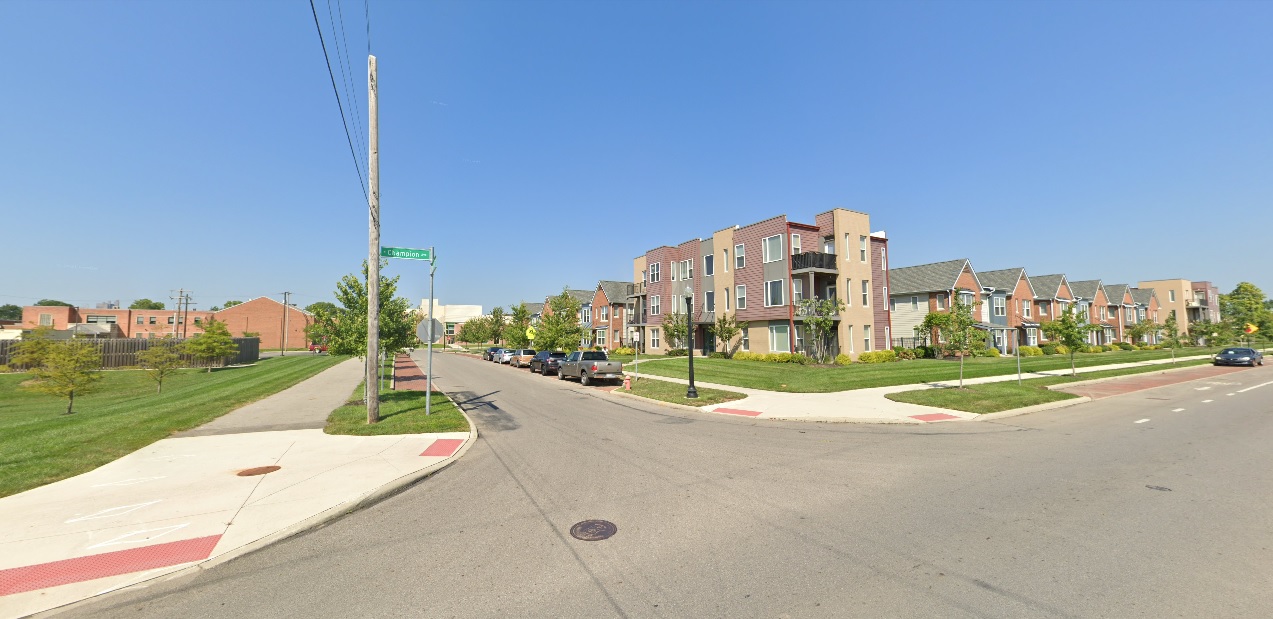
Champion Avenue, looking northwest at Phale D. Hale Drive Before: 2011 After: 2021
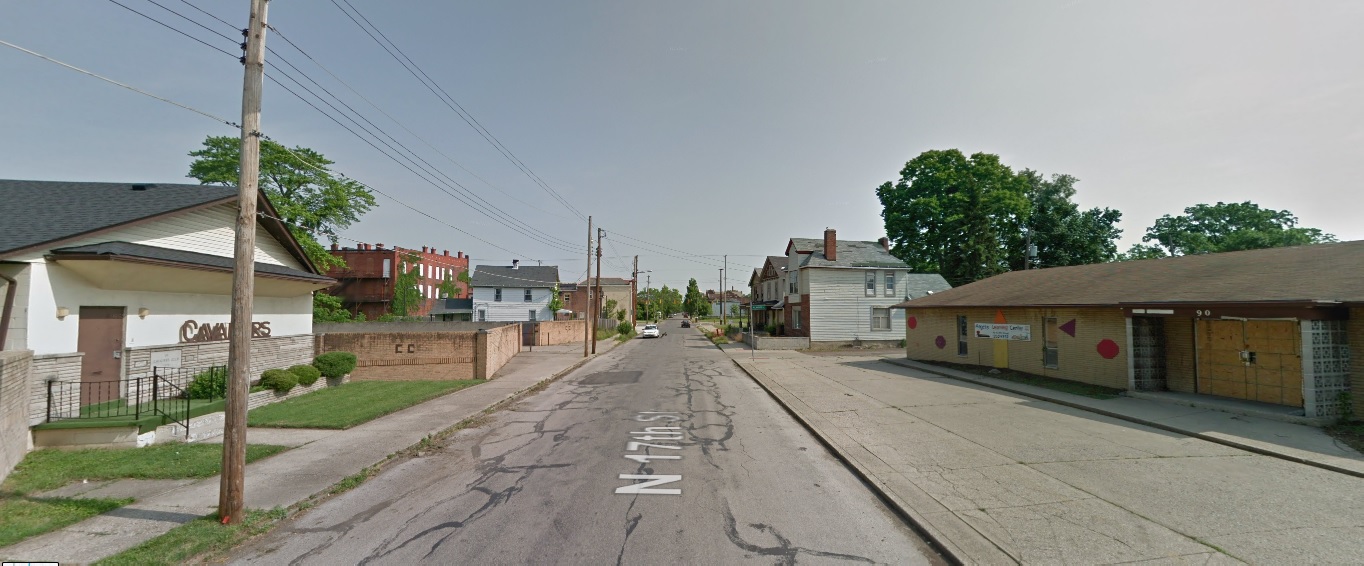
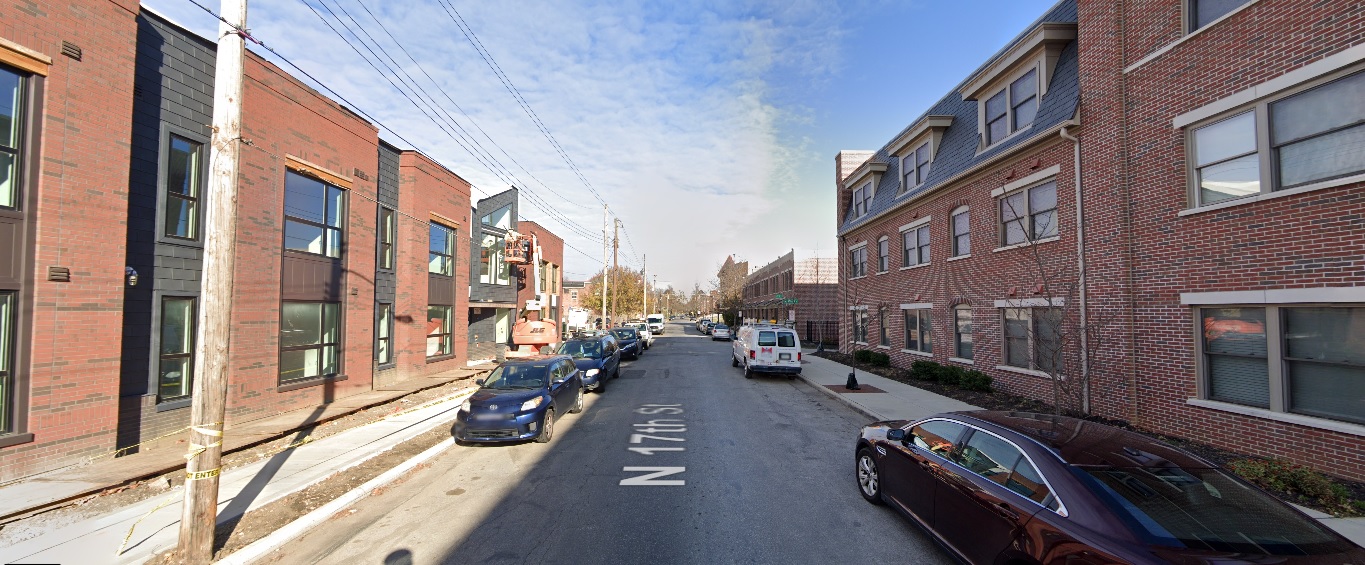
17th Avenue, looking north from Gay Street Before: 2011 After: 2020
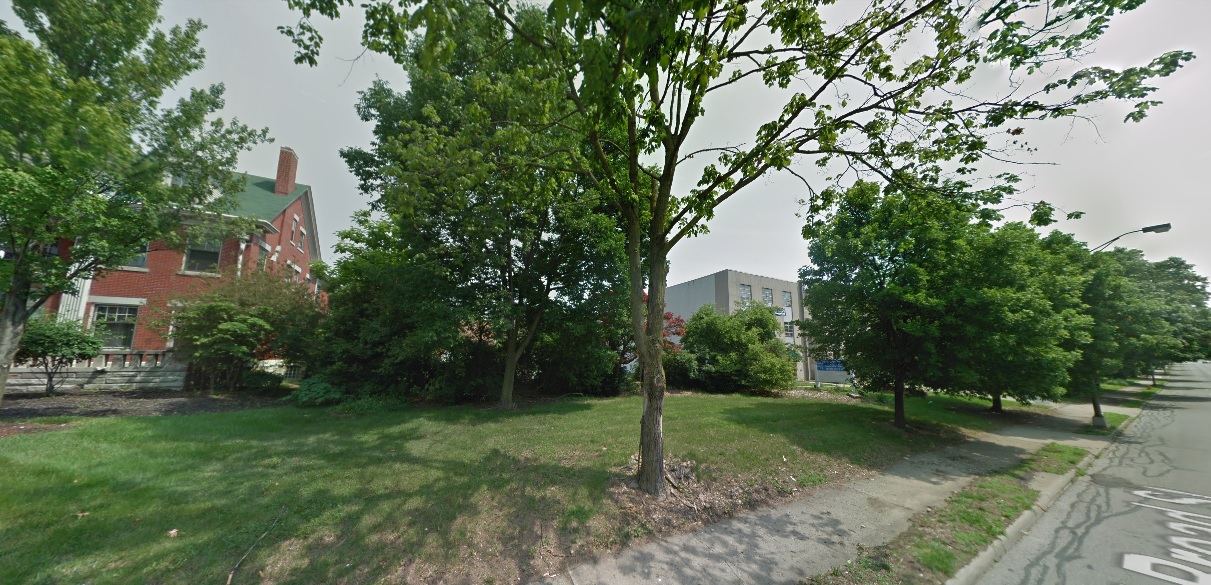
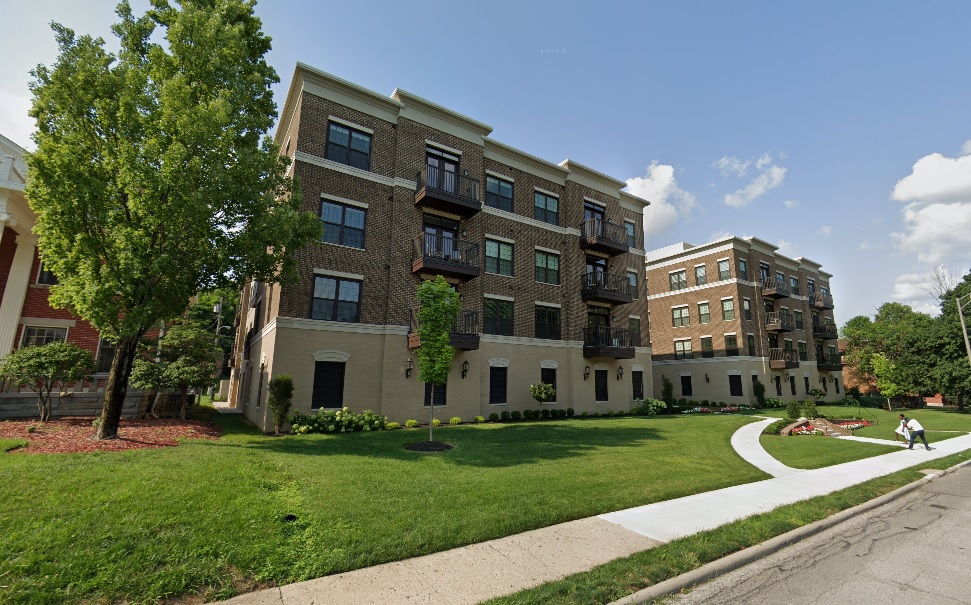
Broad Street, looking northeast west of Woodland Avenue Before: 2011 After: 2021
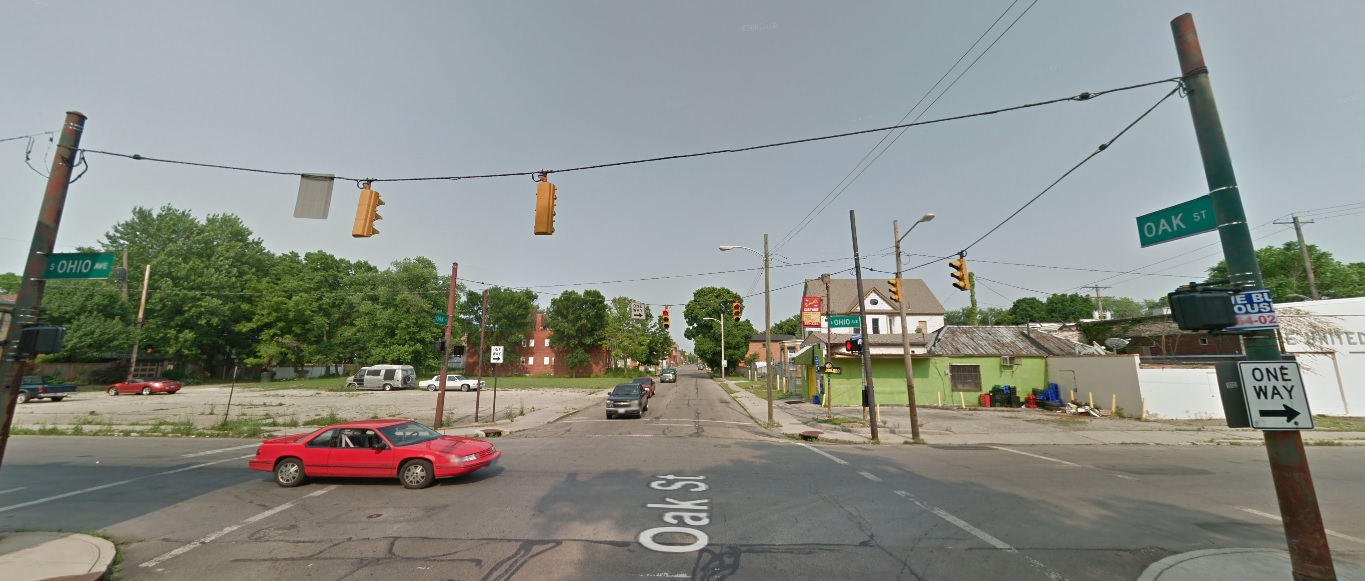
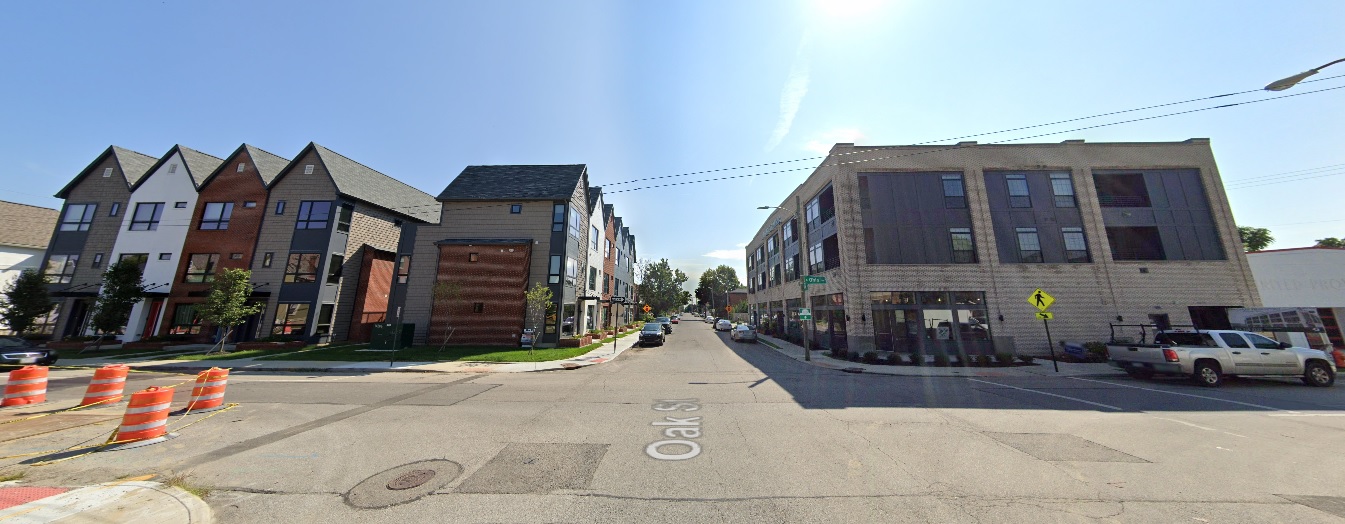
Oak Street, looking east from Ohio Avenue Before: 2011 After: 2021
These images represent just a small fraction of the development and changes that have occurred in and around the city, and don’t even include the large developments in suburban areas like Grandview Yard in Grandview or Bridge Park in Dublin. The next 10 years looks to be even more significant, with new mixed-use towers for Downtown, potential skyscrapers for Easton, and large numbers of infill development projects continuing in central neighborhoods from Franklinton to Linden to the South Side. With them, the city will continue to grow more dense and more vibrant and- with any luck- will also help spur much needed change to Columbus’ underwhelming transit system.
These Columbus development links show many of the projects seen in the photos, as well as projects that are still just in the proposal stages. The City provides a master list of area development commissions to keep track of the latest proposals.
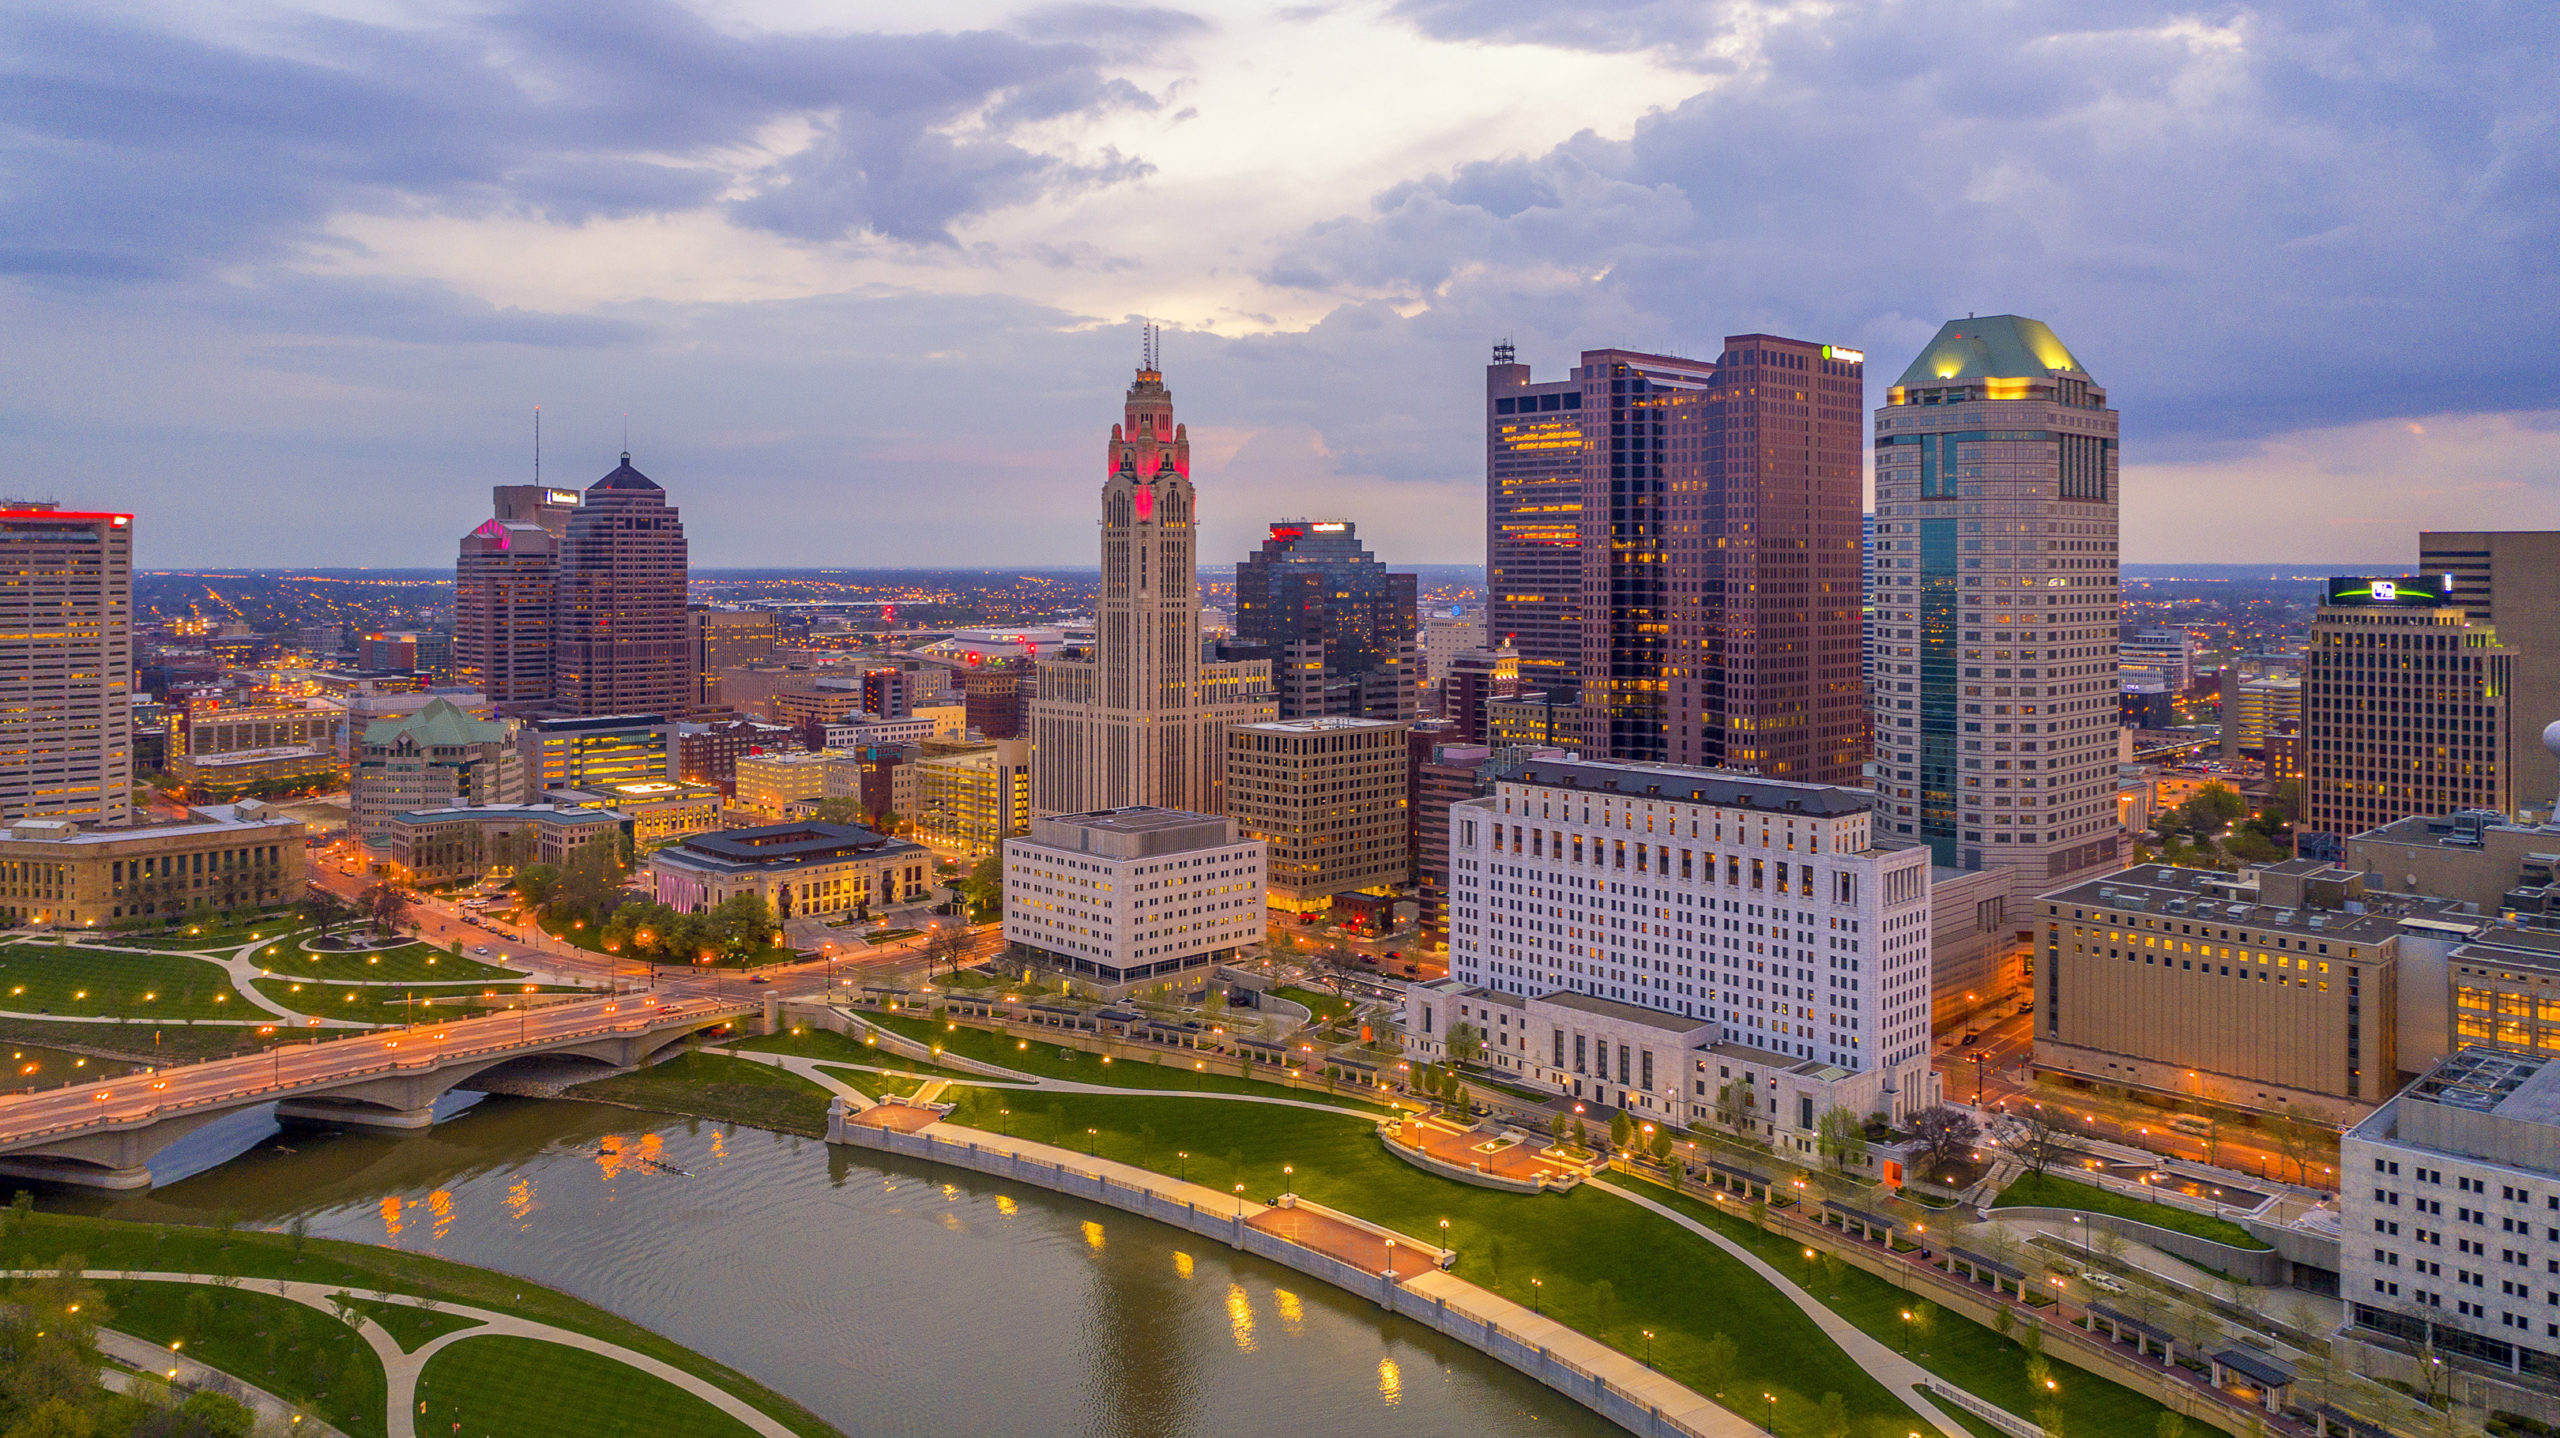
With the latest US Census data for 2020, we can once again take a closer look at how the Downtown area is doing.
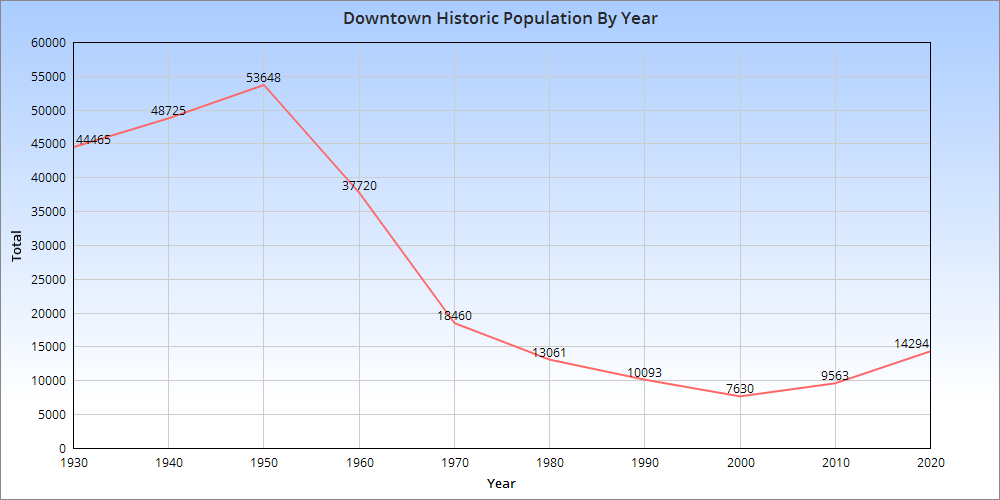
Looking at the graph above, we can see that the Downtown population peaked in 1950 and declined through 2000. The last 20 years have seen accelerating growth and the population was the highest in 2020 since 1970. One caveat with this is that the census tract boundaries that are used to make up this graph have changed some over the years. They haven’t changed significantly, but the area that’s being covered in 2020 is slightly different than it was in 1950. As such, it’s more of an approximation per year rather than exact figures based on the exact same area. Still, the rapid decline after 1950 is well-documented. Highways were either being planned or already under construction through the neighborhood during the 1950s, and this also helped the beginning stages of the suburban flight from the urban core.
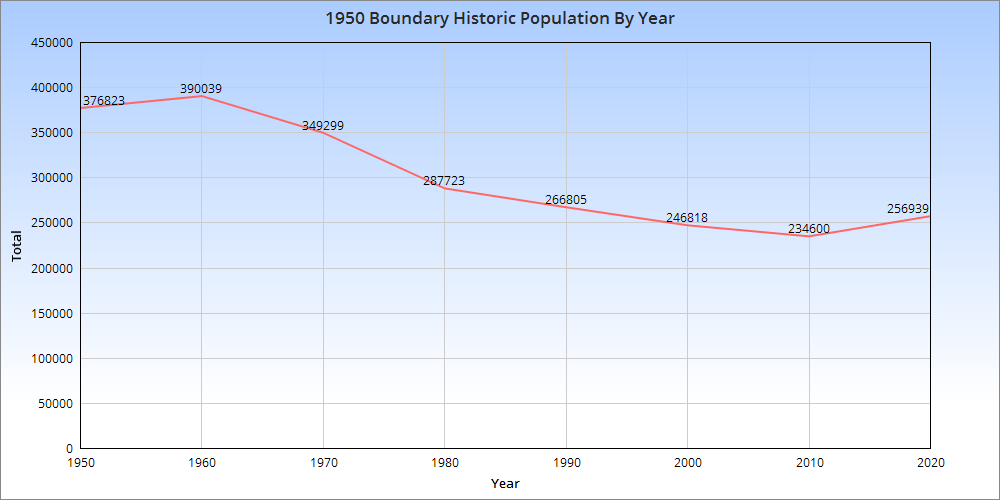
The urban core of the city overall reached its population peak in 1950, and the 1950 boundaries represent the oldest, arguably most urban part of the city today. Let’s examine how the population within that boundary changed over the same time. The 1950 boundary peaked in 1960 and then declined through 2010. Between 2010-2020, the 1950 boundary area gained more than 22,000 new residents, a significant increase which puts the area back to where it was around 1995.
So in both cases, the urban core of Columbus is in recovery, though it is unlikely to ever regain its 1950 population. Average household size is much smaller now than it was 70 years ago, so it would require a massive amount of infill that would be far denser than much of what is getting built in recent years. Outdated zoning codes, among other reasons, have been limiting many projects in the urban core from reaching their potential.
Breaking things down a bit further, let’s look at the census tracts that made up the 1950 boundary in 2020 and rank them for population and growth.
Top 10 Fastest-Growing 1950 Boundary Census Tracts by Total 2010-2020 1. 1121: +4,831 The tract is the main OSU Campus. The explosive growth is mostly due to the recent requirement that sophomores also have to now live on Campus, prompting thousands of students to move to the tract from nearby neighborhoods. 2. 4002: +2,592 This new tract was split off of Tract 40 and includes the southwest area of Downtown, including RiverSouth. 3. 22: +2,428 This tract is the heart of Italian Village and includes the large, new Jeffrey Park development. 4. 1901: +2,028 Includes the 5th Avenue corridor to just east of 5thxNW. 5. 32: +1,353 This tract covers the southern part of Victorian Village/Harrison West, as well as the far western sections of the Arena District where the new White Castle HQ complex is. 6. 17: +1,290 Western Weinland Park, which has seen rapid revitalization in recent years. 7. 30: +1,084 This area includes all of the norther half of Downtown north of Broad Street and west to Neil Avenue in the Arena District. 8. 16: +717 Eastern Weinland Park, which has seen hundreds of new housing units constructed along and near Grant Avenue. 9. 1902: +653 Includes the 5th Avenue corridor through 5thxNW. 10. 21: +648 The heart of the High Street strip in the Short North continued to add people. It reached its highest population in 60 years.
Top 10 Tracts with the Highest Population Densities in 2020 1. 1121: 34,888.8 2. 1810: 28,351.1 3. 1302: 24,740.7 4. 1301: 20,549.1 5. 17: 20,158.6 6. 12: 20,069.6 7. 1110: 18,353.2 8. 10: 16,260.2 9. 16: 12,675.6 10. 21: 12,196.7 All of these tracts are either in the Short North or surrounding Ohio State’s campus. They include the highest densities anywhere in Ohio.
So there you have it. The urban core of Columbus is clearly on a positive path. So long as infill development continues, population growth should also continue to increase. Perhaps someday, this increasing population and density may facilitate the construction of more amenities, including rail lines, BRT and more biking infrastructure, all of which lags in the area. To see Census Tract data in map form, the Census Tract Maps page provides it.
Franklin blew away the competition, adding more than 4x as many people as 2nd place Delaware County. Delaware County may be called the state’s fastest-growing by percent, but it’s clear what the dominant destination is in Ohio.
Core counties in Northern Ohio, as well as pretty much all of Appalachia and rural counties saw large population losses. This pattern of urban/metro counties gaining while exurban and rural counties declined was repeated nationally. 52% of all US counties lost population, with the vast majority of them being exurban and rural. There was clearly a strong trend towards people moving to or near major cities.
After a very long delay, the 2020 Census data has arrived! In this first series of related posts, we will compared Columbus to national peer and Midwest metro areas. Metros used here are those that were within 1.5-2.5 million in either 2010 or 2020, as well as Midwest metros of 500,000 or more in either 2010 or 2020, and all Ohio metros.
Total Population by Metro Area by Year Green metros moved up in the rankings 2010-2020 and red moved down.
Rank
2010
2020
1
Chicago: 9,461,105
Chicago: 9,618,502
2
Detroit: 4,296,250
Detroit: 4,392,041
3
Minneapolis: 3,346,859
Minneapolis: 3,690,261
4
St. Louis: 2,787,701
St. Louis: 2,820,253
5
Pittsburgh: 2,356,285
Orlando: 2,673,376
6
Charlotte: 2,243,960
Charlotte: 2,660,329
7
Portland: 2,226,009
San Antonio: 2,558,143
8
Sacramento: 2,149,127
Portland: 2,512,859
9
San Antonio: 2,142,508
Sacramento: 2,379,382
10
Cincinnati: 2,137,667
Pittsburgh: 2,370,930
11
Orlando: 2,134,411
Austin: 2,283,371
12
Cleveland: 2,077,240
Las Vegas: 2,265,461
13
Kansas City: 2,009,240
Cincinnati: 2,256,884
14
Las Vegas: 1,951,269
Kansas City: 2,192,035
15
Columbus: 1,901,974
Columbus: 2,138,926
16
Indianapolis: 1,887,877
Indianapolis: 2,111,040
17
San Jose: 1,836,911
Cleveland: 2,088,251
18
Austin: 1,716,289
San Jose: 2,000,251
19
Virginia Beach: 1,713,954
Nashville: 1,989,519
20
Nashville: 1,646,200
Virginia Beach: 1,799,674
21
Providence: 1,600,852
Providence: 1,676,579
22
Milwaukee: 1,555,908
Jacksonville: 1,605,848
23
Jacksonville: 1,345,596
Milwaukee: 1,574,731
24
Grand Rapids: 993,670
Grand Rapids: 1,087,592
25
Omaha: 865,350
Omaha: 967,604
26
Dayton: 799,232
Dayton: 809,248
27
Akron: 703,200
Des Moines: 707,915
28
Toledo: 651,429
Akron: 701,449
29
Wichita: 623,061
Madison: 670,447
30
Des Moines: 606,475
Wichita: 643,768
31
Madison: 605,435
Toledo: 641,549
32
Youngstown: 565,773
Lansing: 548,248
33
Lansing: 534,684
Youngstown: 531,420
34
Canton: 404,422
Canton: 396,669
Columbus largely held its own in the rankings this decade, but it poised to eventually pass a few of the metros currently ahead of it.
Columbus had the 2nd highest growth in the Midwest after Minneapolis, and is growing much faster than 3 metros currently ranked ahead of it- Cincinnati, Kansas City and Pittsburgh- which it will likely pass at some point in the future. For Cincinnati, for example, current growth rates would suggest Columbus will pass it sometime around 2027. In any event, Columbus’ metro growth was the highest in its history, and about 10,000 more than occurred during the 2000s.
Data related to metro components of growth, such as immigration and deaths vs. births, have yet to be released. Those should come out sometime next month, and will be posted here when they do.
Franklinton has been known as The Bottoms for many years, mainly because the low-lying neighborhood has seen flooding more often than anywhere else in the city. With the completion of the Franklinton Floodwall nearly 20 years ago, the neighborhood has been seeing redevelopment at an ever-increasing pace. This Before and After of the neighborhood only covers some of the changes, and another similar post detailing more changes will most likely be needed.
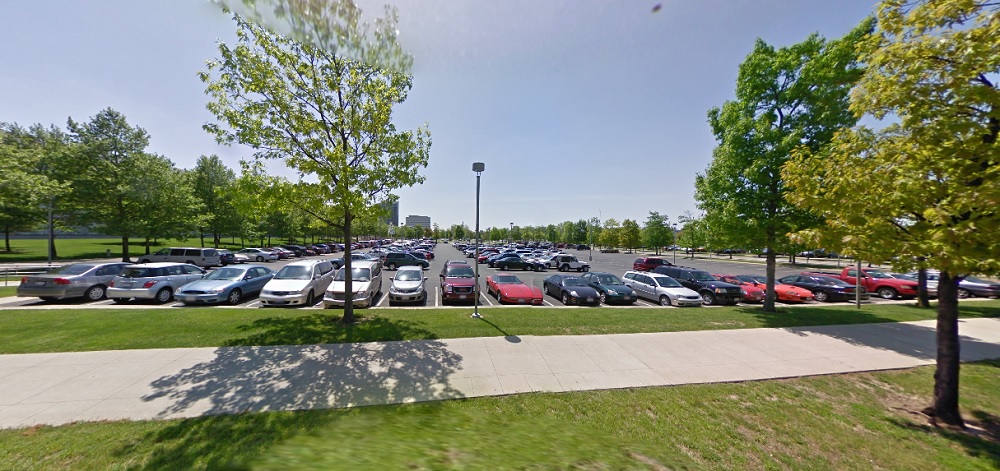
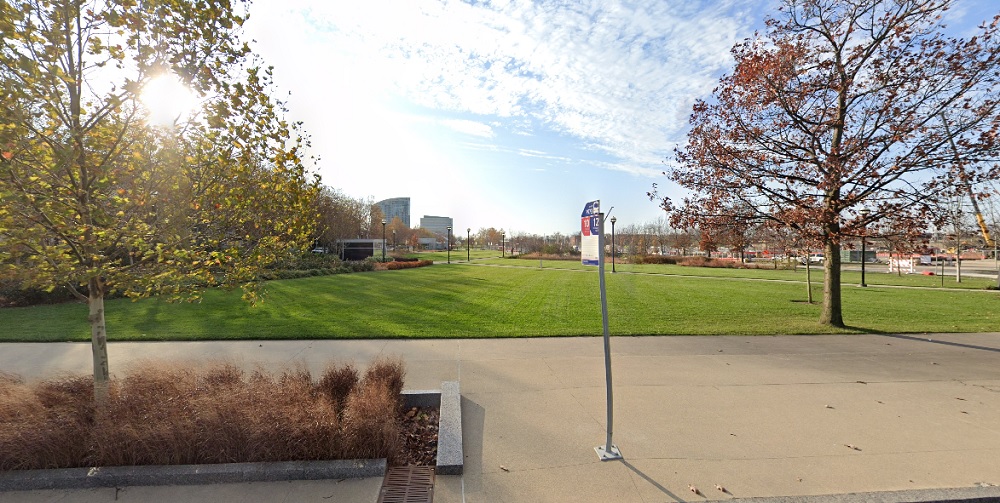
Before: COSI Parking Lot in 2009 This large parking lot had once been part of Central High School’s campus and was originally the site of the schools track and athletic fields. After the school closed in the early 1980s, the area was converted to a large parking lot. It continued its life as parking when COSI moved from Downtown to a new facility in the converted school. When plans for the Scioto Peninsula to be redeveloped emerged, it was decided to turn the parking lot into a brand new park. After: New Park in 2020 The parking was not actually lost, however. An underground garage was constructed beneath the park itself, which is now called Dorian Green. New development, which will include offices, retail and hundreds of new residences, can be seen under construction in the background.
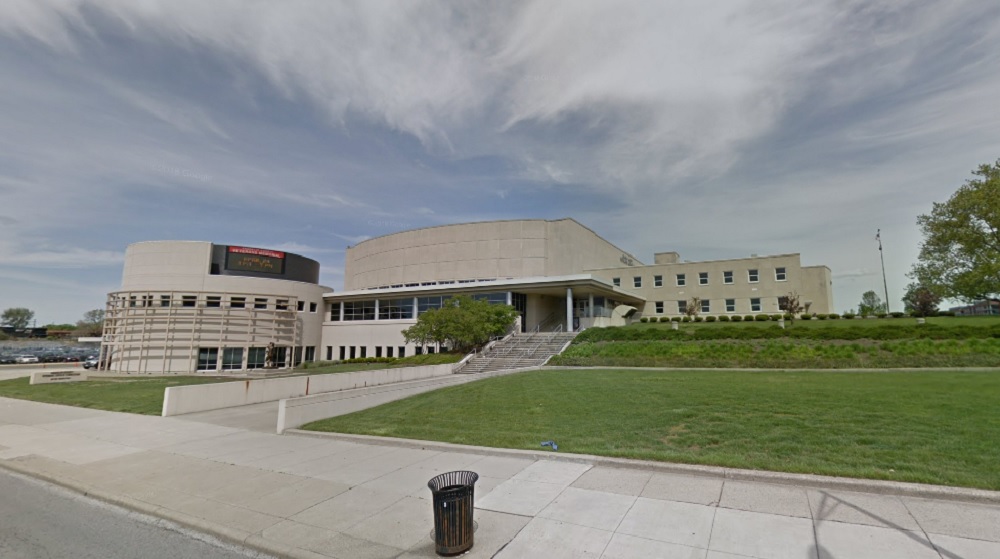
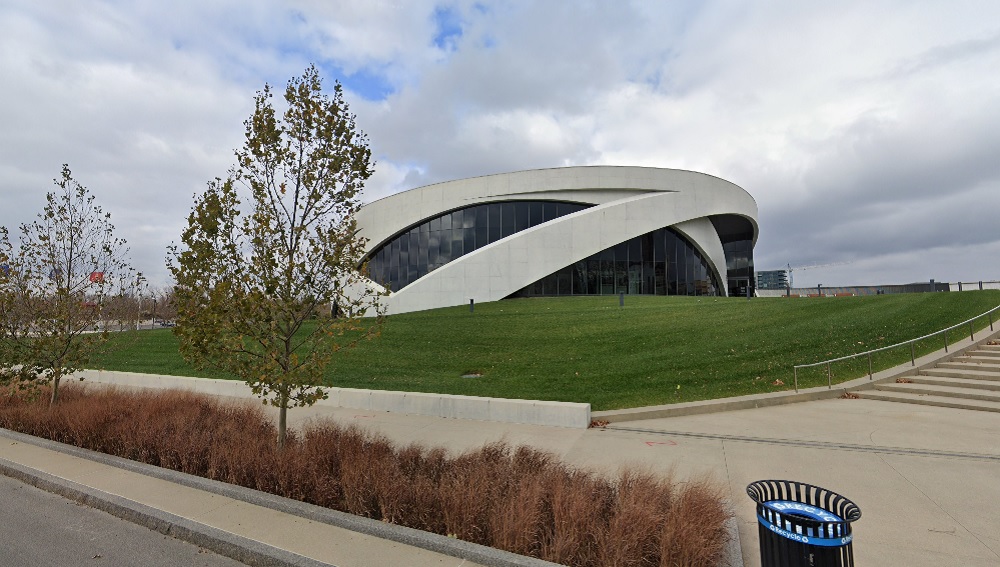
Before: Veterans Memorial in 2011 The old Veterans Memorial was constructed in the mid-1950s. Over the subsequent decades, the building was renovated and expanded multiple times. By the 2000s, the building was considered outdated with a convoluted layout. Despite some objections, it was decided that the complex would be torn down and replaced with a new veterans center. After: National Veterans Memorial and Museum in 2020 The new building had a far more modern, almost futuristic design, like something out of an X-Men movie. The new building was to remain a veterans memorial with office and event space, but also serve as a museum. It was eventually given the status of being the National Veterans Memorial, the only one of its kind in the nation.
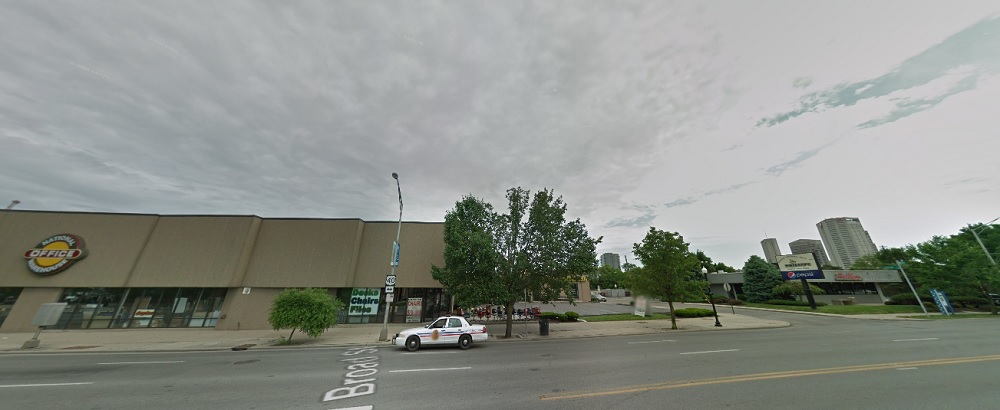
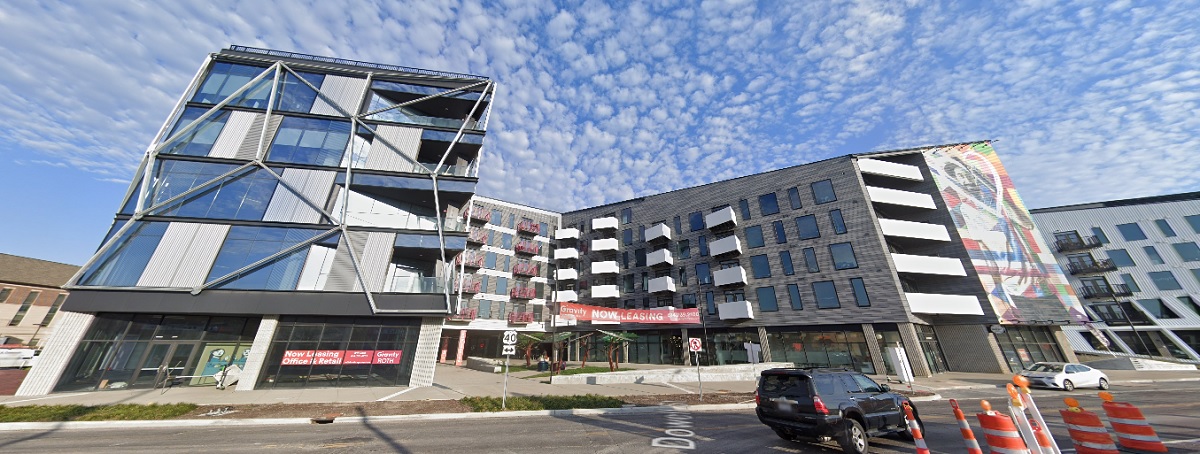
Before: 500 West Broad Street in 2011 Back in 2011, 500 W. Broad was a collection of small businesses, most notably Wasserstrom restaurant supply. This stretch of Broad was unremarkable and a more modern remnant of urban renewal during the mid-20th Century. After: 500 West Broad in 2020 Today, the first phase of the Gravity development occupies the entire stretch. This unique mixed-use development contains, among other things, apartments, retail space, community art and activity space for its residents. Directly across the street, the 2nd- and much larger- phase of Gravity is currently under construction.
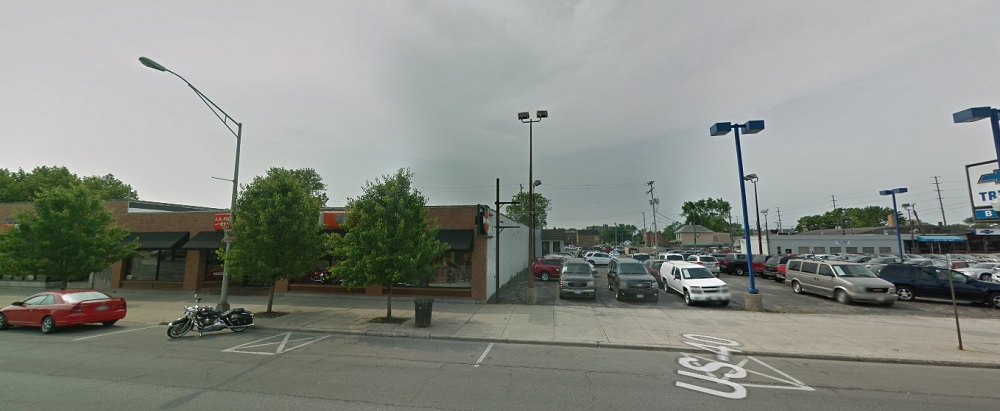
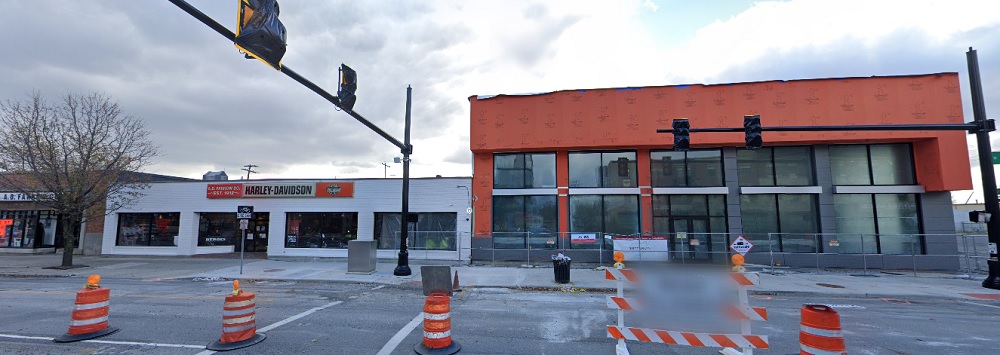
Before: A.D. Farrow Harley Davidson in 2012 A century after the business was established, this Harley Davidson sales shop just down the street from Gravity looked out of date. Half the site was also a parking lot that fronted Broad Street. After: A.D. Farrow Harley Davidson in 2020 In 2020, the business was engaged in a significant remodel and expansion. Local business investments such as this have been on the rise in Franklinton in recent years, especially east of 315.
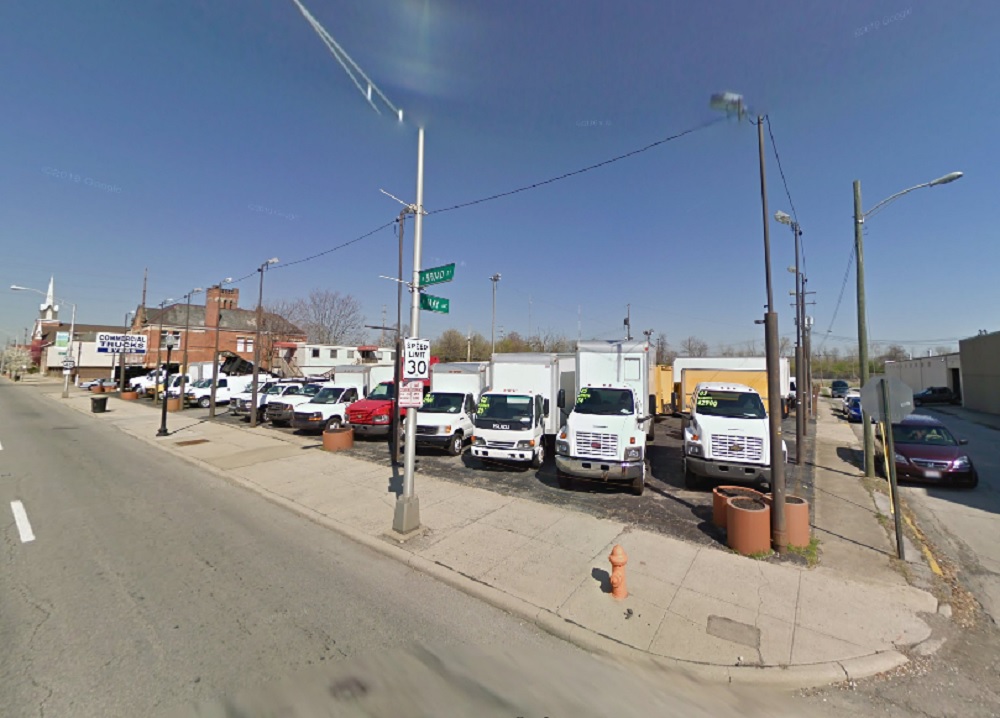
Before: 524 West Broad in 2009 This site had been used as a car lot for some time. The original buildings had been demolished in the early 1960s, replaced with surface parking. After: 524 West Broad in 2020 Today the site is home to Franklinton Station, a lower-income residential complex for seniors.
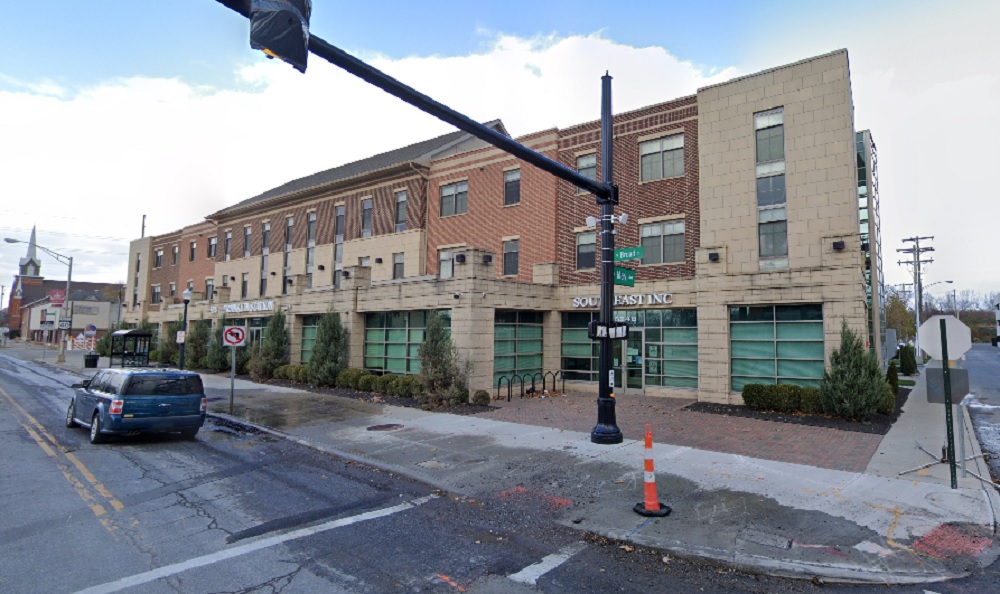
Before: West Rich Street at the Railroad Crossing, looking west in 2009 This view of West Rich Street shows how the area had been in decline, with abandoned buildings on the right and run-down public housing on the left that had seen little investment since its construction in the early 1960s. After: West Rich Street at the Railroad Crossing, looking west in 2020 Today, this section of Rich Street looks like a completely different place. Buildings have been renovated and old housing has been replaced with the much more dense River & Rich mixed-use development. The new complex contains retail space and residences that retain affordable housing. Another phase of the River & Rich development is in the works that may eventually include a new residential tower.
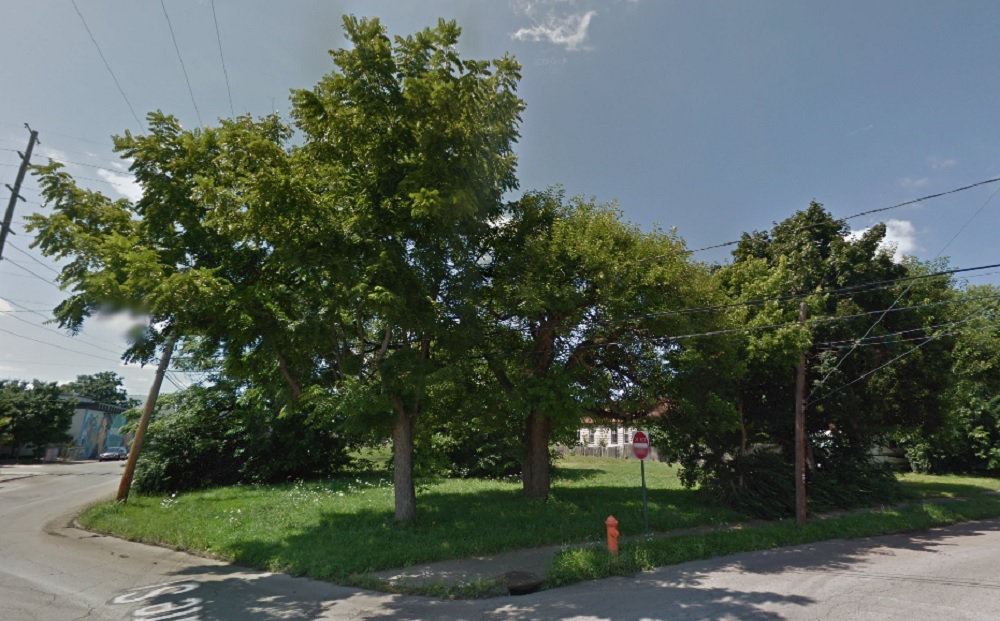
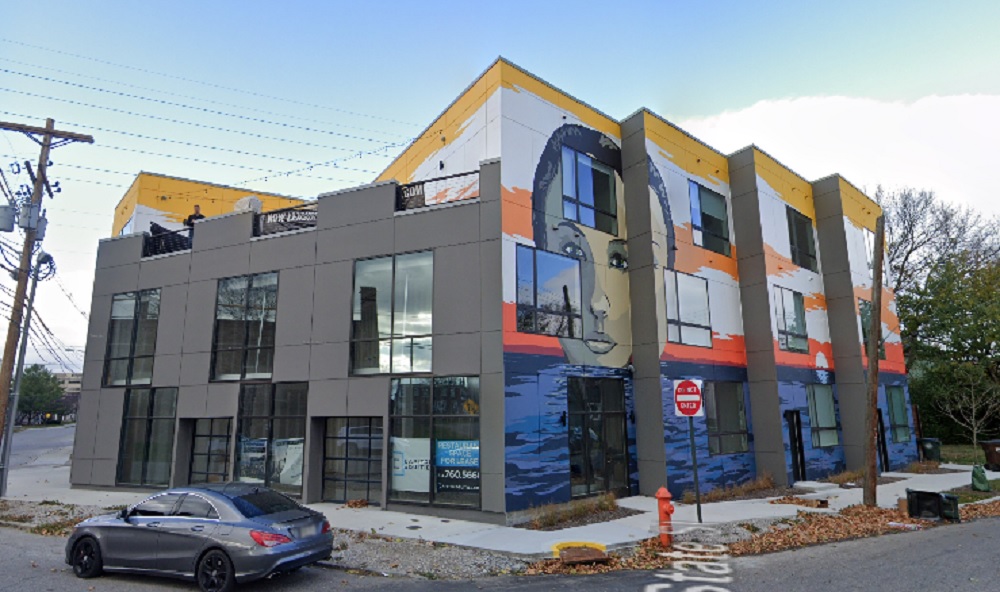
Before: 548 West State Street in 2011 The site at 548 W. State had been vacant for a number of years, with the original development having been demolished. By 2011, it was overgrown with weeds. After: 548 West State Street in 2020 In 2020, the site had a brand new mixed-use building containing 13 apartments and retail space. The mural also contributes to Franklinton becoming more of an arts location as the previous arts destination, the Short North, becomes ever more expensive.
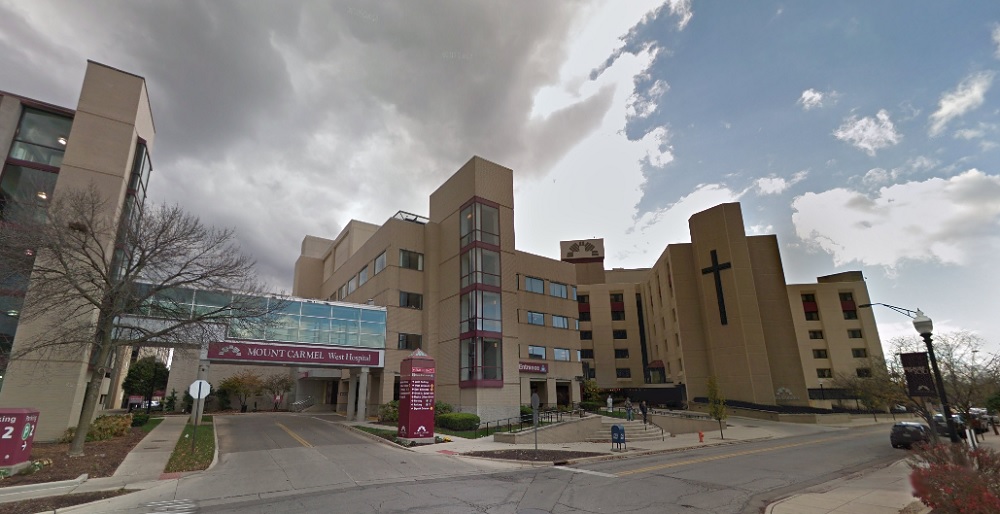
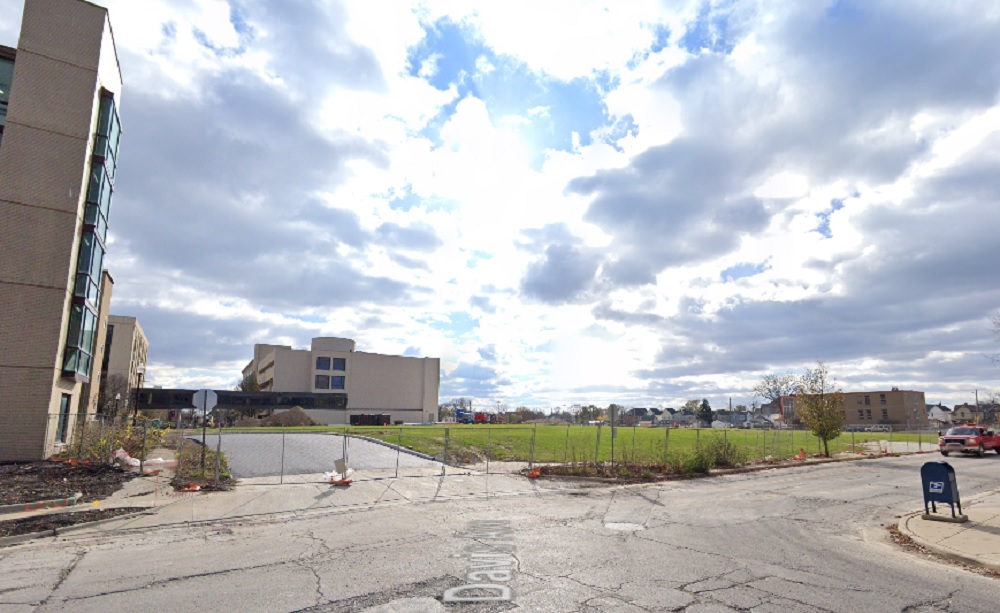
Before: Mount Carmel West in 2015 Mount Carmel West Hospital had been a dominant fixture in Franklinton for more than a century. It was originally known as Hawkes Hospital and constructed in 1886, becoming Mount Carmel in the 20th Century. However, by the 2010s, the location was deemed to be less optimal and so most of the services were moved to a new hospital in Grove City. The fate of the old hospital was sealed and a plan was drawn up to redevelop the entire site. After: Mount Carmel West in 2020 By 2020, the main hospital was no more. The only structures that will remain include the nurse’s college and several parking garages. The site will be redeveloped with mixed-use projects including residential, retail and office space over the next several years.
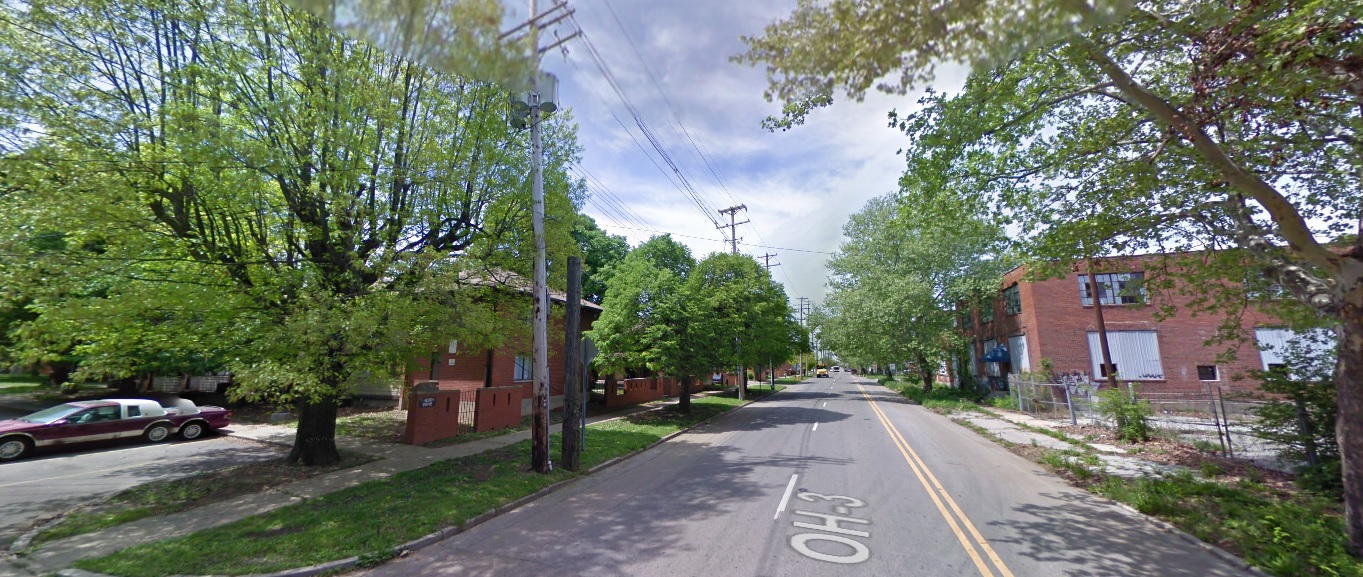
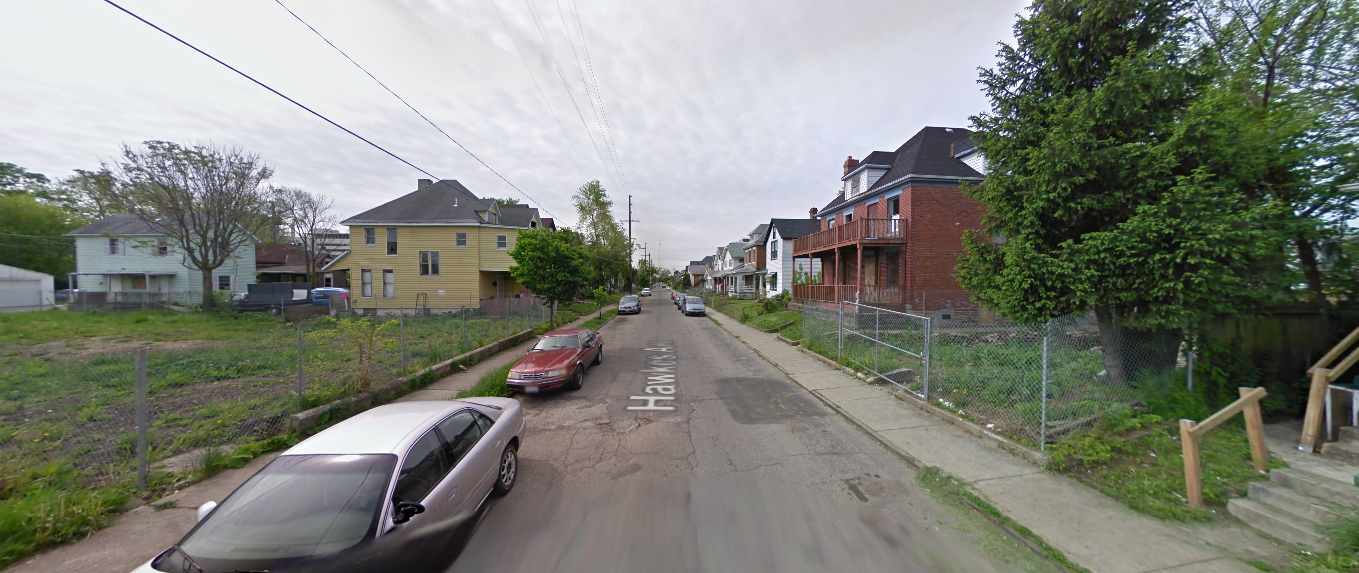
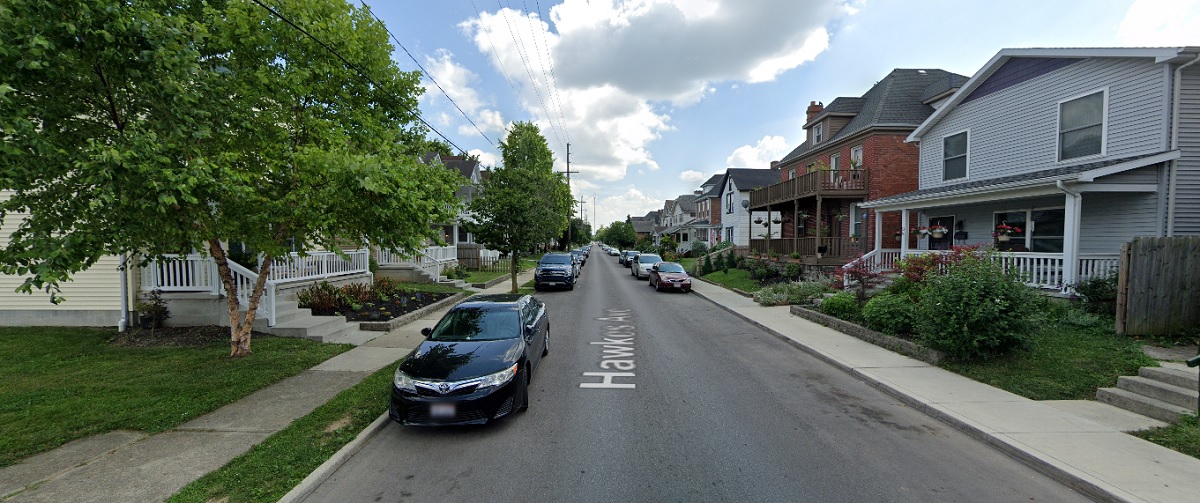
Before: Hawkes Avenue, looking south from Chapel Street in 2009 Hawkes Avenue was a typical Franklinton street by the late 2000s, with its vacant lots, abandoned buildings and poorly-maintained infrastructure. After: Hawkes Avenue, looking south from Chapel Street in 2019 Infill housing has been gradually becoming more common throughout Franklinton, as well as home renovations and general reinvestment in infrastructure by the City. Hawkes Avenue has been a beneficiary, and now looks better than it has in many years.
Franklinton has come a long way in just a few years, and the neighborhood is poised to only continue to change even more drastically in the near future. Many new projects are either under construction or have been recently proposed. Future phases of the Scioto Peninsula redevelopment will only spur additional development and growth westward. Whether Franklinton can revitalize without driving out too many of its existing residents remains somewhat of an open question.