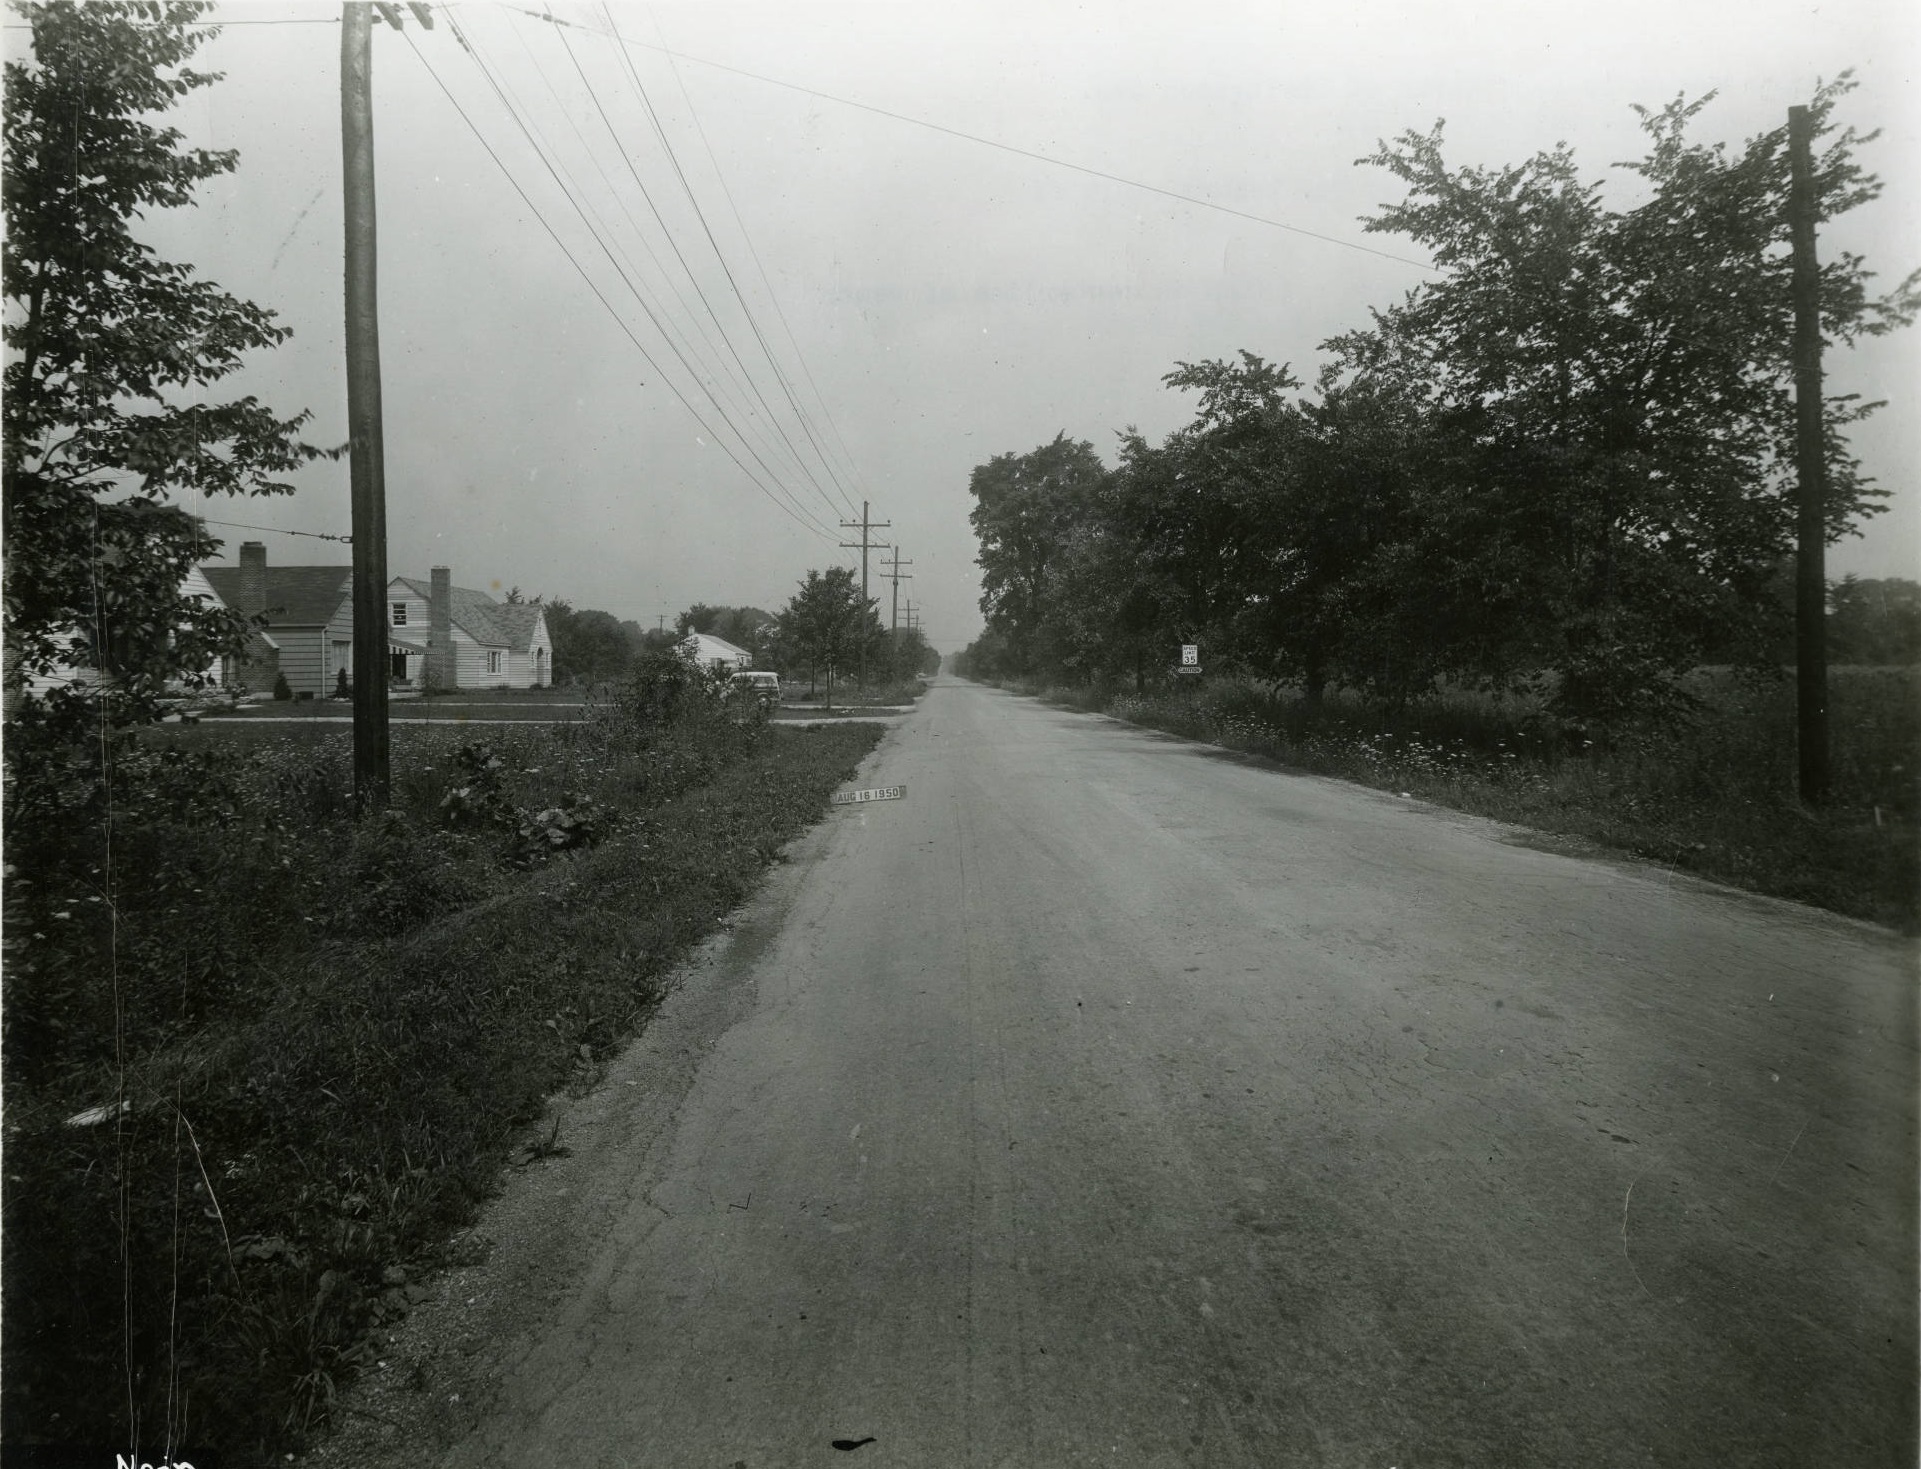
In Random Columbus Photos 10, we look toward the East Side.
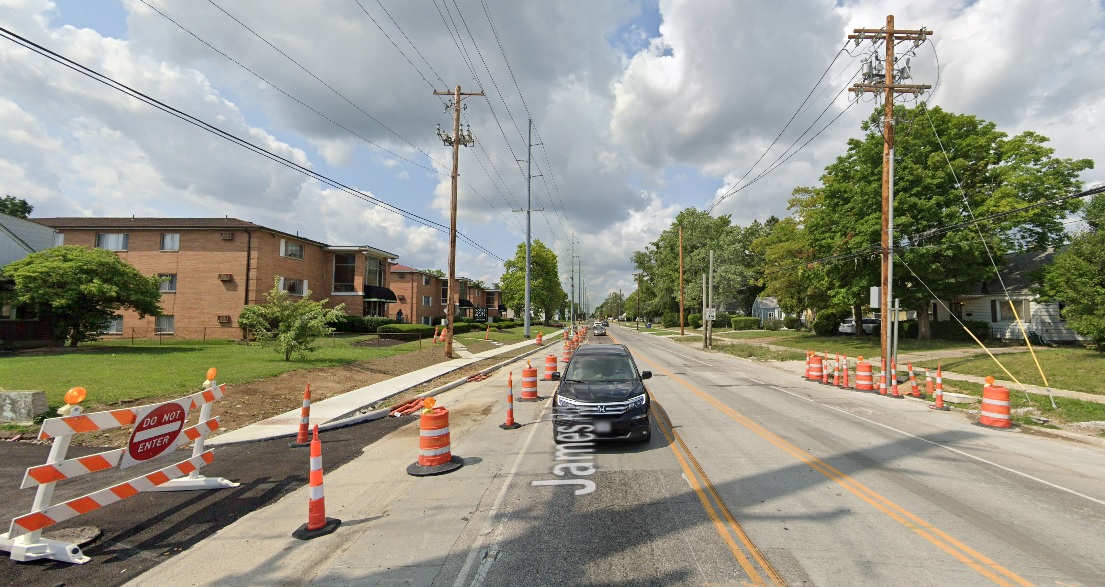
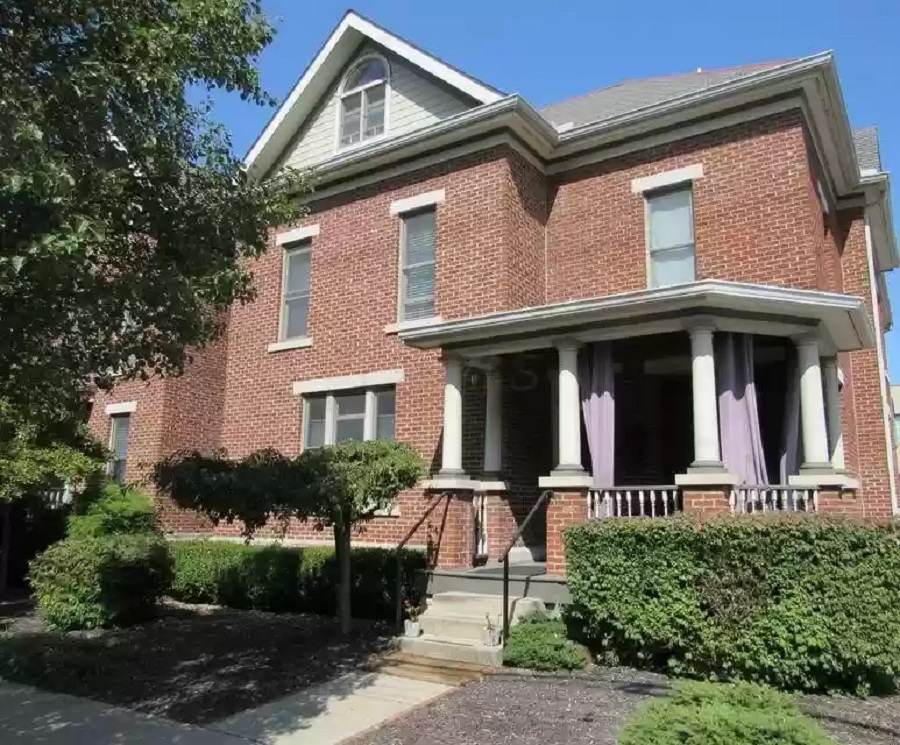
Photo Location: James Road, looking north from Livingston Avenue. Photo Date: August 16, 1950 Photo History: This photo of a very primitive James Road was taken by the City in preparation for installing a sewer system in the area. There were very few homes and other buildings on James at the time, and the area was still mostly farmland. The homes on the left side of the photo had only just been completed, and were the first of large-scale, small-home subdivisions that now dominate this part of the city and neighboring Whitehall. By 1953, the entire area seen in the photo would be fully developed and unrecognizable. The same view today:
Thousands of historic before and after photos from across the city can be found on the Historic Building Database.
For the Housing Market Update August 2022, data from Columbus Realtors shows that the overall market saw a decrease in home sales and units on the market versus a year ago, a situation that contributed to the continuation of rising prices. So far, it doesn’t appear there has been any sustained impact yet from increasing interest rates. More data was added to this update than usual, including some county-level information.
Note: LSD= Local School District, CSD= City School District. In both cases, school district boundaries differ from city boundaries.
Median Sales Price By Columbus Metro County in August 2022 and Total Change vs. August 2021 1. Delaware: $448,000 +$34,000 2. Union: $420,000 +$83,500 3. Fairfield: $308,950 +$13,950 4. Hocking: $306,000 +$135,550 5. Pickaway: $295,000 +$42,000 6. Franklin: $285,700 +$15,700 7. Licking: $285,500 +$10,600 8. Madison: $272,000 +$9,500 9. Morrow: $230,000 +$50,000 10. Perry: $216,000 -$4,000
Median Sales Price % Change August 2022 vs. August 2021 1. Hocking: +79.5% 2. Morrow: +27.8% 3. Union: +24.8% 4. Pickaway: +16.6% 5. Delaware: +8.2% 6. Franklin: +5.8% 7. Fairfield: +4.7% 8. Licking: +3.9% 9. Madison: +3.6% 10. Perry: -1.8% Licking County saw relatively low growth in its home prices the past year, but that is almost certainly to change in the near future. Franklin County median home prices are still in the bottom half for total and growth.
Overall Market Median Sales Price in August: $306,715 Based on the 10 Columbus Metro Area counties. This price was a bit lower than in July, but almost $40,000 higher than August, 2021.
Top 15 Most Expensive Locations By Median Sales Price in August 2022 1. New Albany: $750,000 2. Grandview Heights: $685,000 3. New Albany Plain LSD: $575,500 4. Bexley: $575,000 5. Powell: $563,000 6. German Village: $554,500 7. Dublin: $552,500 8. Upper Arlington CSD: $540,000 9. Olentangy LSD: $500,000 10. Dublin CSD: $485,000 11. Short North: $465,000 12. Jonathan Alder LSD: $443,900 13. Granville CSD: $426,500 14. Northridge LSD: 417,340 15. Big Walnut LSD: $414,000 Median prices were generally lower in August than July, but still up versus August 2021.
Top 15 Least Expensive Metro Locations by Median Sales Price in August 2022 1. Circleville CSD: $150,000 2. Whitehall: $171,600 3. Valleyview: $184,900 4. Hamilton LSD: $187,500 5. Miami Trace LSD: $203,000 6. Lancaster CSD: $210,000 7. Jefferson LSD: $219,750 8. Newark CSD: $220,000 9. Columbus CSD: $234,900 10. Groveport Madison LSD: $250,000 11. Columbus: $256,000 12. South Western CSD: $273,700 13. Reynoldsburg CSD: $276,450 14. London CSD: $276,750 15. Minerva Park: $284,950
Top 15 Metro Locations with the Highest Median Sales Price % Growth Between August 2021 and August 2022 1. Bexley: +70.4% 2. Newark CSD: +29.4% 3. Obetz: +28.8% 4. London CSD: +25.8% 5. Grove City: +20.7% 6. Valleyview: +19.3% 7. Teays Valley LSD: +19.2% 8. Grandview Heights: +19.1% 9. Marysville CSD: +18.4% 10. Hilliard: +17.9% 11. Beechwold/Clintonville: +17.0% 12. Gahanna: +17.0% 13. Powell: +16.7% 14. New Albany: +16.3% 15. New Albany Plain LSD: +15.8% 16. Blacklick: +15.7%
Top 15 Locations with the Lowest Median Sales Price % Growth Between August 2021 and August 2022 1. Circleville CSD: -20.6% 2. Minerva Park: -9.3% 3. Granville CSD: -6.3% 4. Hamilton LSD: -3.8% 5. Jefferson LSD: -3.2% 6. Lancaster CSD: -2.8% 7. Big Walnut LSD: -0.4% 8. Buckeye Valley LSD: +0.9% 9. Downtown: +1.0% 10. Sunbury: +1.1% 11. Westerville: +2.2% 12. Johnstown-Monroe LSD: +3.2% 13. Columbus: +3.6% 14. Canal Winchester CSD: +4.3% 15. Westerville CSD: +4.5%
Overall Market Median Sales Price % Change August 2022 vs. August 2021:+14.6%
New Listings by Metro County in August 2022 and Change From August 2021 1. Franklin: 1,837 -361 2. Delaware: 314 -46 3. Licking: 255 -56 4. Fairfield: 230 -61 5. Pickaway: 91 +2 6. Union: 90 -19 7. Madison: 44 -4 8. Morrow: 40 -23 9. Hocking: 35 -9 10. Perry: 35 +7
Total Metro New Listings in August 2022: 2,971 Total Metro New Listings Change from August 2021 to August 2022: -570
% Change of New Listings by Metro County August 2021-August 2022 1. Morrow: -36.5% 2. Fairfield: -21.0% 3. Hocking: -20.5% 4. Licking: -18.0% 5. Union: -17.4% 6. Franklin: -16.4% 7. Delaware: -12.8% 8. Madison: -8.3% 9. Pickaway: +2.2% 10. Perry: +25.0%
% Change of Metro New Listings August 2021 to August 2022: -16.1% New listings continued year-over-year declines. Until the supply really starts to grow- or demand falls- prices will continue to rise.
Top 10 Locations with the Most New Listings in August 2022 1. Columbus: 1,224 2. Columbus CSD: 856 3. South Western CSD: 192 4. Olentangy LSD: 155 5. Hilliard CSD: 135 6. Westerville CSD: 122 7. Dublin CSD: 111 8. Pickerington LSD: 87 9. Upper Arlington CSD: 81 10. Grove City: 71
Top 10 Locations with the Fewest New Listings in August 2022 1. Valleyview: 1 2. Minerva Park: 3 3. Lithopolis: 6 4. Obetz: 6 5. Jefferson LSD: 8 6. Granville CSD: 9 7. Sunbury: 11 8. New Albany: 12 9. Grandview Heights: 13 10. Northridge LSD: 14 11. Miami Trace LSD: 14 12. German Village: 16 13. Bexley: 16
Metro Counties by # of Days Homes Remain on the Market Before Sale in August 2022 1. Fairfield: 12 2. Franklin: 13 3. Licking: 13 4. Union: 14 5. Delaware: 16 6. Perry: 16 7. Madison: 18 8. Hocking: 22 9. Pickaway: 26 10. Morrow: 36
Average # of Days Homes Remain on the Market Before Sale for the Metro Overall in August 2022: 18.6 # of Days Homes Remain on the Market Before Sale for the Metro August 2021 vs. August 2022: +7.0 In one of the few signs of a potential slowdown, homes took a week more on average to sell than they did during the same period last year.
Top 10 Fastest-Selling Locations by # of Days Homes Remain on the Market Before Sale in August 2022 1. Valleyview: 4 2. Blacklick: 6 3. Lithopolis: 6 4. Gahanna: 7 5. Gahanna Jefferson CSD: 8 6. Pickerington: 8 7. Pickerington LSD: 8 8. Granville CSD: 9 9. Newark CSD: 9 10. Powell: 9 11. Reynoldsburg CSD: 9 12. Buckeye Valley LSD: 10 13. Dublin: 10 14. Hilliard: 10 15. Hilliard CSD: 10 16. Marysville CSD: 10 17. Westerville CSD: 10 18. Canal Winchester CSD: 11 19. German Village: 11 20. Johnstown-Monroe LSD: 11 21. Northridge LSD: 11 22. Sunbury: 11 23. Westerville: 11 24. Worthington CSD: 11 25. Circleville CSD: 12 26. Delaware CSD: 12 27. Grandview Heights: 12 28. Groveport Madison LSD: 12 29. Worthington: 12 30. Columbus: 13 31. Dublin CSD: 13 32. South Western CSD: 13 33. Hamilton LSD: 14 34. Lancaster CSD: 14 35. Whitehall: 14
Top 10 Slowest-Selling Locations by # of Days Homes Remain on the Market Before Sale in August 2022 1. Downtown: 47 2. Obetz: 33 3. Teays Valley LSD: 32 4. Miami Trace LSD: 28 5. Short North: 26 6. Minerva Park: 22 7. Pataskala: 22 8. Big Walnut LSD: 20 9. New Albany: 20 10. New Albany Plain LSD: 19 11. Upper Arlington CSD: 18 12. Olentangy LSD: 17
Top 10 Locations with the Greatest % Decline of # of Days on the Market Before Sale August 2022 vs. August 2021 1. Valleyview: -69.2% 2. Powell: -52.6% 3. Sunbury: -50.0% 4. Grandview Heights: -45.5% 5. German Village: -35.3% 6. Downtown: -29.9% 7. Gahanna Jefferson CSD: -27.3% 8. New Albany: -25.9% 9. Bexley: -20.0% 10. Short North: -7.1%
Top 10 Locations with the Lowest % Decline of # of Days on the Market Before Sale August 2022 vs. August 2021 1. Teays Valley LSD: +300.0% 2. Miami Trace LSD: +211.1% 3. Delaware CSD: +200.0% 4. Groveport Madison LSD: +200.0% 5. Whitehall: +180.0% 6. Minerva Park: +175.0% 7. Pataskala: +175.0% 8. Northridge LSD: +120.0% 9. Obetz: +120.0% 10. Lithopolis: +100.0% 11. Pickerington: +80.0% 12. London CSD: +77.8% 13. Circleville CSD: +71.4%
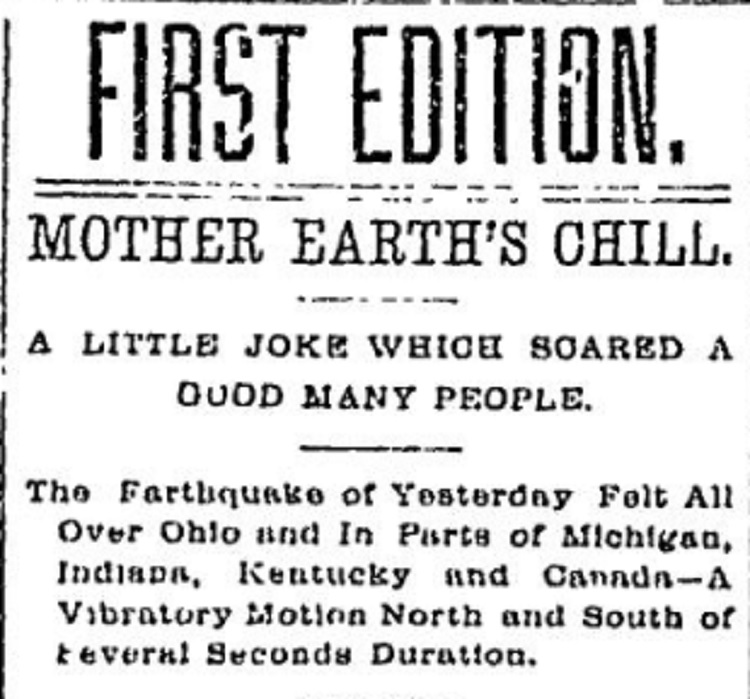
Columbus Dispatch headline from September 20, 1884.
This Strange Columbus 1884 Earthquake edition reviews a fairly rare event in the state-a damaging seismic event. While most earthquakes felt within the state have epicenters outside of Ohio- either west in the Missouri/Illinois area or north in Ontario or Quebec- the September, 1884 quake was one of the few damaging ones that had its origins within state borders. At around 2:45PM on the 19th, an estimated magnitude 4.8 tremor struck northwest Ohio. While 4.8 is not particularly strong as far as earthquakes go, Ohio’s geology allows even relatively weak quakes to shake the land with much greater force than in other parts of the country. The earthquake was felt across all of Ohio and several surrounding states. The Crestline Advocate, from small Crestline, Ohio to the west of Mansfield, provided accounts from all over the region a week after the event. Here are just a few.
From Crestline itself: A genuine earthquake visited this locality last Friday afternoon at 2:45, in which houses were made to tremble and furniture rattle. Several persons ran from dwellings and business houses, expecting everything to “fall in.” The swaying motion was very distinct, running east and west. The sensation was something new in this section. The experience here was the same as that telegraphed from numerous portions of the State. Our neighboring towns, also, reported a lively shaking up. James Booth says that, at the time of the occurrence, he was thrown from a lounge on which he was lying, then bounded up from the floor, whirled around, and went scooting out of his front door up into the air, and when he collected his scattered senses he found himself on the roof of his domicile, standing on his head. He didn’t say this in just so many words, but this was inferred from the experience he related.
COLUMBUS, O., September 20. – At 2:40p.m. yesterday, a shock of earthquake was felt in different parts of this city, the vibrations lasting over thirty seconds. At the Capitol (sic) University the chandeliers swayed to and fro and students left their rooms amid great excitement.
CLEVELAND, Ohio., September 20. – Yesterday afternoon an earthquake was felt in many parts of this city. Tables and furniture were moved in the houses, pictures on the walls were shaken, causing quite an excitement among the inmates. The motion was from west to east and was confined to three distinct rockings finally subsiding and dying away in a sort of a tremor.
CINCINNATI, O., September 20. – At 2:30 yesterday afternoon the shock of an earthquake was felt in this city and in Covington, Ky. There was a slight trembling of buildings and rocking motion felt, which was sufficiently marked to cause astonishment and comment. The motion was from north to south and was a gentle undulation, without any tremor or upheaval. The shocks lasted about ten seconds, there being a perceptible pause between the first and second. A gentleman, who was writing at home on Cutter Street, said he felt his table vibrate. It stopped and then moved again less violently than before. Reports from Mt. Vernon and Delaware, Ohio, say the shock was felt at their places.
A 1998 report on the event further described some of the damage and range of the earthquake. The earthquake caused damage at Lima, where the shock was “of considerable violence and caused much excitement.” Plaster was shaken from ceilings east and southeast of Columbus at Zanesville, Ohio, and Parkersburg, W. Va. Windows and dishes were broken at Defiance and Norwalk, Ohio; to the west at Fort Wayne and Muncie, Ind.; to the north at Lansing, Mich.; and to the east at Wheeling, W. Va. Furniture was displaced and 14 buildings were heavily shaken at Urbana, Ohio, in Champaign County, and at many other towns in the regions. Also felt in Iowa, Kentucky, Pennsylvania, and western Ontario, Canada, and at Washington, D.C. by workmen on top of the unfinished Washington Monument.
The exact epicenter was never determined, but research long after put the likely origin in Allen County.
The United Stated Geological Survey, or USGS, puts out an earthquake map with all current and past earthquakes from around the world. Users can select regions and search for earthquakes going back a century or more, or search based on magnitudes.
Intel’s big project northeast of New Albany is now well-known. People are both excited and cynical about all the potential impacts that will come with it. But what is not discussed nearly as much- and is arguably just as important long-term- is what happens to all the land around it. Rumors are already flying about developers scrambling to snatch up as much land as they can for housing, and that is no doubt true. The land is largely a blank slate, so what happens to it from this point is entirely up to the cities, towns and townships that the land sits within. Without a coordinated effort and plan, the area will almost certainly become a nightmarish cluster**** of low-density sprawl and endless traffic, which would be to the detriment of all.
So what can be done? How we should develop around Intel is not really the open question some might think. The answer, it seems, is pretty obvious once you get into the details of what types of development provide the most economic and social benefits.
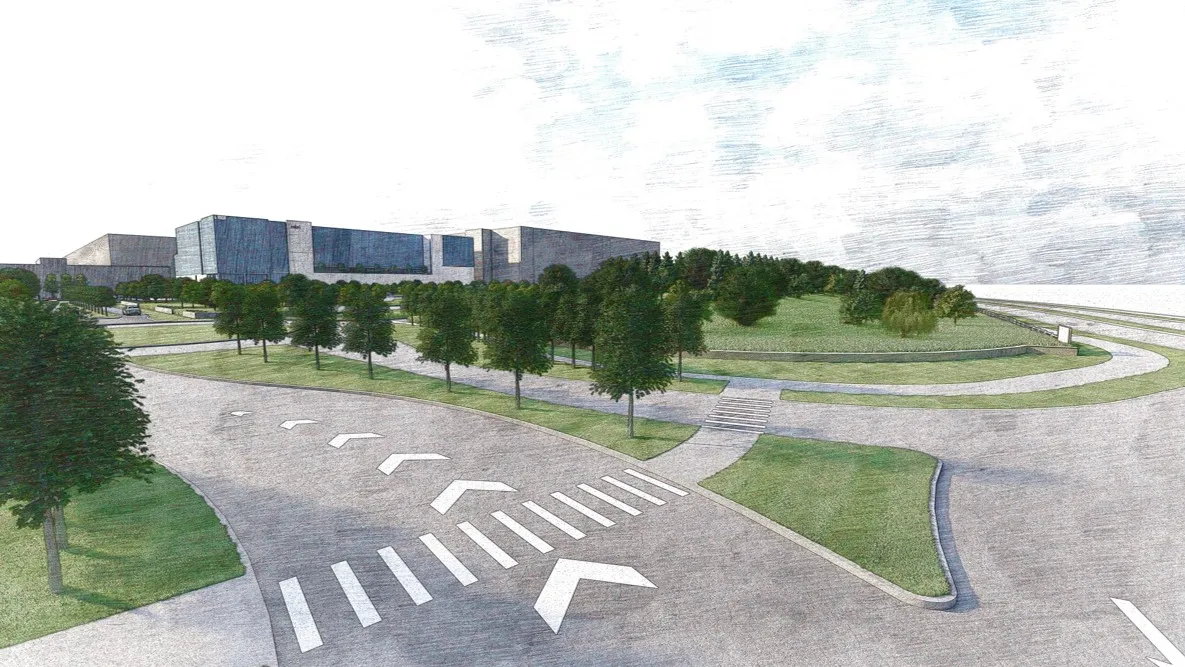
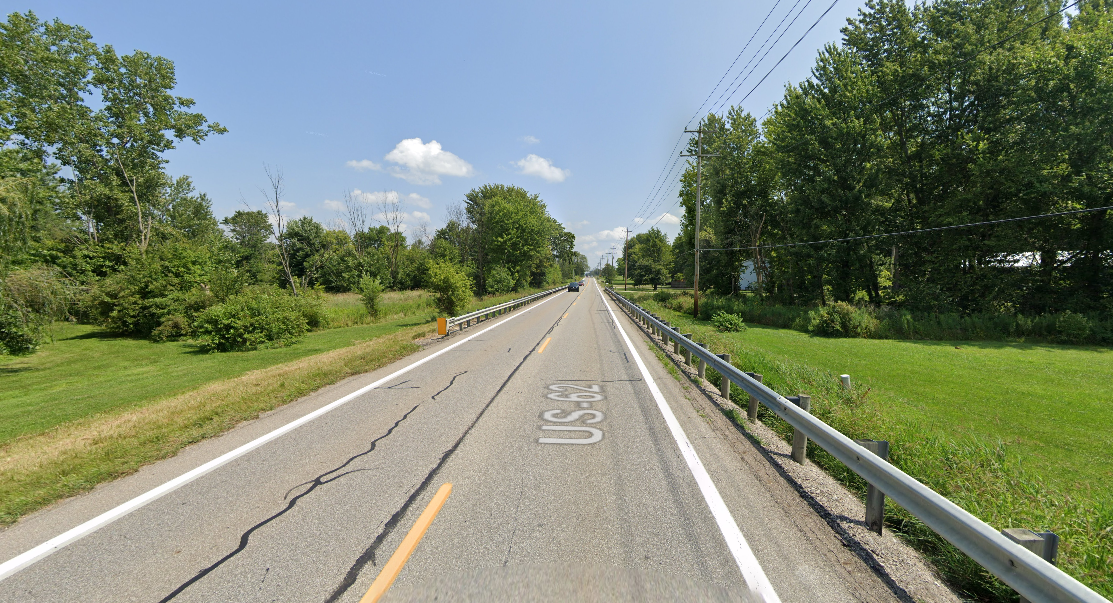
The Area Today The main Intel site is bounded by Green Chapel Road, Mink Street, Miller Road and Clover Valley Road, encompassing about 1,000 acres, but a larger expansion area is about 3x that size, as shown by the map below. This area is largely rural and almost entirely made up of farms. There is very little organized development between New Albany and Johnstown, which this site sits between. 2-lane Rt. 62, otherwise known as Johnstown-Utica Road, is the main connection between the two and runs just north of the Intel site.
How Rt. 62 looks today.
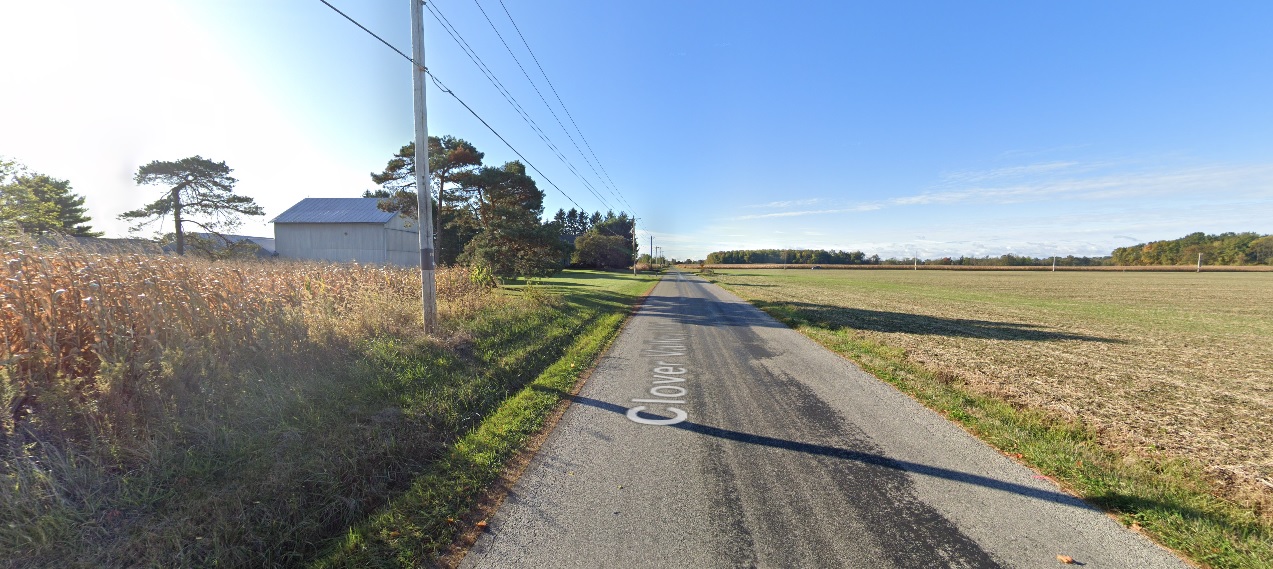
Clover Valley Road adjacent to the Intel site.
Planned/Ongoing Infrastructure Changes 2022-2023 -Jug Street between Beech Road and Clover Valley Road is being widened to 3 lanes. -Jug Street between Clover Valley Road and Mink Street will be widened, but still be 2 lanes. -Green Chapel Road between Rt. 62 and Clover Valley Road will be widened to 3 lanes. -Green Chapel Road between Clover Valley Road and Mink Street will be widened to 5 lanes. -Mink Street between 161 and Green Chapel Road will be widened to 5 lanes. 2024-2025 -Harrison Road between Clover Valley Road and Mink Street will be widened to 3 lanes and will be extended between Clover Valley Road and Jug Street. -Clover Valley Road will be widened to 3 lanes between Jug Street and Green Chapel Road. -Beech Road between Innovation Corridor Way and Jug Street will be widened to 5 lanes. -Beech Road between Jug Street and Rt. 62 will be widened to 3 lanes. -Miller Road between Beech Road and Clover Valley Road will be widened to 3 lanes.
Beyond these road changes, little of anything else is planned. Where Intel has made a presence in other communities in other states, unregulated sprawl seemed to be what mainly happened, but that doesn’t have to happen here. Here is a general outline of what could be.
Map Highlights -Rt. 62 becomes a mixed-use commercial, retail, restaurant and residential corridor along a tree-line boulevard capable of handling either bike or transit lanes (or both). Several other roads around the area also become boulevards. A “town center” of sorts could be created at the 4-way intersection in red, with mixed-use corridors in all 4 directions. South of 62, medium to high-density residential on a street grid would be the best use, while north of 62 would be more of a mixed-density residential development on a street grid. In both cases, the residential areas would be dotted with parks and playgrounds, corner shops, cafes and other amenities. The Intel site and surrounding area itself is already basically spoken for, with several areas of planned expansion, while further to the south, New Albany’s business park could see gradual expansion as well.
Now, none of this is more than a thought experiment. There is likely to be heavy NIMBY opposition by locals to any major development, let alone what would be considered a more urban and dense style. However, development is going to happen with or without local approval. The demand will be incredible and far too strong for it to be killed off entirely. All that opposition is likely to accomplish is to create all of the problems they think they’re trying to prevent. There are reasons to go with density and grids over not. Here are just a few of the advantages of a street-grid-based higher density plan:
1. Higher land values. Gridded street layouts tend to haver higher land values than sprawl. 2. Taxes. Gridded streets allow for the creation of higher densities, and as mentioned, higher land values. Cities and towns therefore get a much greater tax return than they would with sprawl. 3. Lower traffic. Gridded streets allow more connectivity between one street and another, and therefore provide more routes to choose from when attempting to avoid traffic. This allows for more traffic dispersal across the board. 4. Lower infrastructure costs. Higher densities allow infrastructure costs to be divided among a greater population, creating a lower general financial burden for residents, as well as local and state entities. 5. More adaptability. It is much easier and cheaper to rebuild along gridded streets than it is the winding streets in the average sprawled neighborhood. The infrastructure doesn’t need to be rebuilt to change development patterns. So low-density housing can be built on a grid initially and then gradually replaced with higher density residential or mixed-use depending on demand. 6. Better transit access. It is very difficult to build transit systems within a sprawled area. Winding roads prevent higher travel speeds for transit, making them inefficient and slow. These systems are also rarely, if ever, built during the initial creation of sprawled neighborhoods. Sprawl is not very adaptable to adding them later if the population density becomes significant enough in the future to support them. 7. Safer for pedestrians. Because gridded streets do such a better job at traffic dispersal, they can be narrower than say, your typical American stroad. As such, narrower streets tend to slow down traffic, lowering the risk of harm to pedestrians and bikers.
So the benefits are pretty clear, but will anyone see them? Johnstown’s government is currently a hot mess, New Albany- which at least has a bit of a track record in planning- doesn’t own any of the land, and neither have hinted whatsoever that they’d even be interested in coming up with a plan. Few, if any, of the developers buying up property have any sort of track record outside of sprawl. Enormous changes are coming for this area, and for Central Ohio as a whole. It’s going to take forward-thinking leadership to step up- and soon- before it’s too late.