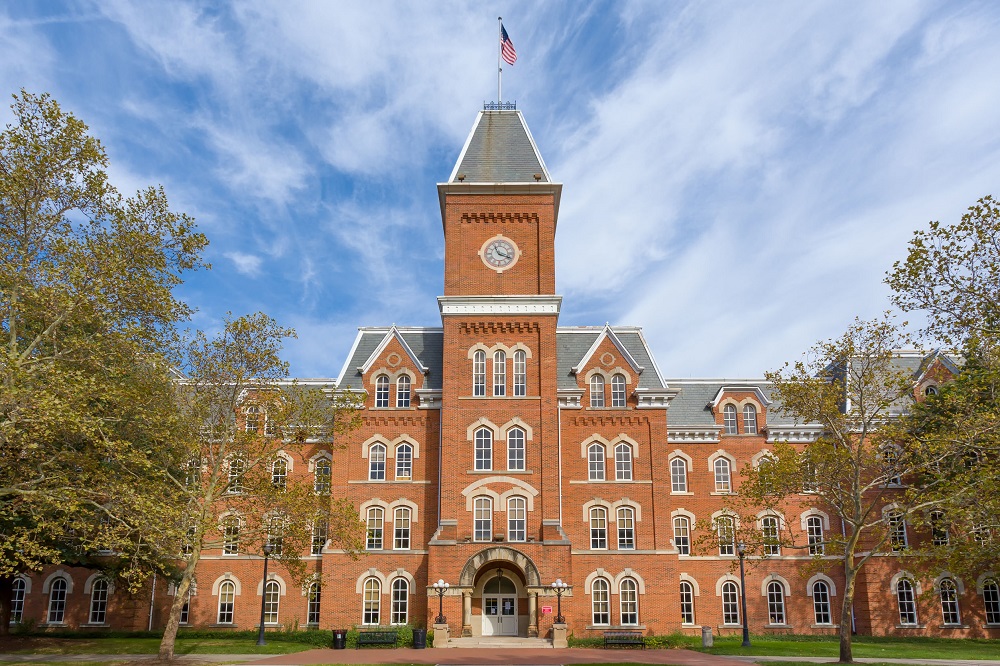
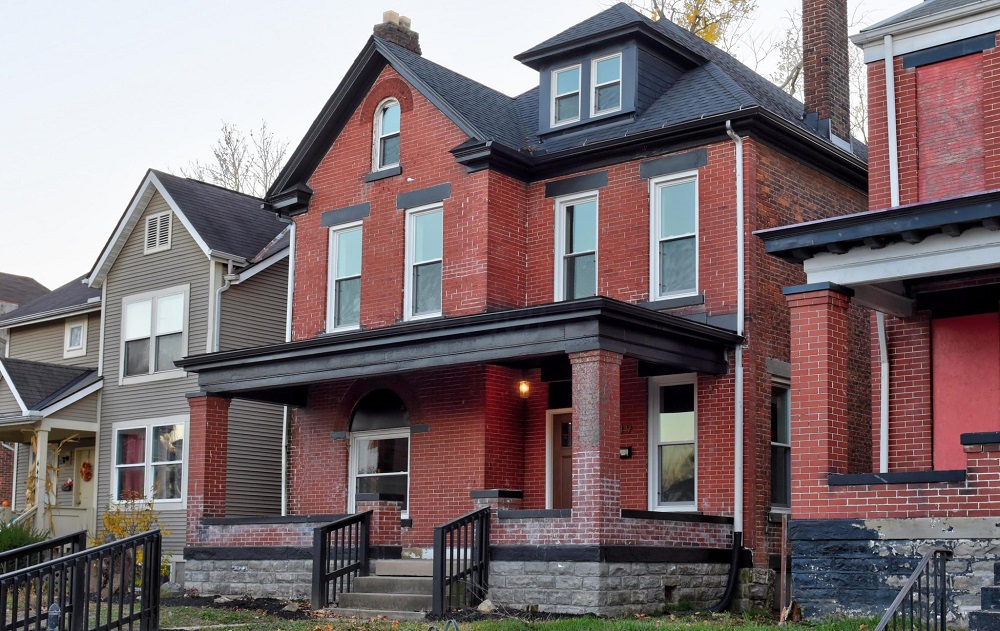
In this short installment of Strange Columbus, we talk about the 1955 OSU Explosion that occurred early on the morning of Thursday, January 6th. The event happened at the War Research Building on Ohio State’s main campus. Half a pound of pyridine exploded during an experiment, though there were no injuries as the lab was unoccupied at the time of the explosion. The blast shattered four windows on the 2nd floor of the building, and generally caused a mess in the lab itself. However, because no fire occurred during the event, damage was described as light. Several pieces of lab equipment were sent to the Columbus Fire Department to be checked out for further danger, but the event was labeled a freak accident. It went unmentioned in the local news as to the nature of the experiment and why explosive materials were being used. The exact building this occurred in seems unclear, as old articles do not mention the location. Unfortunately, this event would be far from the last in terms of university lab accidents.
Columbus has far less explosive history to discover.
The Housing Market Update November 2022 data from Columbus Realtors showed home sales were down nearly 30% from a year ago, and new listings decreased nearly as much. However, prices remained on their trajectory upwards across the metro area.
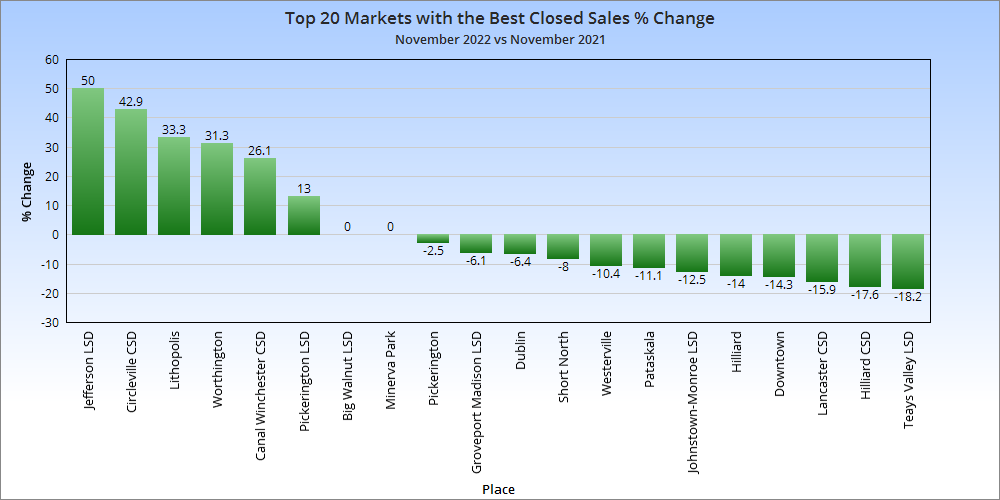
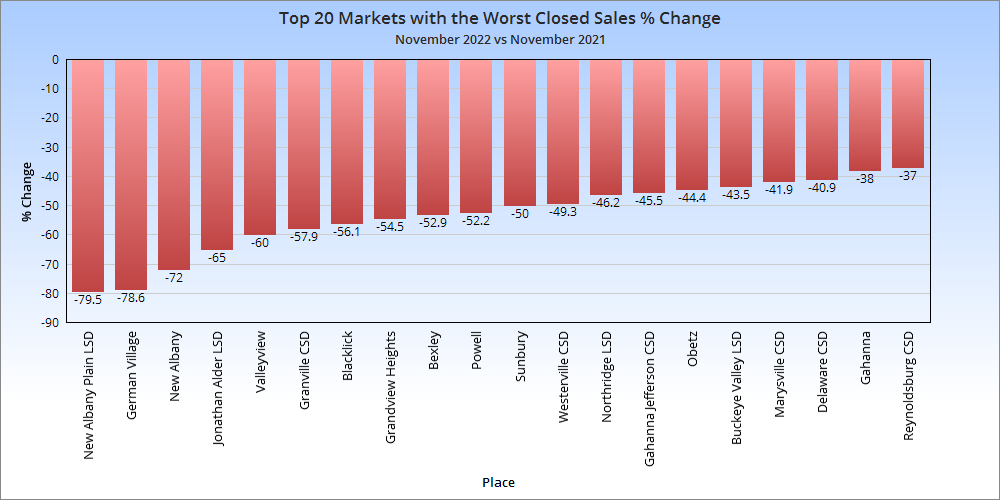
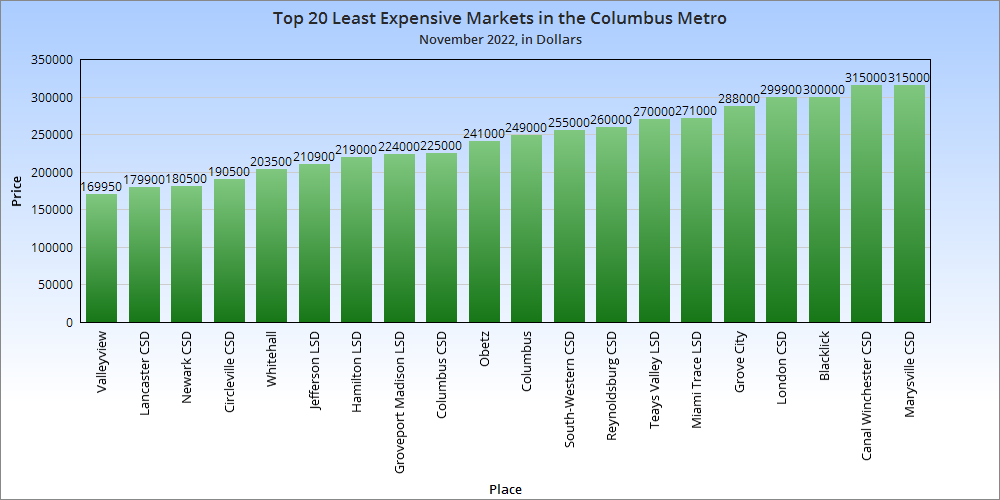
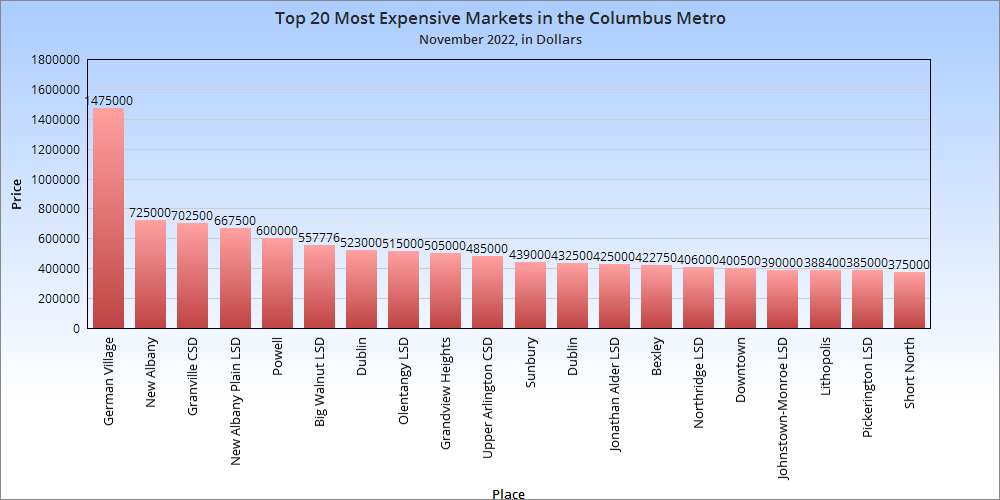
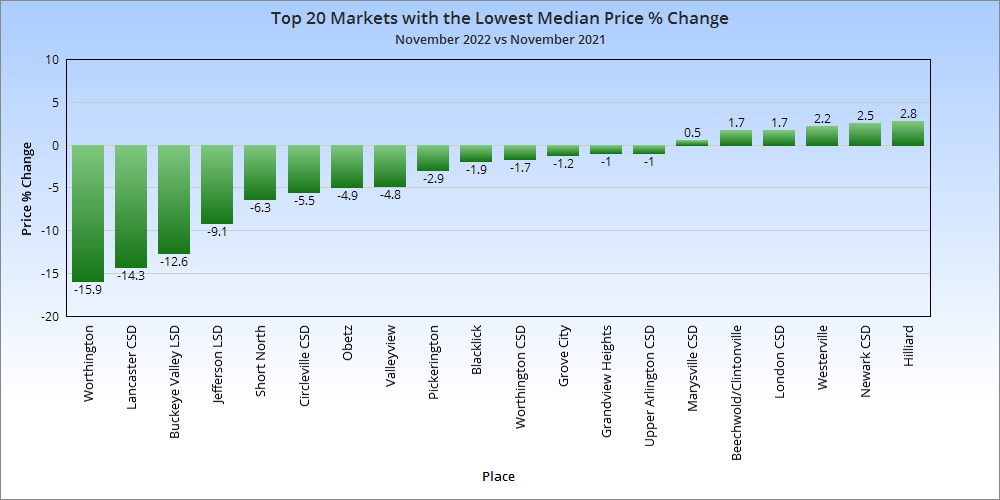
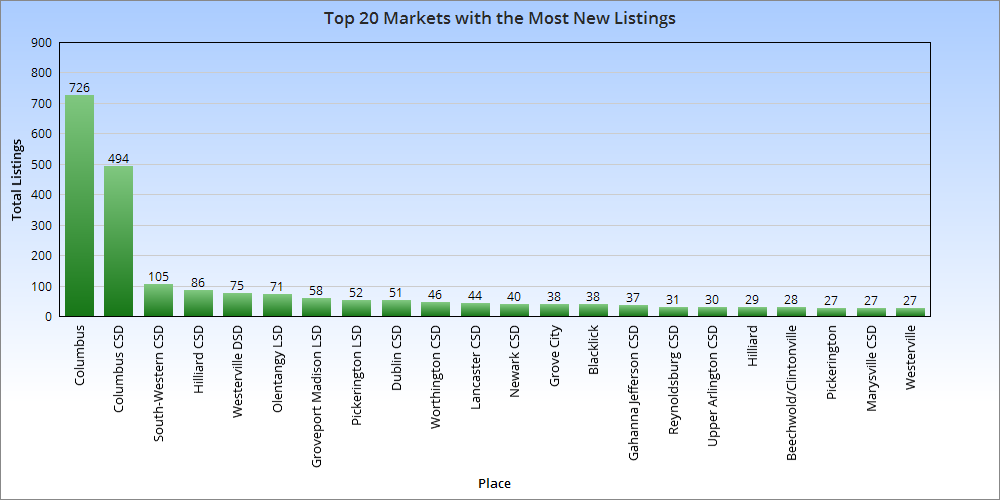
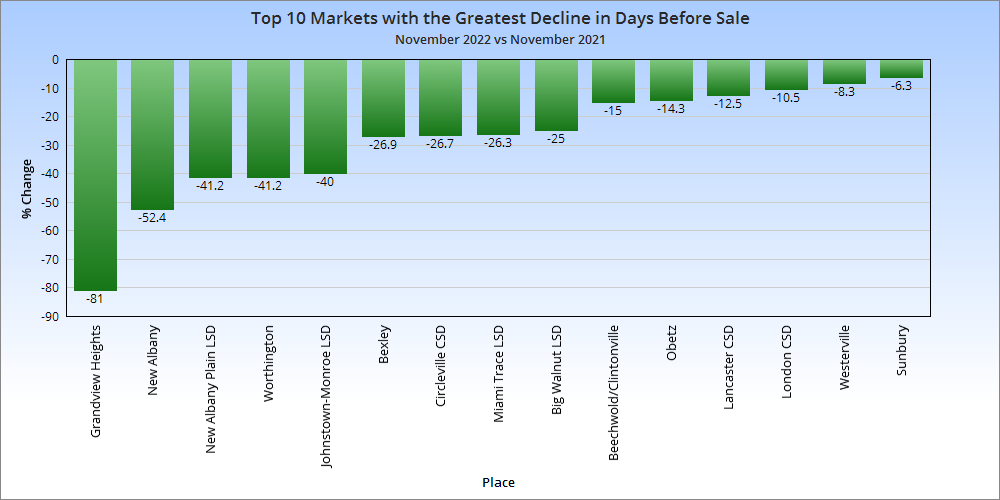
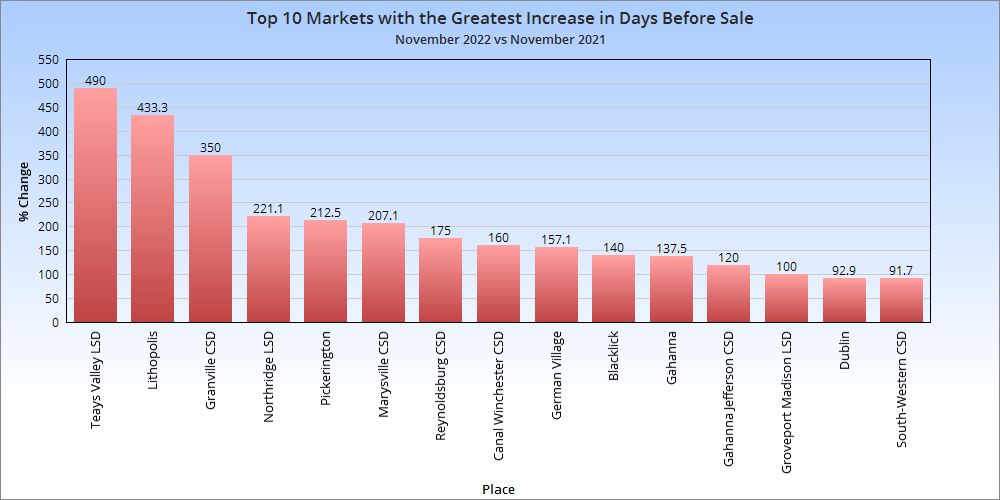
Note: LSD= Local School District, CSD= City School District. In both cases, school district boundaries differ from city boundaries.
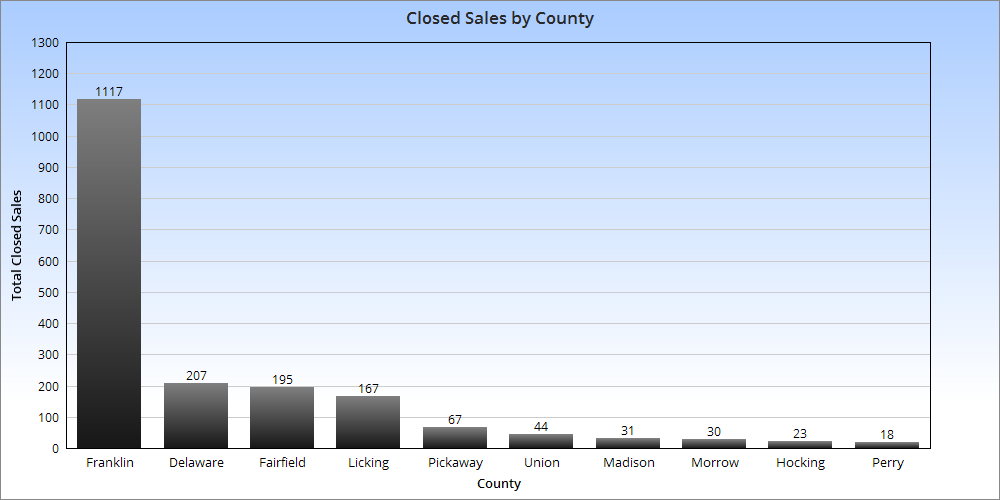
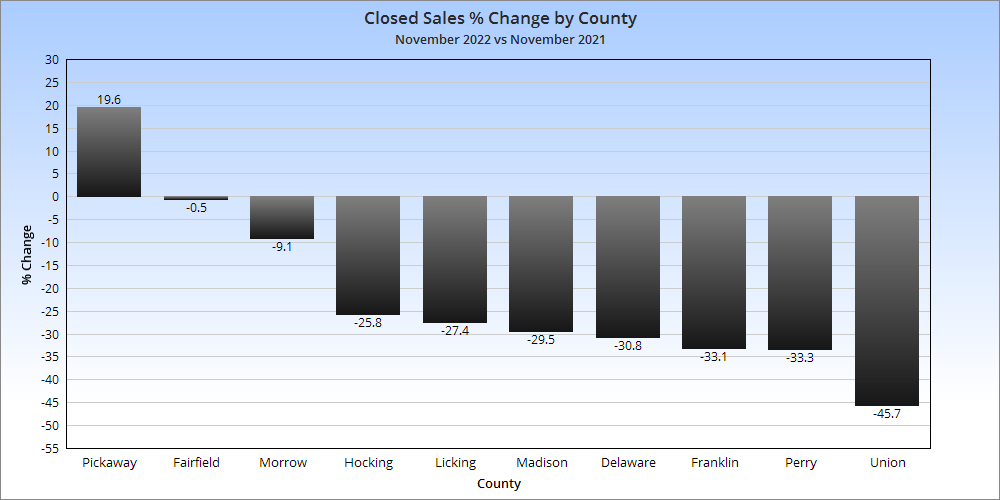
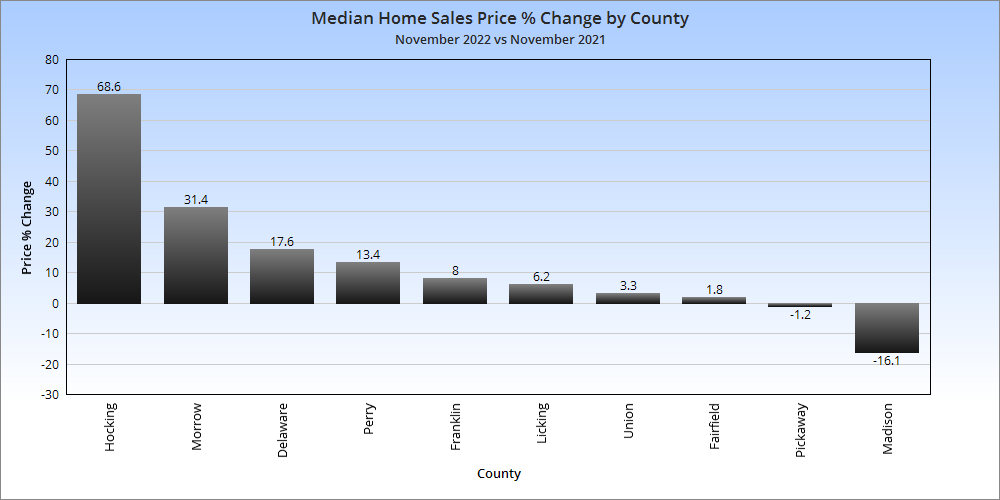
Closed sales are those sales that were completed during the month. 9 of the 10 metro counties saw declines, with 8 of them being fairly significant. Few markets were up year-over-year. The worst-performing were mostly among the metro’s most expensive areas, but there were a few standouts otherwise.
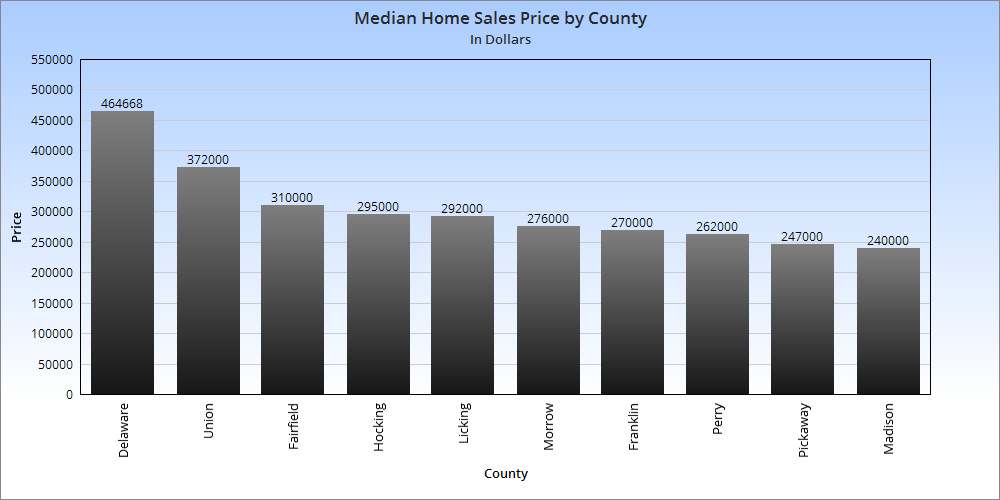
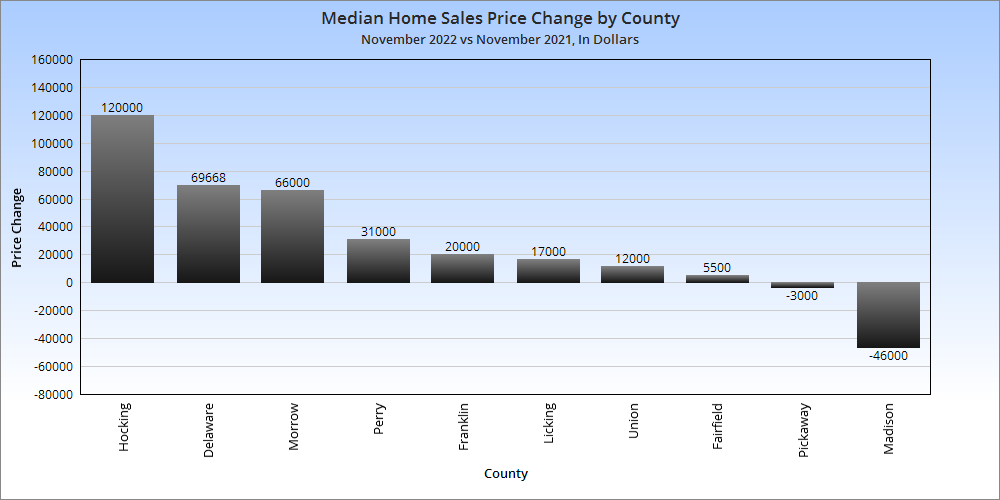
No real surprises except that the greatest increases were in the far southeast metro counties, but that could be because of working with a small supply. Overall Market Median Sales Price in November 2022: $302,867 Based on the 10 Columbus Metro Area counties, the metro price saw a more than $29,000 increase over November, 2021. Overall Market Median Sales Price % Change in November, 2022 versus November, 2021: +10.1% Despite the relative collapse in home sales, prices continued to rise by more than 10% year-over-year.
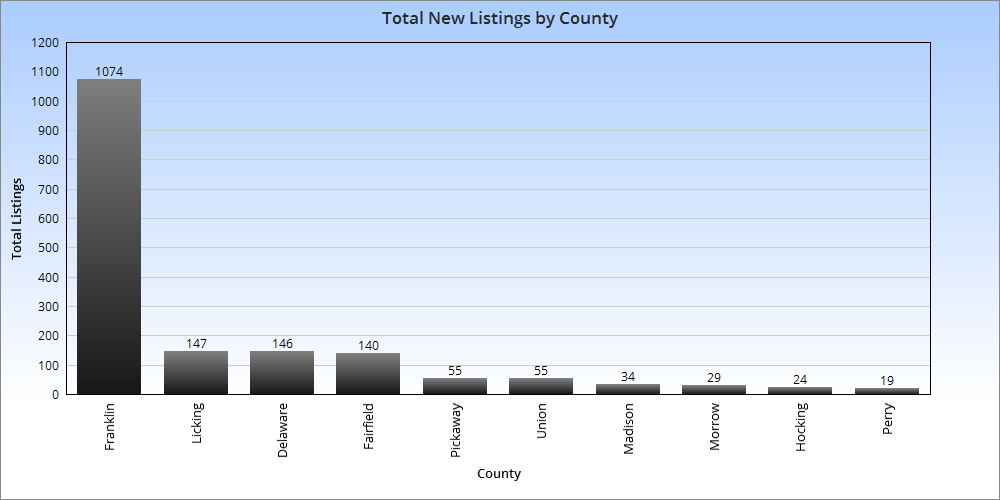
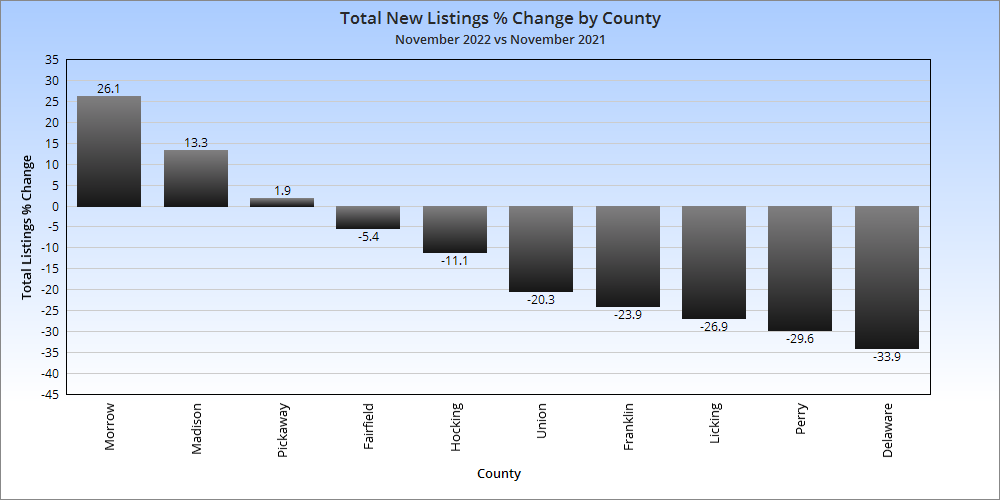
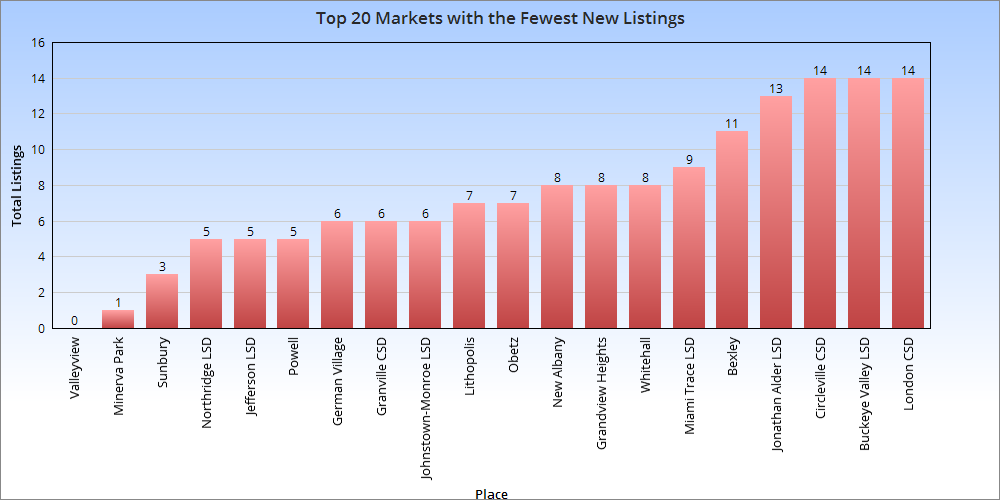
Most counties saw new listing totals drop year-over-year. This may have helped keep prices going up as demand hasn’t evaporated. Total Metro New Listings in November, 2022: 1,723 Total Metro New Listings Change from November, 2021 to November, 2022: -489
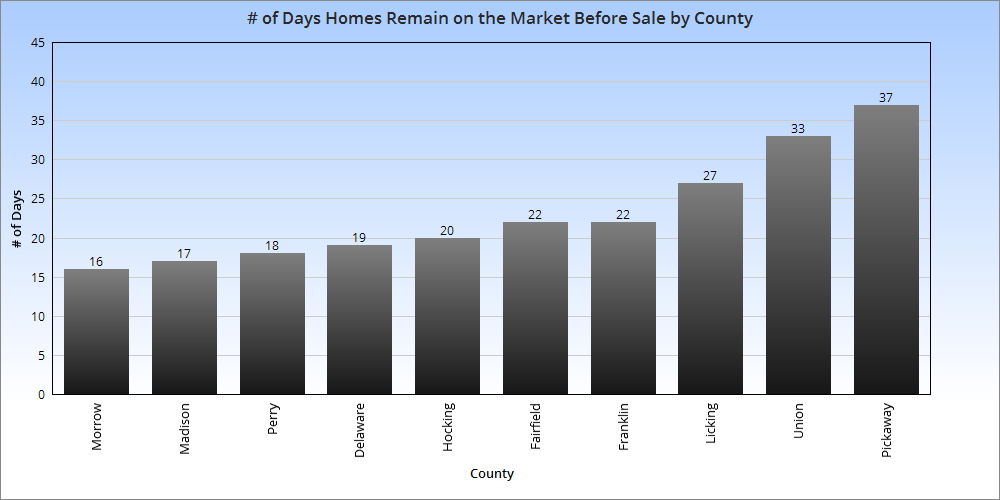
Average # of Days Homes Remain on the Market Before Sale for the Metro Overall in November, 2022: 23.1 # of Days Homes Remain on the Market Before Sale for the Metro November, 2021 vs. November, 2022: +10.5 Homes sold more slowly around the Columbus metro, but only by a few days. The rate of sale is still historically fast.
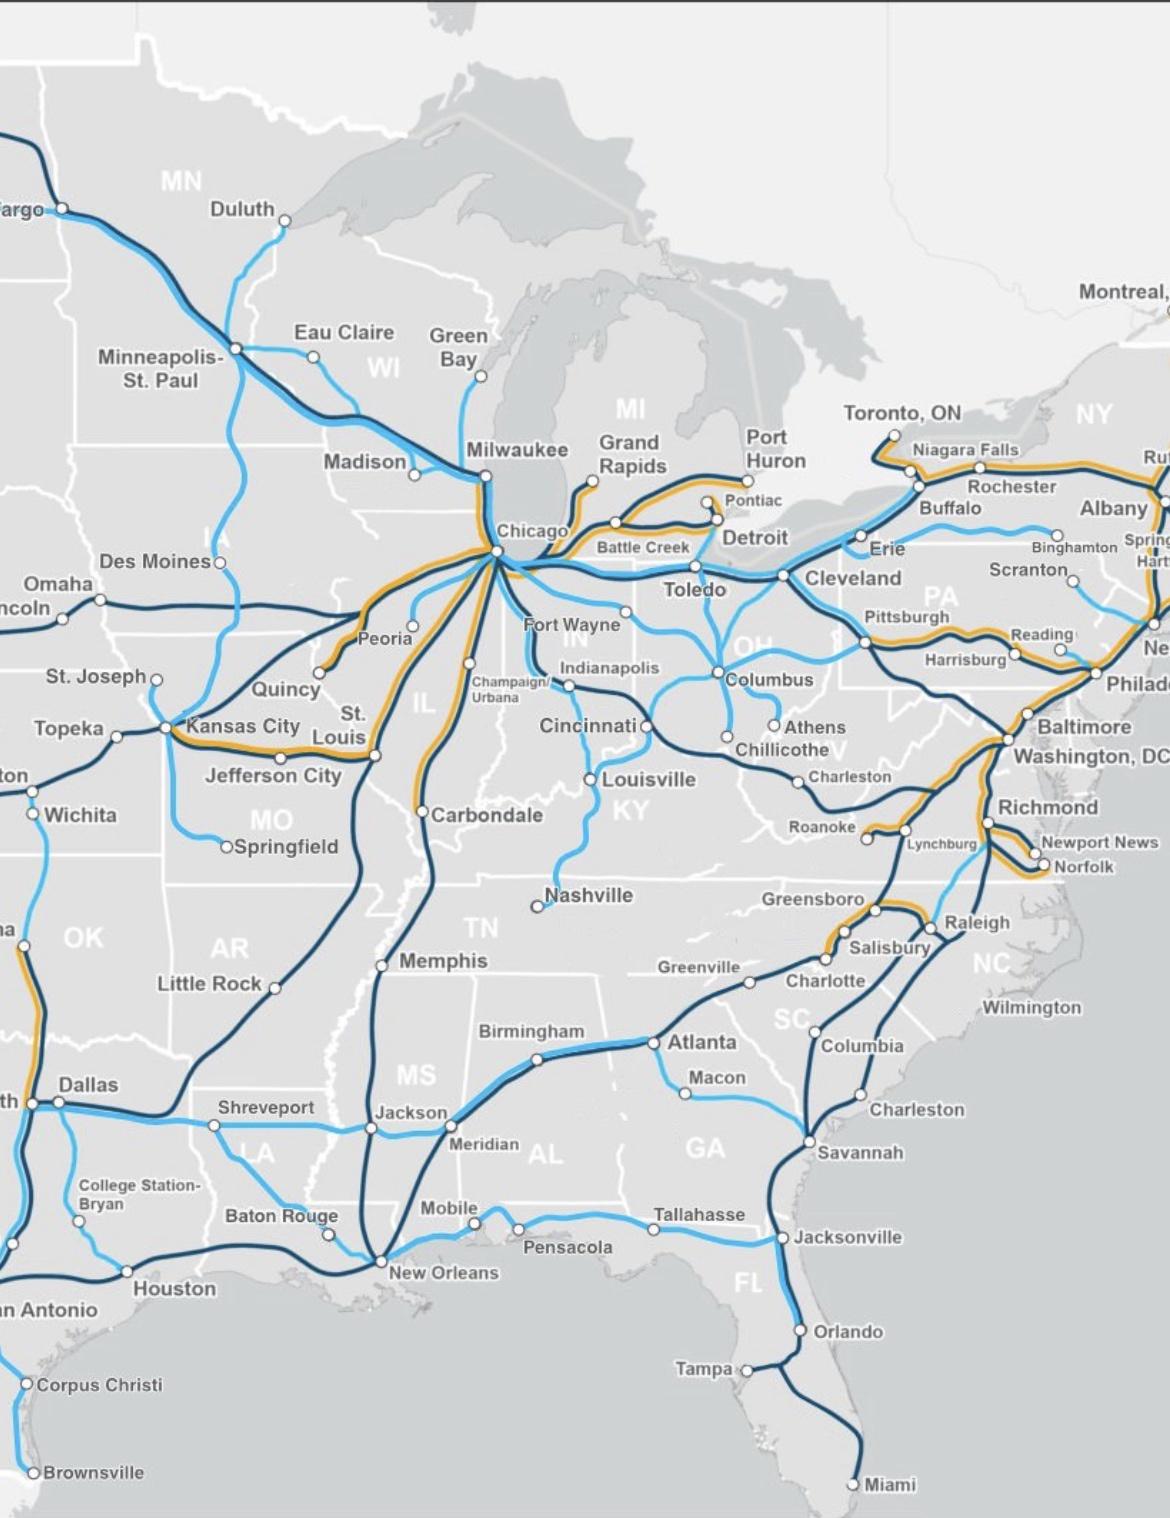
In the Spring of 2021, I wrote about Amtrak’s proposal to bring passenger rail back to Columbus as part of its ConnectUS plan. That original plan included Columbus in just one route- the long-sought-after Cleveland-Columbus-Dayton-Cincinnati route, otherwise known as the 3-C Corridor. In my article, my view was that this plan was far too limiting for Columbus. That its growth and location suited the city for much better local and regional connections. Now, Amtrak is calling for Columbus to be a rail hub, complete with multiple routes and connections that rival those found in Chicago.
Here is the original map from last year:
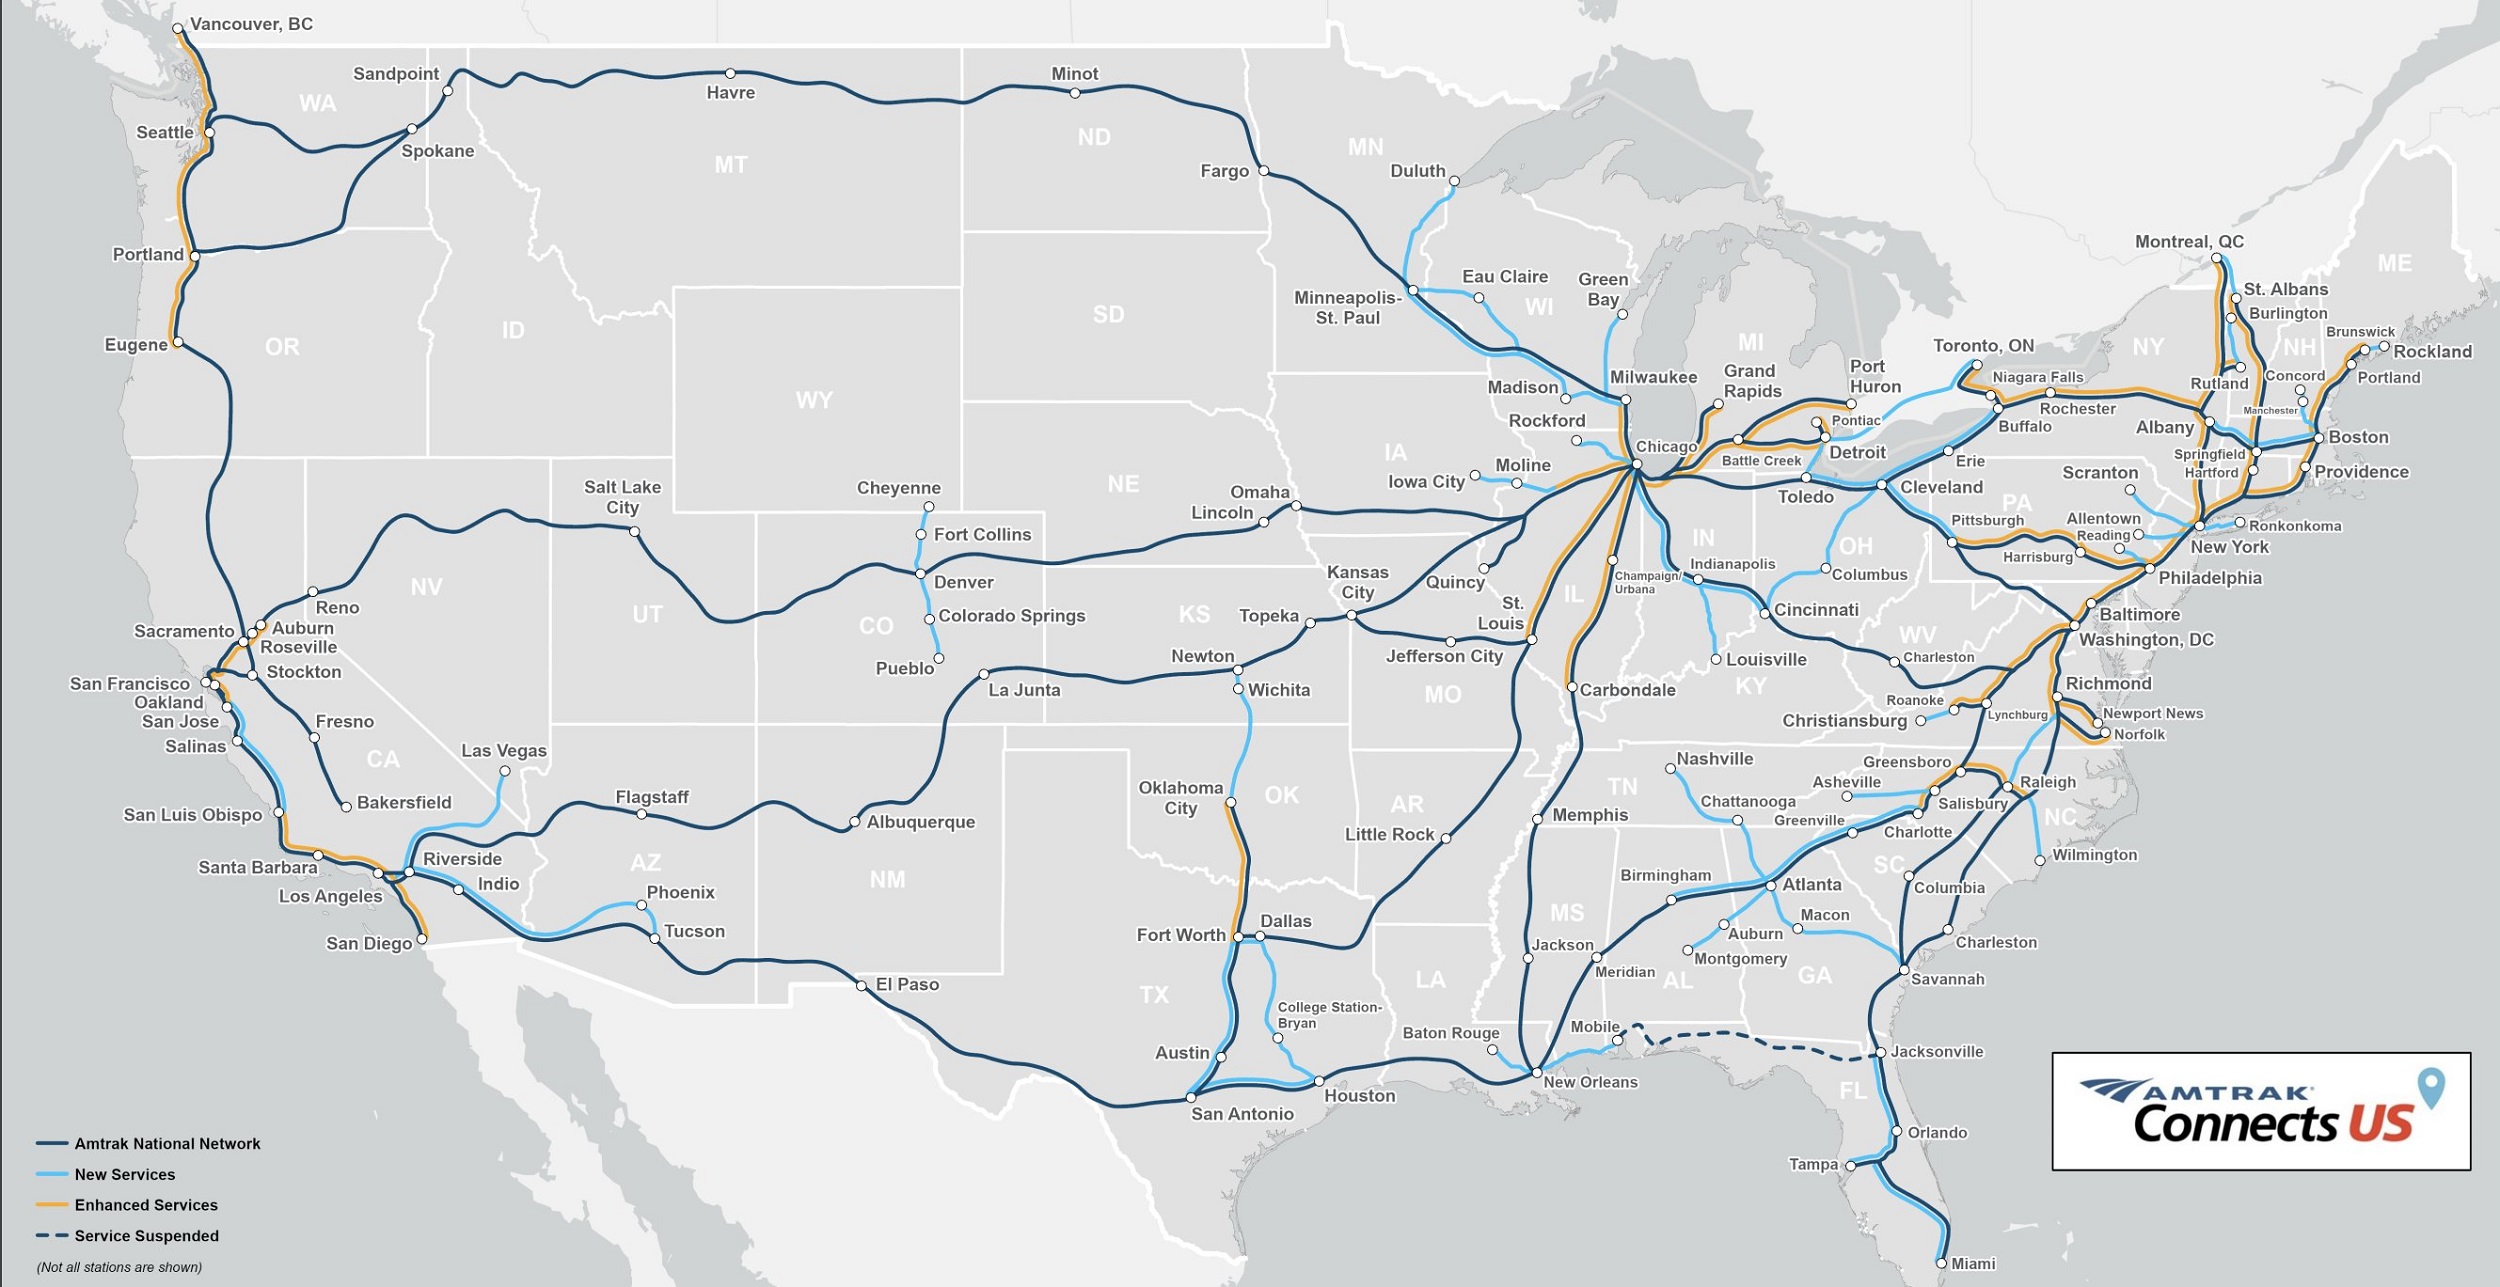
And here is the updated version, recently released:
In the new plan, the Cleveland-Columbus-Dayton-Cincinnati route is maintained, but the following routes would be brand new: Columbus-Chillicothe Columbus-Athens Columbus-Toledo-Detroit Columbus-Pittsburgh Columbus-Fort Wayne-Chicago Louisville-Nashville would be an extension of the Columbus-Dayton-Cincinnati route. So overall, Columbus residents would have direct connections to 12 different cities. Of course, many of those cities would have their own routes, so Columbus residents would have rail access to large parts of the country under the plan.
The timeline for completion is tentatively for 2035. Most of the proposed routes already have existing rail lines, so it would come down to funding any necessary upgrades along with buying the trains, etc. Whether any of these routes are ever actually built and opened remains to be seen, though. Passenger rail, unlike in most of the world, is politically controversial in the US, and public transit remains deeply underfunded and underbuilt in every part of the nation arguably outside of the New York and Northeast Corridor.
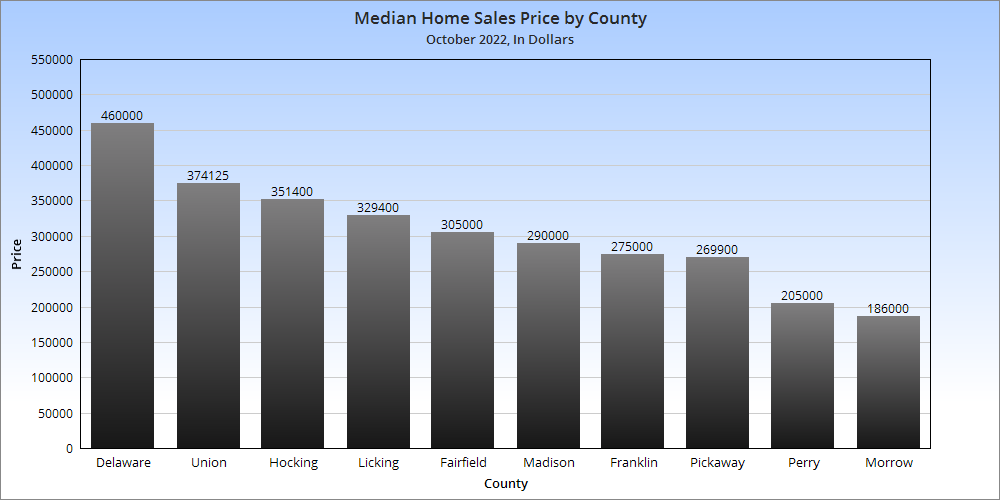
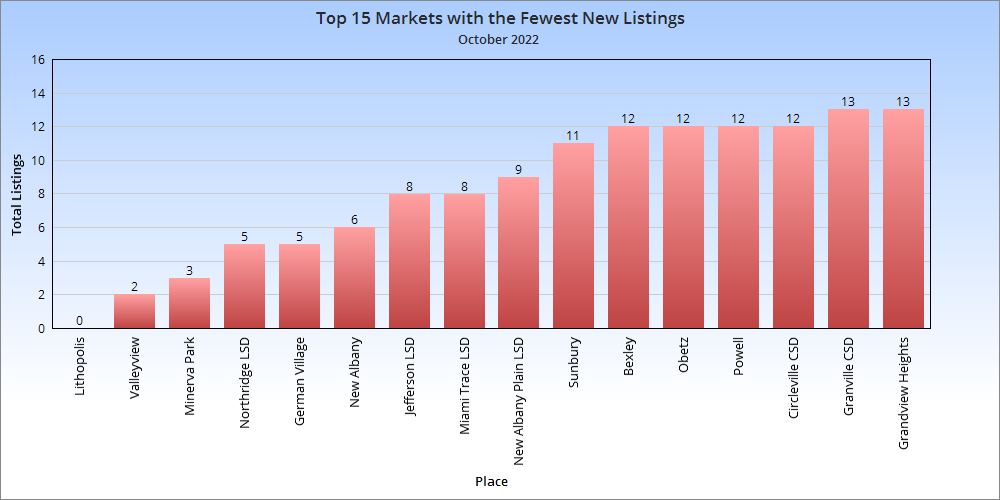
The Housing Market Update October 2022 data from Columbus Realtors showed a significant slowdown in home sales, but that it didn’t mean homes got cheaper in the process.
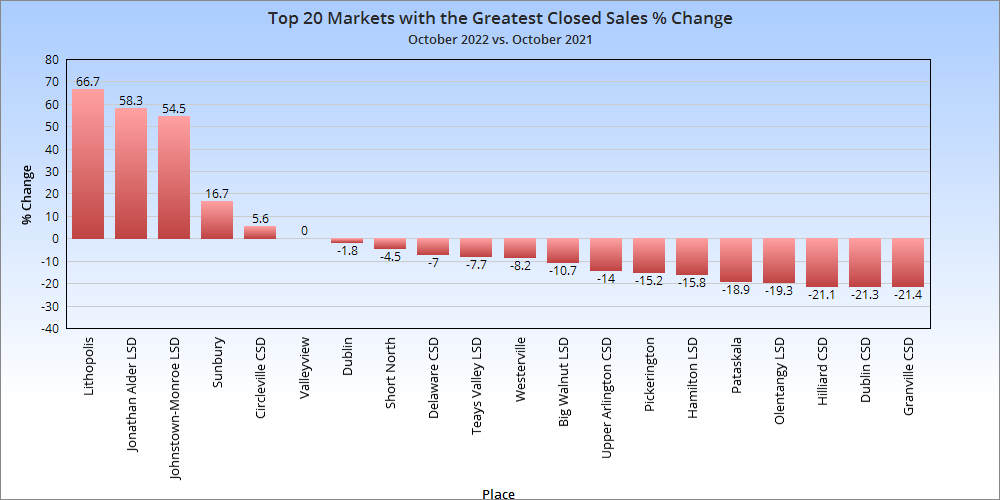
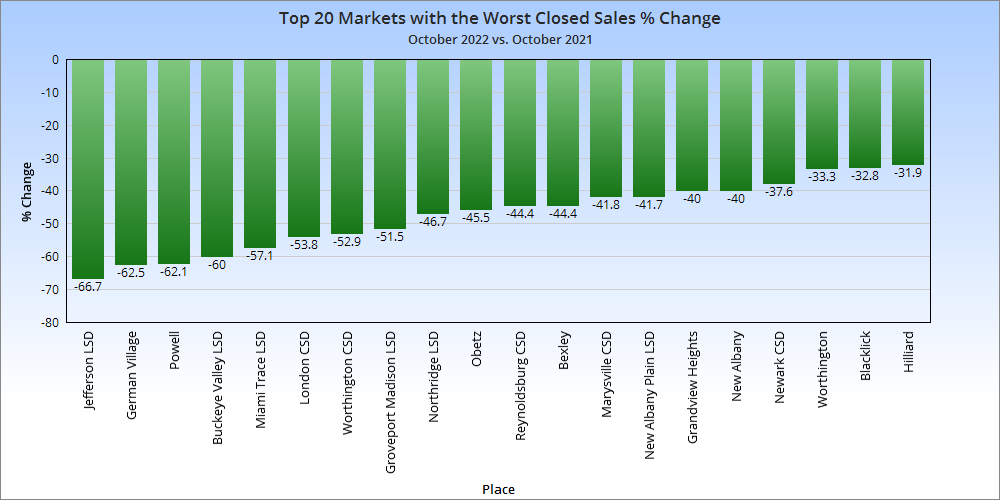
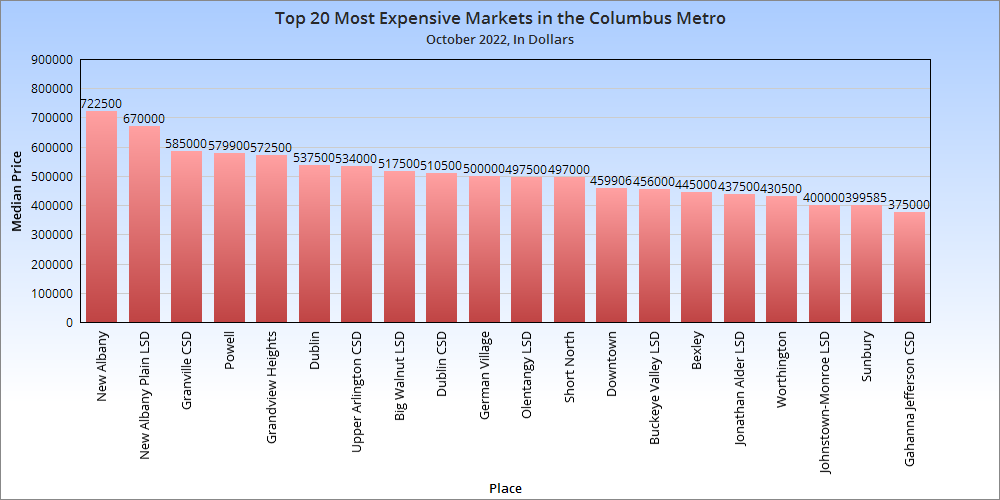
Note: LSD= Local School District, CSD= City School District. In both cases, school district boundaries differ from city boundaries.
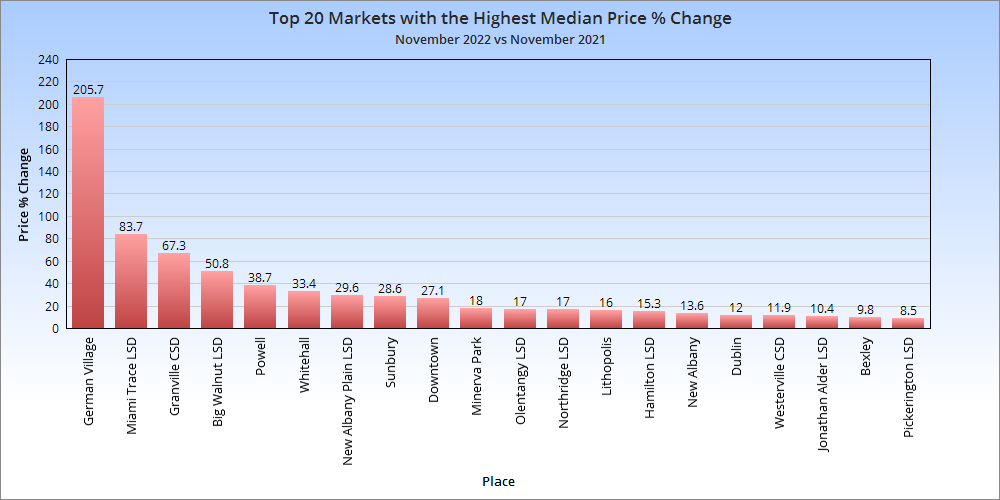
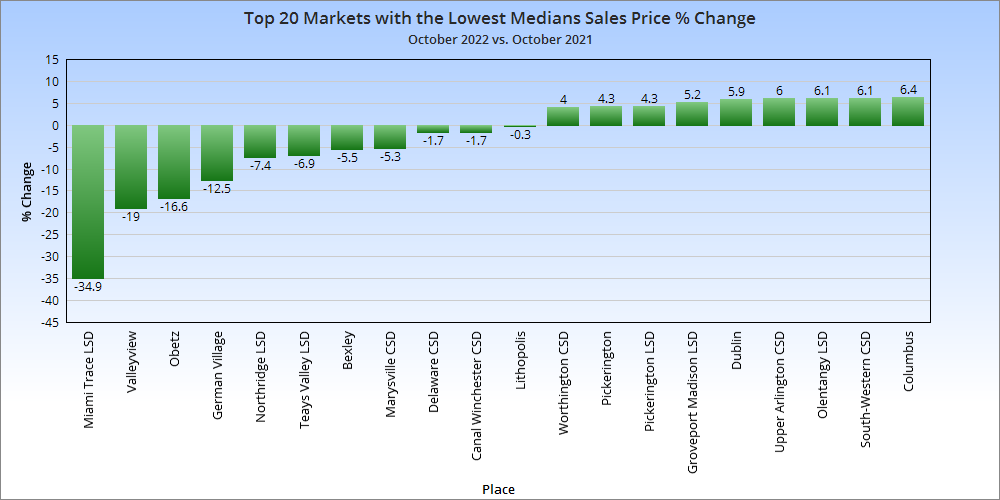
Closed sales are those sales that were completed during the month. They dropped significantly in most counties year-over-year as rising interest rates slowed the white-hot market. But what markets slowed down the most? Only a handful of markets saw an increase, including Johnstown, which is presumably seeing movement due to the Intel project. Most places on this list tended to be among the most expensive local markets, but not all.
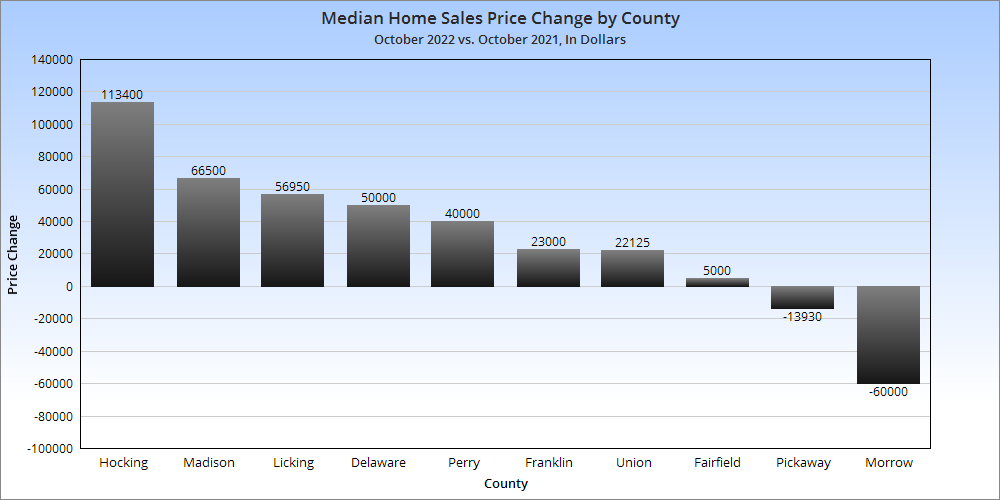
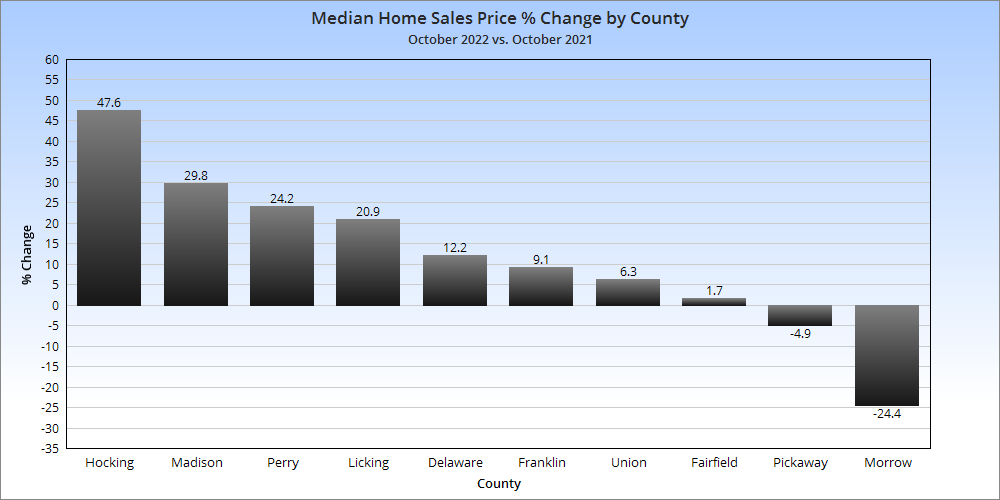
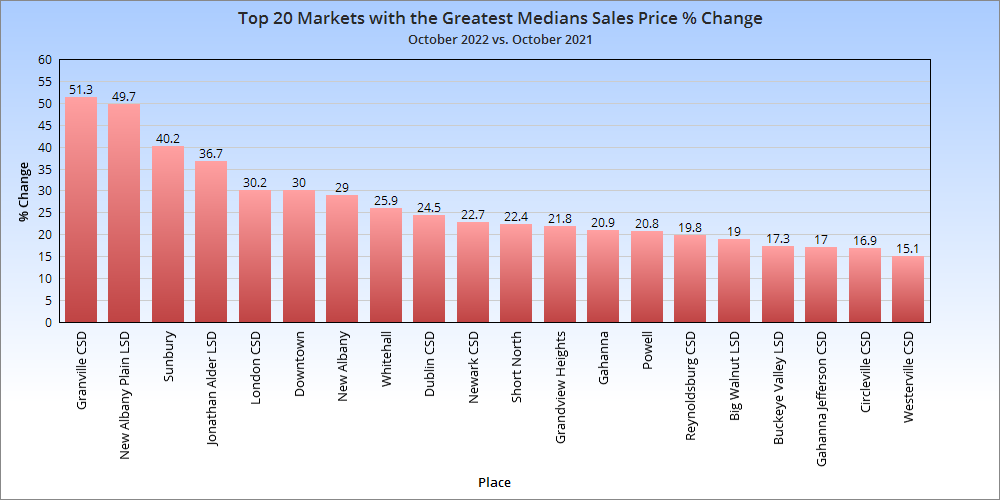
Most counties continued to see price increases, though some were much more modest than others. Franklin County was in the middle of the pack.
Overall Market Median Sales Price in October 2022: $304,583 Based on the 10 Columbus Metro Area counties, the metro price saw about a $12,000 increase vs September, 2022 and a more than $30,000 increase over October, 2021. Overall Market Median Sales Price % Change in October, 2022 versus October, 2021: +10.6%
Now let’s take a look at individual neighborhoods and places within the metro area.
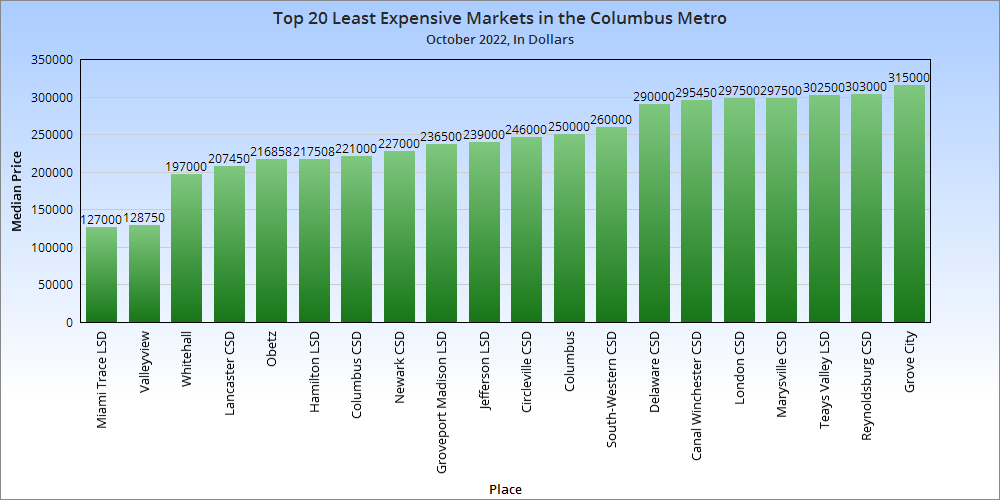
There are few surprises on this chart.
Only 3 markets had a median price below $200,000, 2 of which were within I-270.
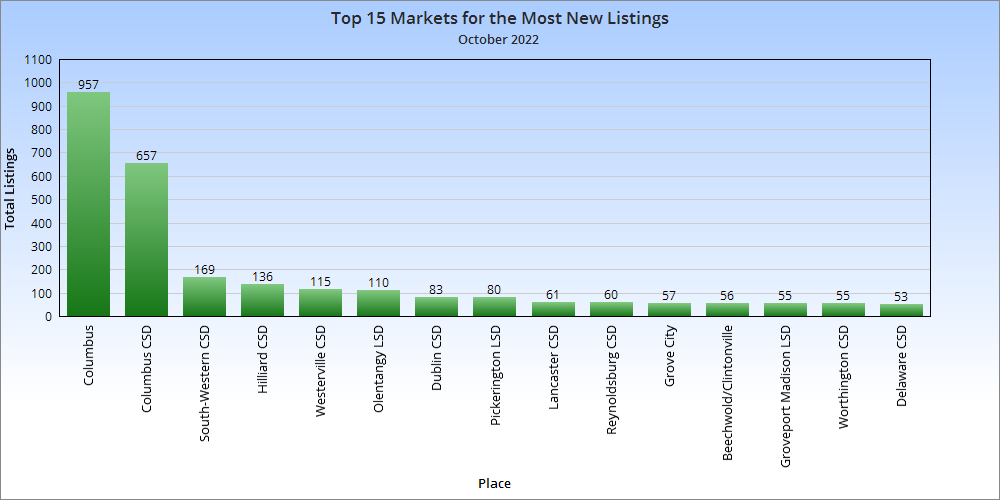
Most counties saw new listing totals drop year-over-year. This is one of the reasons prices remained higher despite large sales drops.
Total Metro New Listings in October, 2022: 2,401 Total Metro New Listings Change from October, 2021 to October, 2022: -497 Year-over-year, new listings were down yet again.
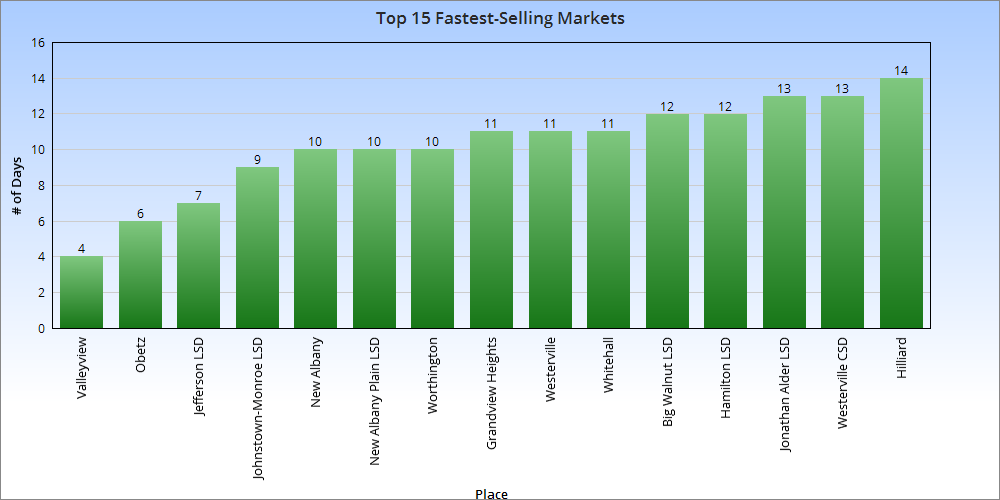
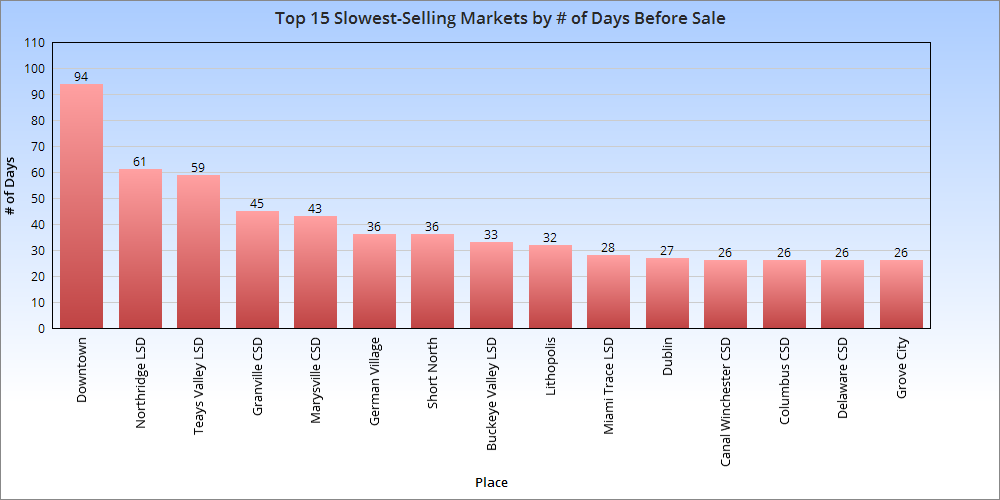
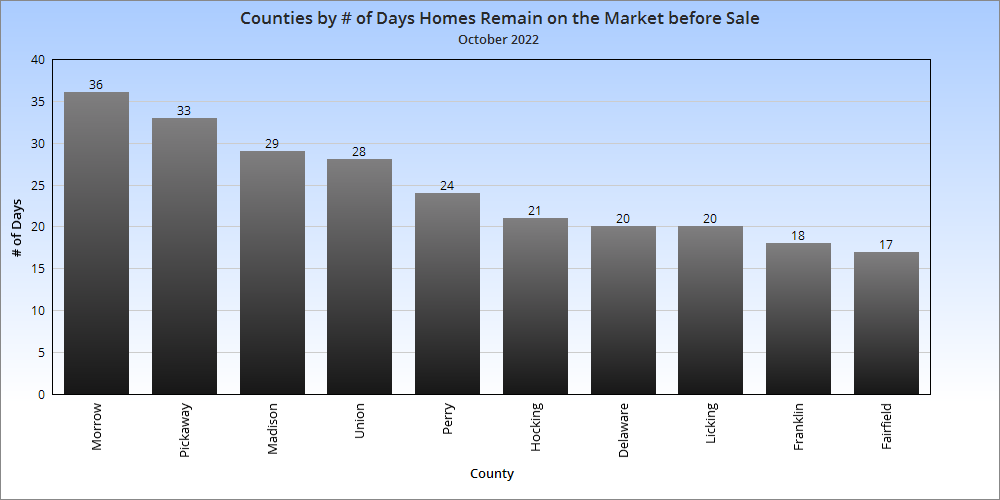
Average # of Days Homes Remain on the Market Before Sale for the Metro Overall in October, 2022: 24.6 # of Days Homes Remain on the Market Before Sale for the Metro October, 2021 vs. October, 2022: +8.2 Homes across the market sold more than a week more slowly year-over year in October.
Aside from the half-dozen markets that saw declines, most saw fairly significantly increases in the number of days before sale year-over year.
Overall, the October housing market showed strong signs of a slowdown, but so far, this hasn’t prevented further price increases. Demand for homes seems to be continuing to outpace supply, but perhaps not quite to the level it was earlier in the year.
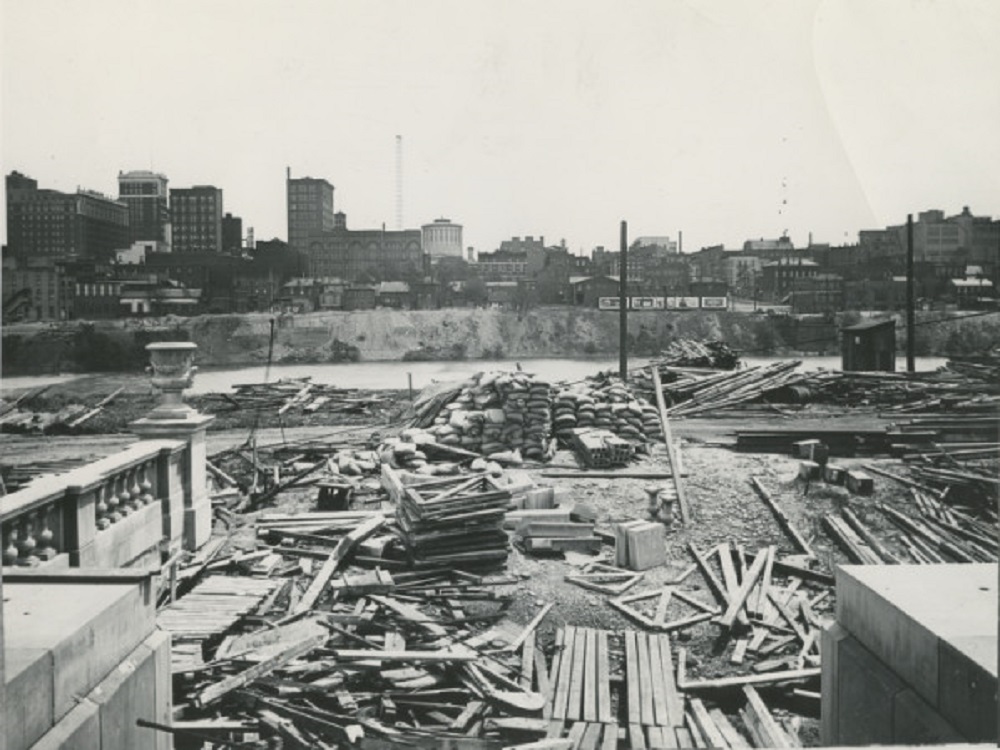
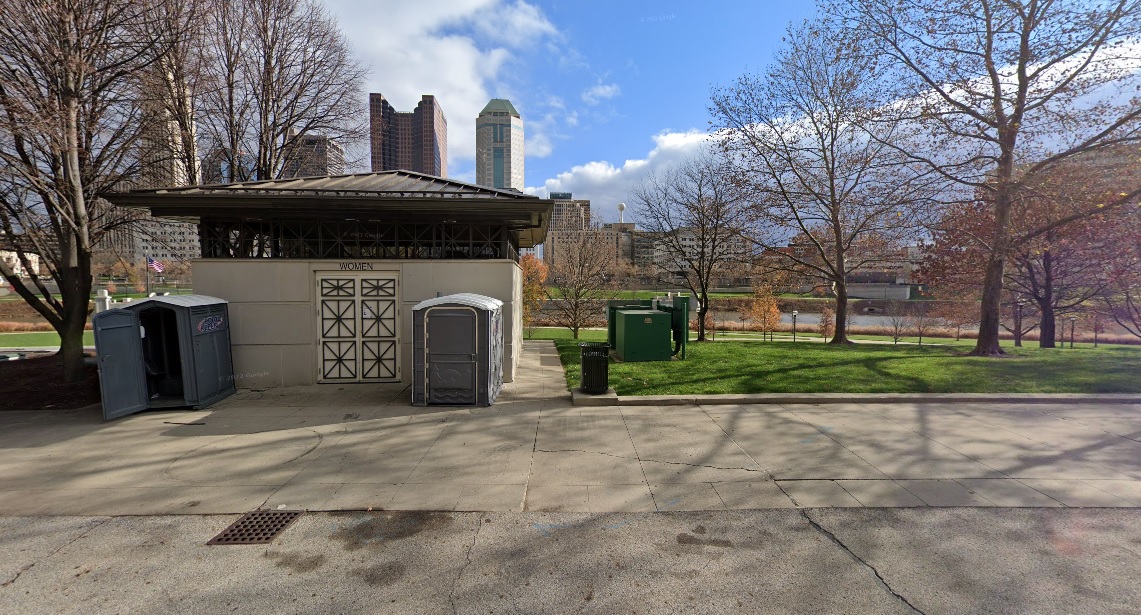
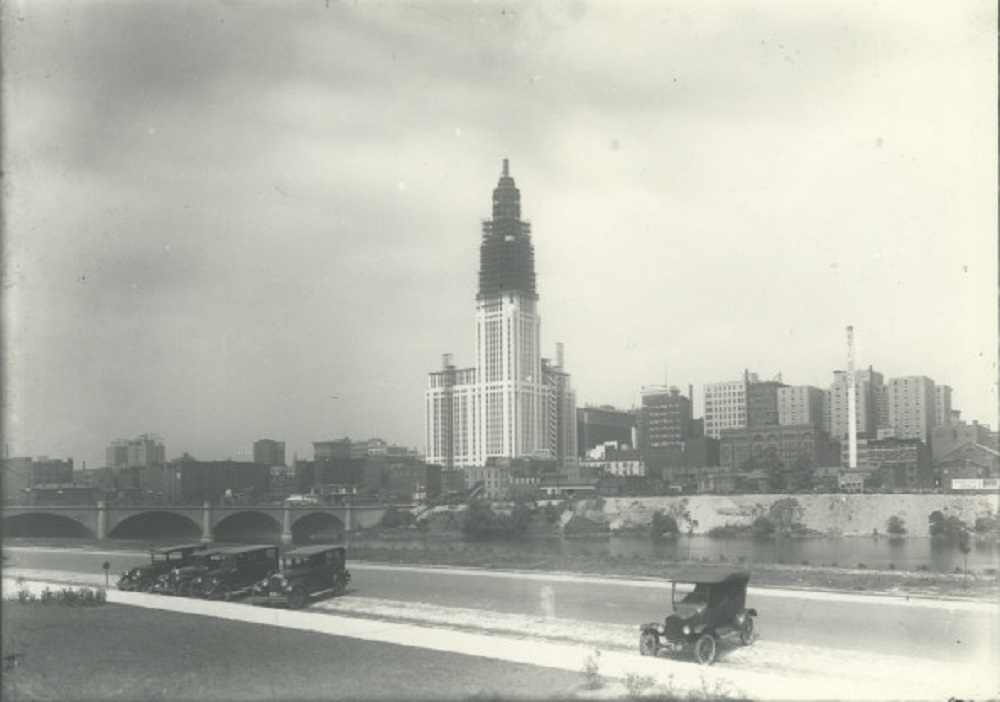
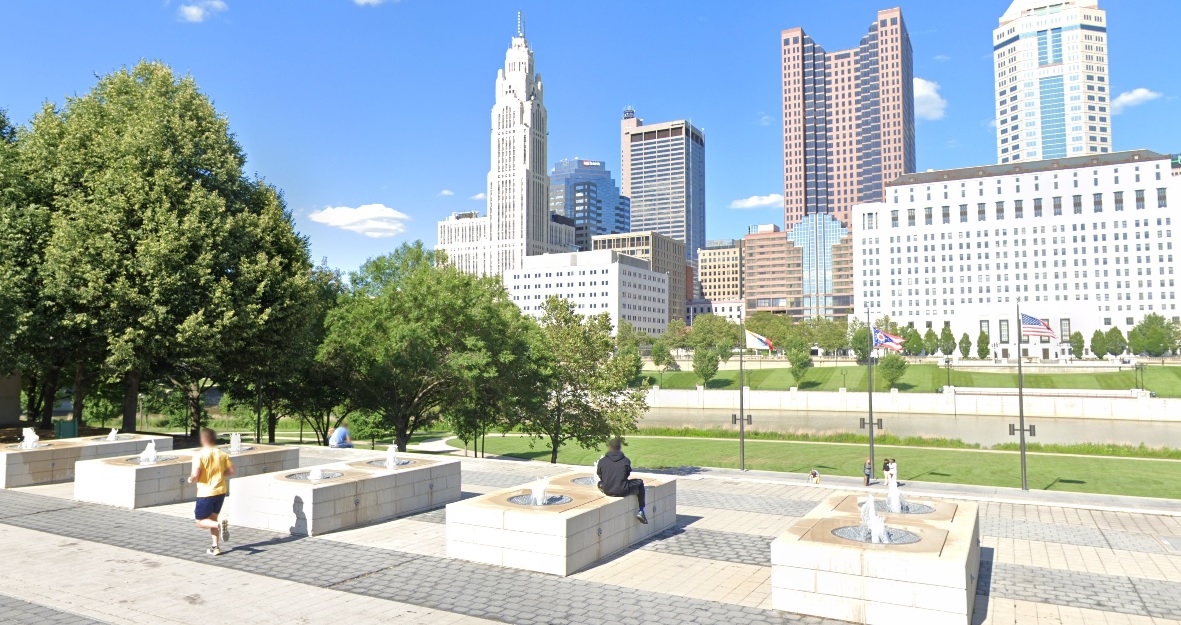
These before and after views from Franklinton show a snapshot in time of just how unattractive and people-unfriendly the riverfront once was.
Before: 1923 This view looks east from the Franklinton side of the Scioto River. At the time, Central High School was under construction, which is why the area looks like such a mess of materials. Central High School would be completed in 1924 and open on September 4th of that year. The school would remain open for 60 years before being shut down in the mid-1980s. The building sat empty for more than a decade before being renovated into the new COSI. Beyond the river, a much shorter Downtown skyline can be seen. The image predates LeVeque Tower and most of the government buildings that now line the Scioto’s shores.
After: 2020 The riverfront looks much different today. With the Scioto Greenways and park space added in more recent years, the view is much more pleasant, the bathroom not included.
Before: 1926 In an image taken just 3 years after the one above, the Franklinton side of the riverfront looks much better. Additionally, LeVeque Tower is now well under construction. After: 2021 In the modern view, the parking and cars have been replaced with parklands and public space, while LeVeque has become the city’s most iconic skyline addition.
If you enjoy this series, the Historic Building Database page offers thousands of before and after photos of historic buildings and places in and around Columbus.