First up is a link to a story on the growing housing crisis across Ohio, with a focus on the Columbus area. https://kevinverhoff.com/index.php/2020/02/13/ohios-housing-crisis/ The article uses an interesting metric to quantify just how bad the housing shortage is in counties across the state- the number of jobs versus the number of available housing units. In Columbus, there is only about 0.7 units per 1 job, leading to a Central Ohio shortage of more than 200,000 units!
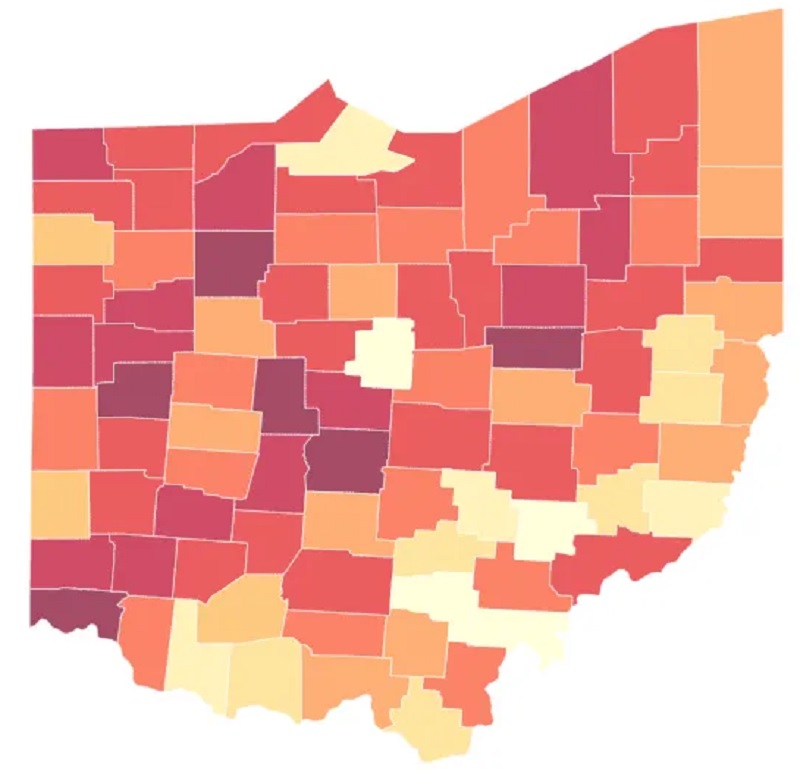
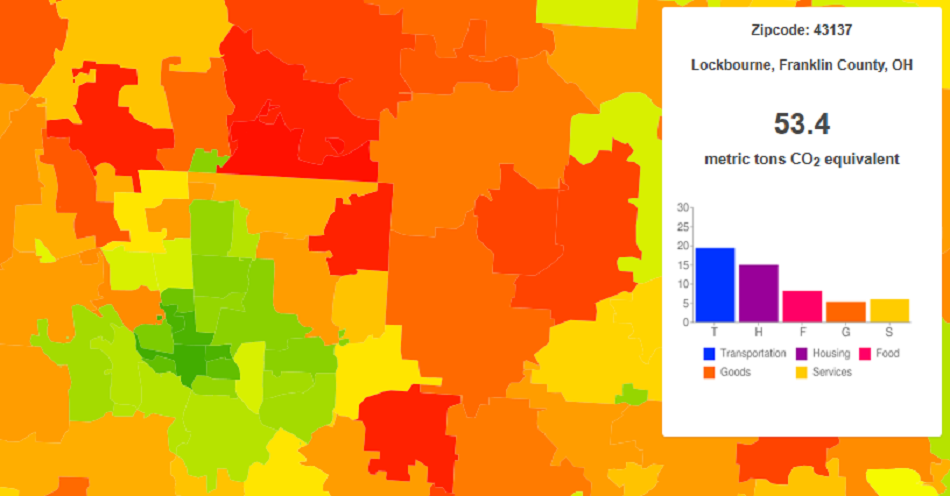
Second, here is a link that gives the average annual carbon footprint of all US zip codes. In general, it seems that the most urban zip codes have the lowest footprints, along with far rural areas. The highest footprints seem to be in suburban and exurban areas. In the Columbus area, the zip code with the highest carbon footprint is 43021, which contains much of Westerville. Second highest is 43054, which contains New Albany. Take a look at the interactive maps here: https://coolclimate.org/maps
Many updates this week! -Finished restoring the February weather page, found here: February Weather -Added about a dozen new before and after photos for historic buildings on the Franklinton historic building database page. -Also added another dozen or so photos to the Downtown historic building database page. The focus of both Downtown and Franklinton has been along Broad Street. -Reconstructed large sections of the Census Tract Maps page that detail population, demographics and other data for Census tracts within Franklin County. -Restored some data for the Annual Weather Records page. -Added a Contact Page for any inquiries about the city or specific information. -A few other odds and ends updates.
If it seems like the last few years have been particularly wet, you’d be right. Columbus, other Ohio cities and many areas in the Midwest have been seeing record rainfall of late. Yesterday alone, June 19th, Columbus had a daily record 2.65″ of rain, flooding many streets across Franklin County, including I-71 in at least 2 places. Is it indicative of a fluke pattern or a local result of climate change? Let’s look at the numbers and trends more closely.
First of all, let’s look at the 20 wettest years on record through June 19th. 1. 1882: 32.50″ 2. 1890: 30.12″ 3. 2019: 27.08″ 4. 1964: 25.78″ 5. 2011: 25.68″ 6. 1893: 25.50″ 7. 2004: 25.49″ 8. 1996: 24.94″ 9. 1949: 24.52″ 10. 1945: 24.49″ 11. 1913: 24.45″ 12. 1883: 24.18″ 13. 2018: 23.98″ 14. 2008: 23.62″ 15. 1950: 23.60″ 16. 1990: 23.56″ 17. 1981: 23.49″ 18. 1898: 22.94″ 19. 1927: 22.92″ 20. 1937: 22.69″
So far, 2019 has had the 3rd highest rain total to date since 1879.
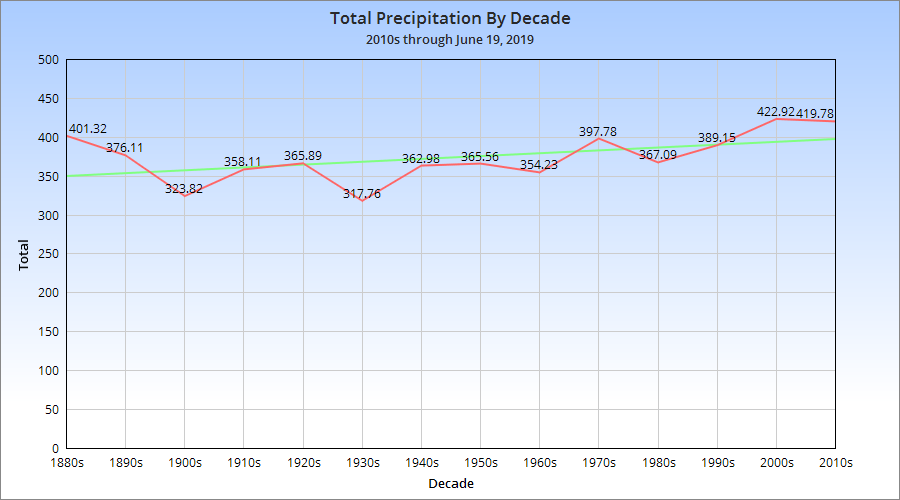
4 years this decade have been among the top 20 wettest years since 1879. Only the 1880’s can match that record, though both the 2000s and 2010s have been wetter, as shown below.
Ironically, few individual months in recent years have featured record precipitation. In the last 10 years, only 1 month- July 2017- appears in the top 25 wettest months. It’s just been more of a constant wet pattern, where most months now have above to well-above normal precipitation. While climate change can’t account for individual events or specific record rainfalls, the patterns are obvious enough to show that the climate in Columbus and in many other parts of the country is changing over time. This means that we should come to expect more of this in the years to come.
On April 22nd of this year, All Columbus Data suffered a major hack. Several attempts were made to restore the website in full and to save the content through backups. At least twice, the site was restored only for it to fall back into the hacked configuration- some kind of jewelry website. Eventually, it was determined that there was corruption within the core files themselves, and since it could not be safely determined which ones, the host refused to restore any of the original content, as the attack was malicious enough to threaten the hosting servers themselves. So, the site was completely scrubbed and at least some of the original content that was not otherwise saved on archived websites was lost. After 7 years of work, it was a sickening result. Now, the rebuilding process has begun. Fortunately, a lot of the core lost data much of the site was built upon still existed in my own personal files, so for many of the pages, it’s simply a matter of putting that information back up on new pages. That is what I’ve been working on this week. Here is what I’ve done so far this week:
-2 new articles were added. -Monthly weather pages for April and May have been restored, complete with updated data for 2019. -Several pages within the Historic Building Database have had at least a few buildings added. -Partially restored the Completed page for Columbus Development . -Added several population graphs to the Columbus city, county and metro area demographics pages. -Partially restored- and expanded- the Columbus Tornado History page, one of All Columbus Data’s most popular.
I will continue to work to restore more pages and posts over time, but it will be an extended process.
This kind of post seems obligatory at this time of year. I thought about making just one big post, but there was so much that happened this year that I decided to break it up by month. This won’t include every single piece of news, of course, but rather just the highlights. First up is the January 2014 review.
Weather January 2014 continued what December 2013 had started. Snowfall was nearly 2x above normal and temperatures were almost 7 degrees below normal. The month tied for the 15th coldest January and the 16th snowiest. The coldest low was -11 and the low hit 0 or below 7 times, the most since 1994. The biggest snow event occurred on the 25th-26th with 8.3″. This was the 10th largest January snowstorm of all time. Snow depth reached at least 1″ on 19 days.