Housing Market Update June 2022


Local housing market update June 2022 Columbus, Ohio

In this latest edition of the Housing Market Update June 2022, data shows that home prices and sales remain strong, but perhaps not quite as strong as in May or other previous months. All data comes from Columbus Realtors.

Note: LSD= Local School District, CSD= City School District. In both cases, school district boundaries differ from city boundaries.

Top 15 Most Expensive Locations By Median Sales Price in June 2022
1. New Albany: $912,500
2. New Albany Plain LSD: $795,000
3. Upper Arlington CSD: $650,000
4. Powell: $601,000
5. Dublin: $570,000
6. Olentangy LSD: $531,000
7. Granville LSD: $527,000
8. Grandview Heights: $525,000
9. Bexley: $498,425
10. Buckeye Valley LSD: $478,980
11. Hilliard: $465,500
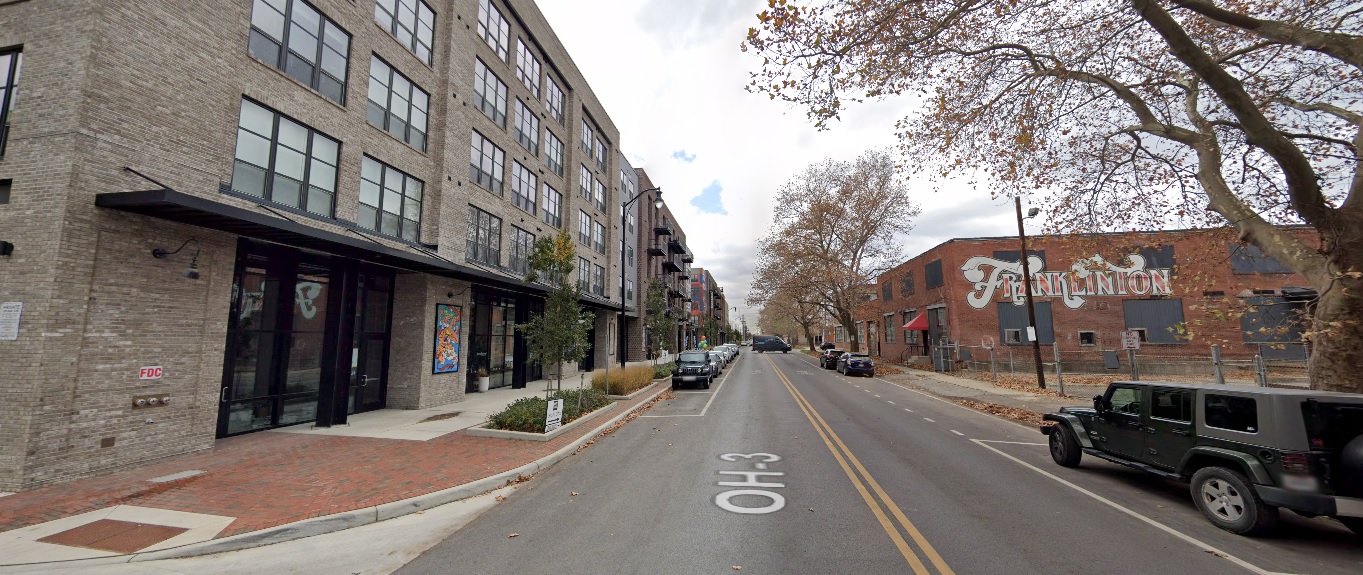
12. Short North: $459,000
13. Dublin CSD: $455,000
14. Worthington: $$455,000
15. Big Walnut LSD: $432,500
16. German Village: $430,000
Whether due to the Intel project or other factors, New Albany’s median sales price continued its path toward a million dollars.

Top 15 Least Expensive Locations by Median Sales Price in June 2022
1. Newark CSD: $168,000
2. Whitehall: $178,500
3. Miami Trace LSD: $184,316
4. Lancaster CSD: $203,500
5. Circleville CSD: $230,000
6. Hamilton LSD: $231,500
7. Groveport Madison LSD: $249,450
8. Columbus CSD: $252,500
9. Jefferson LSD: $267,550
10. Minerva Park: $272,500
11. Columbus: $275,000
12. Reynoldsburg CSD: $280,000
13. South Western CSD: $280,000
14. London CSD: $290,000
15. Delaware CSD: $320,000
16. Downtown: $324,450
The least expensive local markets aren’t so cheap anymore, with only a handful still under the $200,000 level. Columbus remains *relatively* affordable in comparison to most areas.

Overall Market Median Sales Price in June: $300,627
Based on the 10 Columbus Metro Area counties. This price was slightly lower than in May.

Top 15 Locations with the Highest Median Sales Price % Growth Between June 2021 and June 2022
1. Obetz: +68.2%
2. New Albany Plain LSD: +59.0%
3. Circleville CSD: +45.1%
4. Granville LSD: +36.5%
5. Upper Arlington CSD: +36.0%
6. Hilliard: +31.1%
7. Johnstown-Monroe LSD: $28.0%
8. Delaware CSD: +27.0%
9. New Albany: +26.7%
10. Hamilton LSD: +26.5%
11. Teays Valley LSD: +25.9%
12. Groveport Madison LSD: +24.7%
13. Pickerington: +23.4%
14. Pataskala: +23.0%
15. Lithopolis: +19.3%
New Albany is clearly moving up the list of growers, as are other areas near the INtel site.

Top 15 Locations with the Lowest Median Sales Price % Growth Between June 2021 and June 2022
1. Minerva Park: -27.8%
2. Downtown: -27.1%
3. Bexley: -20.3%
4. Valleyview: -18.5%
5. Miami Trace LSD: -11.4%
6. Big Walnut LSD: -8.5%
7. German Village: -7.4%
8. Worthington CSD: -1.4%
9. Westerville: +0.0%
10. Dublin CSD: +2.2%
11. Westerville CSD: +2.7%
12. Worthington: +3.4%
13. Gahanna Jefferson CSD: +3.7%
14. Jonathan Alder LSD: +4.4%
15. Northridge LSD: +5.8%

Overall Market Median Sales Price % Change June 2022 vs. June 2021: +13.4%
Based on 53 metro market locations.

Top 10 Locations with the Most New Listings in June 2022
1. Columbus: 1,459
2. Columbus CSD: 971
3. South Western CSD: 244
4. Olentangy LSD: 238
5. Westerville CSD: 183
6. Hilliard CSD: 173
7. Dublin CSD: 156
8. Worthington CSD: 115
9. Pickerington LSD: 112
10. Grove City: 102

Top 10 Locations with the Fewest New Listings in June 2022
1. Valleyview: 3
2. Minerva Park: 5
3. Lithopolis: 8
4. Obetz: 8
5. Jefferson LSD: 10
6. Grandview Heights: 10
7. Northridge LSD: 12
8. Granville LSD: 12
9. Hamilton LSD: 14
10. Sunbury: 15
11. Bexley: 16
12. Miami Trace LSD: 17
13. Johnstown Monroe LSD: 19

Total New Listings in the Columbus Metro in June 2022: +3,705
Overall Metro New Listings % Change June 2022 vs June 2021: -3.8%
New listings fell for the 2nd consecutive month despite summer usually being the time when more people put their homes on the market.


Top 10 Fastest-Selling Locations by # of Days Homes Remain on the Market Before Sale in June 2022
1. Minerva Park: 3
2. Gahanna: 5
3. Powell: 5
4. Valleyview: 5
5. Worthington CSD: 5
6. Hilliard CSD: 6
7. Johnstown Monroe LSD: 6
8. Newark CSD: 6
9. Upper Arlington CSD: 6
10. Worthington: 6
11. Beechwold/Clintonville: 7
12. German Village: 7
13. Hilliard: 7
14. Lancaster CSD: 7
15. Marysville CSD: 7
16. Westerville: 7
17. Westerville CSD: 7
18. Delaware CSD: 8
19. Grove City: 8
20. Groveport Madison LSD: 8
21. Jefferson LSD: 8
22. Jonathan Alder LSD: 8
23. New Albany Plain: LSD: 8
24. Pickerington LSD: 8
25. Reynoldsburg CSD: 8
26. Blacklick: 9
27. Columbus: 9
28. Gahanna Jefferson CSD: 9
29. Lithopolis: 9
30. Olentangy LSD: 9
31. Pickerington: 9
32. Whitehall: 9
33. Canal Winchester CSD: 10
34. Grandview Heights: 10
35. New Albany: 10
36. South Western CSD: 10
37. Columbus CSD: 11
38. Dublin CSD: 11
39. Granville LSD: 11
40. London CSD: 11
41. Bexley: 13
42. Dublin: 13
43. Big Walnut LSD: 15
44. Short North: 15

The “Top 10” became the Top 44 just given that most of the local markets are selling so similarly quickly. There is relatively little spread between the fastest and slowest-selling markets.

Top 10 Slowest-Selling Locations by # of Days Homes Remain on the Market Before Sale in June 2022
1. Northridge LSD: 51
2. Downtown: 43
3. Teays Valley LSD: 30
4. Buckeye Valley LSD: 26
5. Circleville CSD: 25
6. Miami Trace LSD: 24
7. Sunbury: 23
8. Obetz: 22
9. Pataskala: 21
10. Hamilton LSD: 17

Top 10 Locations with the Greatest % Decline of # of Days on the Market Before Sale June 2022 vs. June 2021
1. German Village: -74.1%
2. Bexley: -69.0%
3. Grandview Heights: -58.3%
4. Upper Arlington CSD: -53.8%
5. Lancaster CSD: -50.0%
6. Grove City: -42.9%
7. Beechwold/Clintonville: -41.7%
8. New Albany: -37.5%
9. New Albany Plain LSD: -33.3%
10. Newark CSD: -33.3%
11. Worthington: -33.3%
12. Granville LSD: -31.3%

Top 10 Locations with the Lowest % Decline of # of Days on the Market Before Sale June 2022 vs. June 2021
1. Northridge LSD: +325.0%
2. Circleville CSD: +212.5%
3. Miami Trace LSD: +200.0%
4. Sunbury: +155.6%
5. Teays Valley LSD: +150.0%
6. Pickerington: +125.0%
7. Hamilton LSD: +112.5%
8. Pataskala: +110.0%
9. Canal Winchester CSD: +100.0%
10. Lithopolis: +80.0%

Total # of Days Homes Remain on the Market Before Sale Across the Metro Overall: 14.7
Overall Metro Days on Market % Change June 2022 vs June 2021: +4.3%
Homes spent slightly longer on the market in June vs. a year ago, again signaling that perhaps a slowdown is in the very early stages.


Before and After Franklinton


Before and after Franklinton Columbus, Ohio

Franklinton has been known as The Bottoms for many years, mainly because the low-lying neighborhood has seen flooding more often than anywhere else in the city. With the completion of the Franklinton Floodwall nearly 20 years ago, the neighborhood has been seeing redevelopment at an ever-increasing pace. This Before and After of the neighborhood only covers some of the changes, and another similar post detailing more changes will most likely be needed.

Before: COSI Parking Lot in 2009

This large parking lot had once been part of Central High School’s campus and was originally the site of the schools track and athletic fields. After the school closed in the early 1980s, the area was converted to a large parking lot. It continued its life as parking when COSI moved from Downtown to a new facility in the converted school. When plans for the Scioto Peninsula to be redeveloped emerged, it was decided to turn the parking lot into a brand new park.
After: New Park in 2020

The parking was not actually lost, however. An underground garage was constructed beneath the park itself, which is now called Dorian Green. New development, which will include offices, retail and hundreds of new residences, can be seen under construction in the background.

Before: Veterans Memorial in 2011

The old Veterans Memorial was constructed in the mid-1950s. Over the subsequent decades, the building was renovated and expanded multiple times. By the 2000s, the building was considered outdated with a convoluted layout. Despite some objections, it was decided that the complex would be torn down and replaced with a new veterans center.
After: National Veterans Memorial and Museum in 2020

The new building had a far more modern, almost futuristic design, like something out of an X-Men movie. The new building was to remain a veterans memorial with office and event space, but also serve as a museum. It was eventually given the status of being the National Veterans Memorial, the only one of its kind in the nation.

Before: 500 West Broad Street in 2011

Back in 2011, 500 W. Broad was a collection of small businesses, most notably Wasserstrom restaurant supply. This stretch of Broad was unremarkable and a more modern remnant of urban renewal during the mid-20th Century.
After: 500 West Broad in 2020

Today, the first phase of the Gravity development occupies the entire stretch. This unique mixed-use development contains, among other things, apartments, retail space, community art and activity space for its residents. Directly across the street, the 2nd- and much larger- phase of Gravity is currently under construction.

Before: A.D. Farrow Harley Davidson in 2012

A century after the business was established, this Harley Davidson sales shop just down the street from Gravity looked out of date. Half the site was also a parking lot that fronted Broad Street.
After: A.D. Farrow Harley Davidson in 2020

In 2020, the business was engaged in a significant remodel and expansion. Local business investments such as this have been on the rise in Franklinton in recent years, especially east of 315.

Before: 524 West Broad in 2009

This site had been used as a car lot for some time. The original buildings had been demolished in the early 1960s,
replaced with surface parking.
After: 524 West Broad in 2020

Today the site is home to Franklinton Station, a lower-income residential complex for seniors.


Before: West Rich Street at the Railroad Crossing, looking west in 2009

This view of West Rich Street shows how the area had been in decline, with abandoned buildings on the right and run-down public housing on the left that had seen little investment since its construction in the early 1960s.
After: West Rich Street at the Railroad Crossing, looking west in 2020

Today, this section of Rich Street looks like a completely different place. Buildings have been renovated and old housing has been replaced with the much more dense River & Rich mixed-use development. The new complex contains retail space and residences that retain affordable housing. Another phase of the River & Rich development is in the works that may eventually include a new residential tower.

Before: 548 West State Street in 2011

The site at 548 W. State had been vacant for a number of years, with the original development having been demolished. By 2011, it was overgrown with weeds.
After: 548 West State Street in 2020

In 2020, the site had a brand new mixed-use building containing 13 apartments and retail space. The mural also contributes to Franklinton becoming more of an arts location as the previous arts destination, the Short North, becomes ever more expensive.

Before: Mount Carmel West in 2015

Mount Carmel West Hospital had been a dominant fixture in Franklinton for more than a century. It was originally known as Hawkes Hospital and constructed in 1886, becoming Mount Carmel in the 20th Century. However, by the 2010s, the location was deemed to be less optimal and so most of the services were moved to a new hospital in Grove City. The fate of the old hospital was sealed and a plan was drawn up to redevelop the entire site.
After: Mount Carmel West in 2020

By 2020, the main hospital was no more. The only structures that will remain include the nurse’s college and several parking garages. The site will be redeveloped with mixed-use projects including residential, retail and office space over the next several years.

Before: Hawkes Avenue, looking south from Chapel Street in 2009

Hawkes Avenue was a typical Franklinton street by the late 2000s, with its vacant lots, abandoned buildings and poorly-maintained infrastructure.
After: Hawkes Avenue, looking south from Chapel Street in 2019

Infill housing has been gradually becoming more common throughout Franklinton, as well as home renovations and general reinvestment in infrastructure by the City. Hawkes Avenue has been a beneficiary, and now looks better than it has in many years.

Franklinton has come a long way in just a few years, and the neighborhood is poised to only continue to change even more drastically in the near future. Many new projects are either under construction or have been recently proposed. Future phases of the Scioto Peninsula redevelopment will only spur additional development and growth westward. Whether Franklinton can revitalize without driving out too many of its existing residents remains somewhat of an open question.


Housing Market Update February 2021


housing market update February 2021 Columbus, Ohio

Just a week ago, I wrote about the Columbus housing market and how it was performing the past year. I used to do reports like that often, but hadn’t in years. Due to the overwhelmingly positive article response, I have decided to restart these monthly reports. Given the current state of the housing market, such information may be helpful to prospective homebuyers.

These new reports will be a bit more condensed than the one from last week. I will not list every location for every statistic as I did last week. Instead, I will still attempt to offer a general comparative view of the different markets within the region.

So let’s go!

Note: LSD= Local School District, CSD= City School District. In both cases, school district boundaries differ from city boundaries.

Top 15 Most Expensive Locations By Median Sales Price in February 2021
1. New Albany: $657,450
2. New Albany Plain LSD: $580,500
3. German Village: $569,500
4. Bexley: $517,000
5. Dublin: $502,500
6. Upper Arlington CSD: $450,000
7. Olentangy LSD: $434,900
8. Powell: $434,900
9. Granville CSD: $387,450
10. Worthington: $380,000
11. Buckeye Valley LSD: $378,240
12. Dublin CSD: $$360,000
13. Grandview Heights: $355,200
14. Short North: $350,000
15. Big Walnut LSD: $348,730

New Albany and some of the more urban suburbs and neighborhoods continue to be near the top of the pack in terms of price.

Top 15 Least Expensive Locations by Median Sales Price in February 2021
1. Valleyview: $129,850
2. Whitehall: $133,000
3. Newark CSD: $145,000
4. Lancaster CSD: $162,000
5. Hamilton LSD: $170,500
6. Groveport Madison LSD: $186,750
7. Columbus CSD: $194,750
8. Jefferson LSD: $198,500
9. Columbus: $210,000
10. South-Western CSD: $217,500
11. Circleville CSD: $224,000
12. Reynoldsburg CSD: $230,000
13. London CSD: $239,900
14. Obetz: $242,363
15. Blacklick: $245,000

Most of these places are outer suburbs outside of Franklin County or smaller locations that are less known or considered less desirable.

Overall Market Median Sales Price in February 2021: $225,500

Top 15 Locations with the Highest Median Sales Price % Growth Between February 2020 and February 2021
1. Valleyview: +93.8% (Based on just 1 sale)
2. Circleville CSD: +79.2%
3. Buckeye Valley LSD: +71.9%
4. Sunbury: +71.4%
5. Jefferson LSD: +52.8%
6. Reynoldsburg CSD: +44.9%
7. Worthington: +38.2%
8. German Village: +36.1%
9. Obetz: +31.2%
10. Marysville CSD: +29.9%
11. Dublin: +27.8%
12. London CSD: +26.3%
13. Olentangy LSK: +25.0%
14. Pataskala: +25.0%
15. Bexley: +22.7%

Top 15 Locations with the Lowest Median Sales Price % Growth Between February 2020 and February 2021
1. Granville CSD: -7.5%
2. Downtown Columbus: -6.6%
3. Jonathan Alder LSD: -4.5%
4. Grandview Heights: -4.0%
5. Powell: -4.0%
6. Minerva Park: -2.1%
7. Westerville: -0.8%
8. Pickerington: -0.7%
9. Canal Winchester CSD: -0.2%
10. Teays Valley LSD: 0.0%
11. Short North: +0.2%
12. Hamilton LSD: +0.3%
13. Beechwold/Clintonville: +1.3%
14. Pickerington LSD: +1.5%
15. Westerville CSD: +4.0%

Overall Market Median Sales Price % Change February 2021 vs. February 2020: +7.4%

Top 10 Locations with the Most New Listings in February 2021
1. Columbus: 830
2. Columbus CSD: 540
3. South-Western CSD: 135
4. Hilliard CSD: 102
5. Olentangy LSD: 91
6. Westerville CSD: 80
7. Dublin CSD: 73
8. Grove City: 65
9. Gahanna Jefferson CSD: 63
10. Pickerington LSD: 58

Top 10 Locations with the Fewest New Listings in February 2021
1. Valleyview: 0
2. Lithopolis: 1
3. Minerva Park: 1
4. Jonathan Alder LSD: 3
5. Jefferson LSD: 5
6. Sunbury: 5
7. Grandview Heights: 6
8. Obetz: 9
9. Worthington: 10
10. Hamilton LSD: 10
11. German Village: 10

Total New Listings in the Columbus Metro in February 2021: 1,932
Overall Metro New Listings % Change February 2021 vs February 2020: -25.4%

Top 10 Fastest-Selling Locations by # of Days Homes Remain on the Market Before Sale in February 2021
1. Obetz: 4
2. Gahanna: 8
3. Hamilton LSD: 8
4. Johnstown-Monroe LSD: 8
5. Pickerington: 8
6. Groveport Madison LSD: 9
7. Pickerington LSD: 10
8. Canal Winchester CSD: 11
9. Reynoldsburg CSD: 12
10. Gahanna Jefferson CSD: 13
11. Hilliard: 13
12. Worthington CSD: 13

Top 10 Slowest-Selling Locations by # of Days Homes Remain on the Market Before Sale in February 2021
1. Downtown Columbus: 72
2. Big Walnut LSD: 57
3. New Albany Plain LSD: 52
4. New Albany: 50
5. Grandview Heights: 48
6. Bexley: 44
7. Short North: 41
8. Circleville CSD: 40
9. German Village: 40
10. Dublin: 39
11. Granville CSD: 39

Columbus-area homes are selling at a blistering pace.


# of Days For-Sale Homes Remain on the Market Before Sale Across the Metro Overall: 26

Top 10 Locations with the Greatest % Decline of # of Days on the Market Before Sale February 2021 vs February 2020
1. Obetz: -89.5%
2. Pickerington: -83.7%
3. Pataskala: -82.1%
4. Pickerington LSD: -79.6%
5. Canal Winchester CSD: -78.0%
6. Hamilton LSD: -76.3%
7. Powell: -74.2%
8. Minerva Park: -70.4%
9. Gahanna: -68.0%
10. Groveport Madison LSD: -66.7%

Top 10 Locations with the Lowest % Decline of # of Days on the Market Before Sale February 2021 vs February 2020
1. Grandview Heights: +92.0%
2. Sunbury: +29.4%
3. Short North: +28.1%
4. Circleville CSD: +21.2%
5. Whitehall: +17.9%
6. Downtown Columbus: +16.1%
7. Worthington: +12.5%
8. New Albany Plain LSD: -3.7%
9. Jefferson LSD: -12.5%
10. Lancaster CSD: -18.4%

% Change for the # of Days Homes Remain on the Market Before Sale Across the Metro Overall: -39.5%

All this data can be confusing. Homebuyers must find the goldilocks zone of price, location and availability, and that’s difficult even in the friendliest of markets. Just because a local market may be seeing slower home sales doesn’t mean they’re affordable. Similarly, just because there’s a lot of supply doesn’t mean homes aren’t not selling out faster than they can go onto the market.

Columbus overall continues to have the most supply, but that’s far from the whole story. While the city added 830 new listings in February, only 582 were actually available for sale. This means that hundreds more homes were sold during the month than became available. The number of available homes only continued to shrink. Columbus’ entire supply would’ve sold out in just 18 days had no additional homes come up for sale.

And the thing is, nothing on the horizon indicates this situation will improve anytime soon. It’s not just that demand is drastically outweighing existing supply, though. Developers- when not faced with NIMBYism and zoning issues- are experiencing materials shortages that were exacerbated by the pandemic. Even when developers can build, they don’t always have the raw materials needed for construction. Unfortunately, these problems aren’t going to go away in the near future.

Given all of that, homebuyers have to be smart, they have to be very persistent, and they need to be prepared to spend more than originally planned.

For more information on the local market, go here to the Columbus Realtors site.


Housing Market Update January 2017


housing market update January 2017 Columbus, Ohio

The recent housing market update January 2017 edition information comes from Columbus Realtors.

Note: LSD= Local School District, CSD= City School District. In both cases, school district boundaries differ from city boundaries.

Top 15 Most Expensive Locations By Median Sales Price in January 2017
1. New Albany: $535,000
2. New Albany Plain LSD: $397,450
3. German Village: $376,000
4. Powell: $354,950
5. Dublin: $343,600
6. Granville CSD: $330,000
7. Bexley: $325,000
8. Upper Arlington CSD: $319,500
9. Olentangy LSD: $315,000
10. Big Walnut LSD: $306,250
11. Dublin CSD: $271,500
12. Worthington: $270,000
13. Buckeye Valley LSD: $259,000
14. Sunbury: $253,000
15. Downtown: $243,750

Top 15 Least Expensive Locations by Median Sales Price in January 2017
1. Obetz: $80,100
2. Hamilton LSD: $80,100
3. Whitehall: $85,950
4. Newark CSD: $86,900
5. Lancaster CSD: $103,000
6. Jefferson LSD: $123,000
7. London CSD: $124,000
8. Groveport Madison LSD: $125,900
9. Reynoldsburg CSD: $125,950
10. Columbus CSD: $129,900
11. South-Western CSD: $131,000
12. Columbus: $140,026
13. Jonathan Alder LSD: $150,000
14. Minerva Park: $159,500
15. Grove City: $160,950

Overall Market Median Sales Price in January 2017: $160,368
Median Sales Price Change January 2016-January 2016: +$3,172

Top 15 Locations with the Highest Median Sales Price % Growth Between January 2016 and January 2017
1. Whitehall: +69.5%
2. Circleville CSD: +64.9%
3. Sunbury: +63.0%
4. Jefferson LSD: +53.5%
5. Big Walnut LSD: +44.1%
6. Canal Winchester CSD: +40.9%
7. Westerville: +29.8%
8. Westerville CSD: +27.3%
9. Powell: +25.4%
10. Pataskala: +24.0%
11. Olentangy LSD: +23.5%
12. Gahanna Jefferson CSD: +21.8%
13. Grandview Heights: +21.2%
14. Granville CSD: +20.0%
15. Pickerington: +17.7%

Top 15 Locations with the Lowest Median Sales Price % Growth Between January 2016 and January 2017
1. London CSD: -53.5%
2. Obetz: -38.3%
3. Hamilton LSD: -27.1%
4. Jonathan Alder LSD: -25.2%
5. Buckeye Valley LSD: -23.0%
6. Reynoldsburg CSD: -18.7%
7. Hilliard: -17.7%
8. Lancaster CSD: -17.6%
9. Grove City: -15.3%
10. Dublin CSD: -12.8%
11. Johnstown-Monroe LSD: -10.8%
12. Upper Arlington CSD: -8.5%
13. Newark CSD: -8.1%
14. Dublin: -7.1%
15. South-Western CSD: -6.4%

Overall Market Median Sales Price % Change January 2016-January 2017: +2.0%

Top 10 Locations with the Most New Listings in January 2017
1. Columbus: 829
2. Columbus CSD: 544
3. South-Western CSD: 136
4. Olentangy LSD: 122
5. Westerville CSD: 100
6. Hilliard CSD: 94
7. Dublin CSD: 89
8. Worthington CSD: 66
9. Dublin: 64
10. Pickerington LSD: 60

Top 10 Locations with the Fewest New Listings in January 2017
1. Valleyview: 0
2. Lithopolis: 1
3. Minerva Park: 2
4. Sunbury: 2
5. Obetz: 3
6. Johnstown Monroe LSD: 5
7. Jefferson LSD: 8
8. Jonathan Alder LSD: 8
9. German Village: 8
10. Hamilton LSD: 8
11. Northridge LSD: 9

Total New Listings in the Columbus Metro in January 2017: 2,002
Overall Metro New Listings % Change January 2016-January 2017: -1.9%

Top 10 Fastest-Selling Locations by # of Days Homes Remain on the Market Before Sale in January 2017
1. Obetz: 18
2. Sunbury: 21
3. Pataskala: 22
4. Jefferson LSD: 26
5. Gahanna: 28
6. Minerva Park: 28
7. Delaware CSD: 29
8. Bexley: 31
9. Hilliard CSD: 31
10. Pickerington: 31
11. Worthington CSD: 31

Top 10 Slowest-Selling Locations by # of Days Homes Remain on the Market Before Sale in January 2017
1. Dublin: 96
2. New Albany: 93
3. Dublin CSD: 82
4. Powell: 80
5. Granville CSD: 79
6. Olentangy LSD: 78
7. Downtown: 77
8. Grandview Heights: 76
9. New Albany Plain LSD: 68
10. Canal Winchester CSD: 67
11. New Albany CSD: 65
12. Upper Arlington CSD: 62
13. Circleville CSD: 61
14. Johnstown Monroe LSD: 61
15. Hamilton LSD: 60

# of Days For-Sale Homes Remain on the Market Before Sale Across the Metro Overall: 51.6
Change in # of Days Before Sale January 2016-January 2017: -22.0


Top 10 Locations with the Greatest % Decline of # of Days on the Market Before Sale January 2016-January2017
1. Obetz: -89.2%
2. Pataskala: -64.5%
3. Whitehall: -64.3%
4. Circleville CSD: -56.1%
5. Gahanna: -53.3%
6. Grove City: -49.2%
7. Delaware CSD: -44.2%
8. Bexley: -40.4%
9. Pickerington LSD: -39.7%
10. Worthington CSD: -38.0%

Top 10 Locations with the Lowest % Decline of # of Days on the Market Before Sale January 2016-January 2017
1. German Village: +161.1%
2. Worthington: +123.8%
3. Powell: +77.8%
4. Grandview Heights: +46.2%
5. Big Walnut LSD: +41.5%
6. Minerva Park: +40.0%
7. Jonathan Alder LSD: +37.8%
8. Canal Winchester CSD: +31.4%
9. Marysville CSD: +28.3%
10. Johnstown Monroe LSD: +27.1%

% Change for the # of Days Homes Remain on the Market Before Sale Across the Metro Overall: -29.9%


Columbus Housing Market August 2013


Columbus housing market August 2013

The Columbus housing market August 2013 data from Columbus Realtors shows that the area continued hot, with record August sales and potentially a record year still in the making. For the region, sales were up 11% for August and are were up almost 23% for the first 8 months of the year.

I looked at the 21 major areas of Franklin County (11 urban, 10 suburban). Here is what the August market looked like.

Top 10 August Sales Totals
1. Columbus: 1,027
2. Upper Arlington: 82
3. Dublin: 78
4. Clintonville: 75
5. Grove City: 72
6. Hilliard: 66
7. Westerville: 61
8. Gahanna: 52
9. Worthington: 37
10. Reynoldsburg: 35

Top 10 August Sales Increases Over August 2012
1. Minerva Park: +400.0%
2. Downtown: +66.7%
3. Gahanna: +48.6%
4. Upper Arlington: +34.4%
5. German Village: +25.0%
6. Clintonville: +21.0%
7. Grove City: +20.0%
8. Westerville: +15.1%
9. Columbus: +12.6%
10. Whitehall: +12.5%

Top 10 Total YTD Sales Through August
1. Columbus: 7,149
2. Dublin: 561
3. Upper Arlington: 533
4. Clintonville: 505
5. Grove City: 437
6. Westerville: 436
7. Hilliard: 409
8. Gahanna: 369
9. Reynoldsburg: 346
10. Pickerington: 236

Top 10 YTD Sales Increases Through over August 2012
1. Minerva Park: +52.9%
2. Whitehall: +37.4%
3. Hilliard: +37.2%
4. German Village: +34.5%
5. Bexley: +33.3%
6. Gahanna: +32.3%
7. Downtown: +31.7%
8. Clintonville: +31.2%
9. Pataskala: +31.1%
10. Reynoldsburg: +31.1%

Average Sales August 2013
Urban: 121.3
Suburban: 44.9
Urban without Columbus: 30.7

Average % Change August 2013 vs. August 2012
Urban: +49.5%
Suburban: -0.3%
Urban without Columbus: +53.2%

Average Sales YTD Through July
Urban: 826.2
Suburban: 330.0
Urban without Columbus: 193.9

Average % Change YTD vs. YTD 2012 (Through August)
Urban: +21.2%
Suburban: +24.0%
Urban without Columbus: +20.6%

Top 10 Average Sales Price August 2013
1. New Albany: $563,743
2. Upper Arlington: $391,739
3. Bexley: $379,746
4. Dublin: $316,481
5. Downtown: $280,630
6. German Village: $280,037
7. Worthington: $263,934
8. Grandview Heights: $240,743
9. Hilliard: $225,476
10. Canal Winchester: $197,671

Top 10 Average Sales Price % Increases vs. August 2012
1. Canal Winchester: +32.8%
2. Bexley: +27.4%
3. Pataskala: +19.0%
4. Worthington: +18.0%
5. Upper Arlington: +14.4%
6. Reynoldsburg: +11.1%
7. Columbus: +10.4%
8. New Albany: +8.8%
9. Gahanna: +5.4%
10. Hilliard: +3.5%

Top 10 Average Sales Price YTD
1. New Albany: $546,941
2. Upper Arlington: $360,574
3. Bexley: $352,910
4. Dublin: $330,887
5. German Village: $306,121
6. Downtown: $283,942
7. Worthington: $247,084
8. Grandview Heights: $222,795
9. Hilliard: $219,123
10. Gahanna: $200,988

Top 10 Average YTD Sales Price % Change vs. YTD 2012
1. Whitehall: +16.7%
2. Downtown: +15.5%
3. Upper Arlington: +12.6%
4. Gahanna: +12.3%
5. Minerva Park: +12.2%
6. Reynoldsburg: +9.6%
7. New Albany: +8.7%
8. Canal Winchester: +7.3%
9. Bexley: +6.2%
10. Worthington: +5.1%

Average Price August 2013
Urban: $223,076
Suburban: $230,864
Urban without Columbus: $231,445

Average Price % Change vs. August 2012
Urban: +1.4%
Suburban: +6.9%
Urban without Columbus: +0.5%

Average Price YTD
Urban: $215,558
Suburban: $224,012
Urban without Columbus: $224,254

Average Price % Change YTD vs. YTD 2012
Urban: +4.9%
Suburban: +4.9%
Urban without Columbus: +4.9%

Top 10 Fastest Selling Markets August 2013 (based on # of Days listings sell)
1. Gahanna: 32
2. Obetz: 32
3. Whitehall: 36
4. Bexley: 37
5. Upper Arlington: 37
6. Clintonville: 41
7. Worthington: 41
8. Grandview Heights: 42
9. Hilliard: 43
10. Westerville: 48

Top 10 Fastest Selling Markets YTD
1. Worthington: 38
2. Upper Arlington: 45
3. Grandview Heights: 46
4. Clintonville: 54
5. Hilliard: 55
6. Westerville: 55
7. Gahanna: 58
8. Bexley: 59
9. Dublin: 60
10. Grove City: 63

Average # of Days before Sale, August 2013
Urban: 49.4
Suburban: 66.8
Urban without Columbus: 48.6

Average # of Days before Sale, YTD
Urban: 62.7
Suburban: 62.4
Urban without Columbus: 62.4

Top 10 Lowest Housing Supplies (based on # of months to sell all listings), August 2013
1. Worthington: 2.1
2. Bexley: 2.3
3. Clintonville: 2.5
4. Grandview Heights: 2.5
5. Hilliard: 2.5
6. Westerville: 2.7
7. Upper Arlington: 2.8
8. Gahanna: 3.1
9. Dublin: 3.3
10. Pickerington: 3.9

Average # of Months to Sell All Listings
Urban: 3.6
Suburban: 4.1
Urban without Columbus: 3.5

Average % Change of Single-Family Home Sales, August 2013 vs. August 2012
Urban: +32.0%
Suburban: -1.8%
Urban without Columbus: +34.0%

Average % Change of Condo Sales, August 2013 vs. August 2012
Urban: +65.5%
Suburban: +51.0%
Urban without Columbus: +70.3%

Average % Change of Single-Family Home Sales YTD vs. YTD 2012
Urban: +12.9%
Suburban: +23.8%
Urban without Columbus: +11.5%

Average % Change of Condo Sales YTD vs. YTD 2012
Urban: +44.3%
Suburban: +29.5%
Urban without Columbus: +45.8%