2024 County and Metro Population Estimates

Percent Change in County Populations[Source: U.S. Census Bureau]

The US Census has released 2024 county and metro population estimates. The estimates generally show a further continuation of the post-pandemic recovery in the numbers. In fact, older estimates have also been revised upwards. Let’s break down the numbers.

Metro County

2020 Census

2023 Population

2024 Population

Delaware

214,123

232,732

237,966

Fairfield

158,920

165,630

167,762

Franklin

1,323,819

1,338,903

1,356,303

Hocking

28,056

27,567

27,429

Licking

178,517

183,540

184,898

Madison

43,848

44,668

45,531

Morrow

34,944

35,583

35,927

Perry

35,412

35,577

35,682

Pickaway

58,551

61,064

62,158

Union

62,790

69,765

71,721

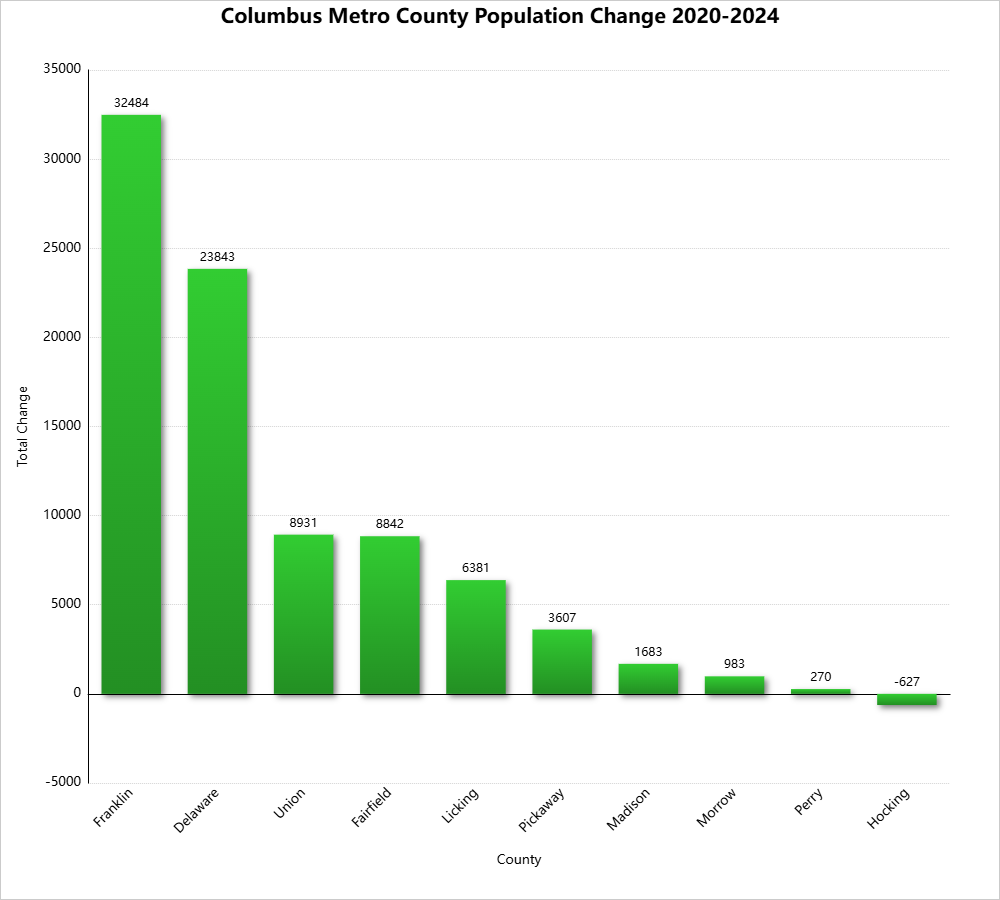
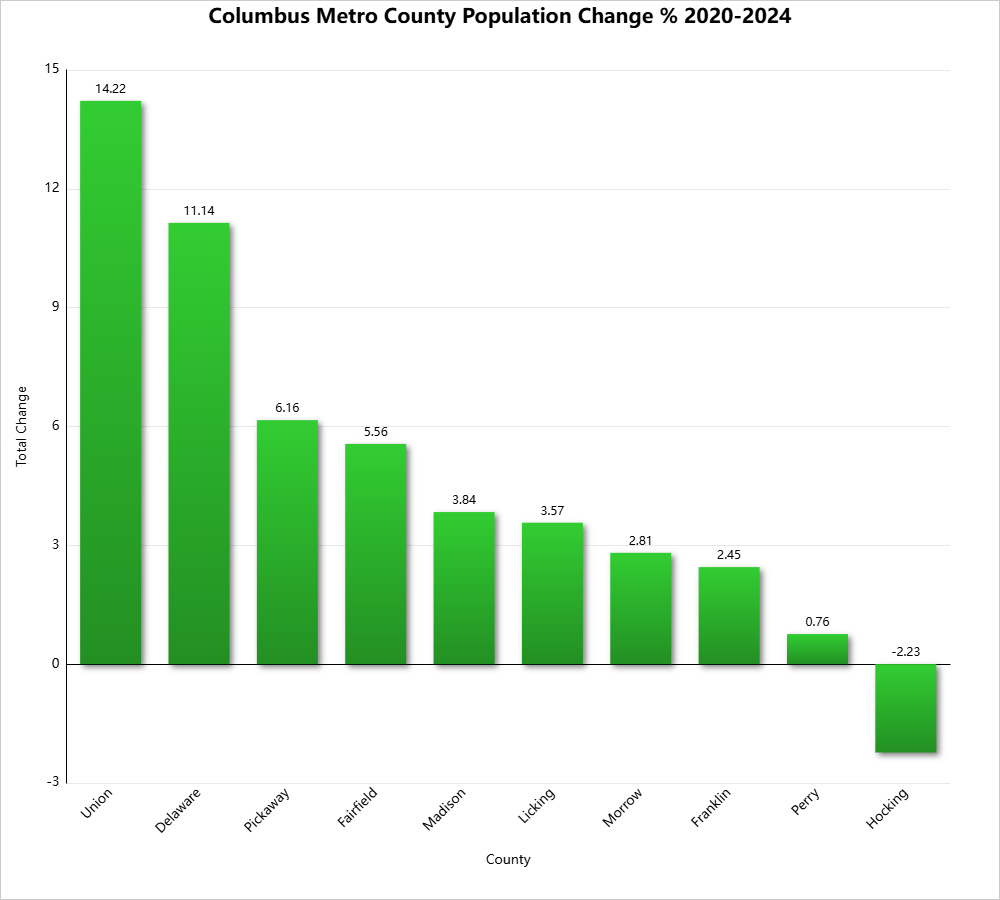
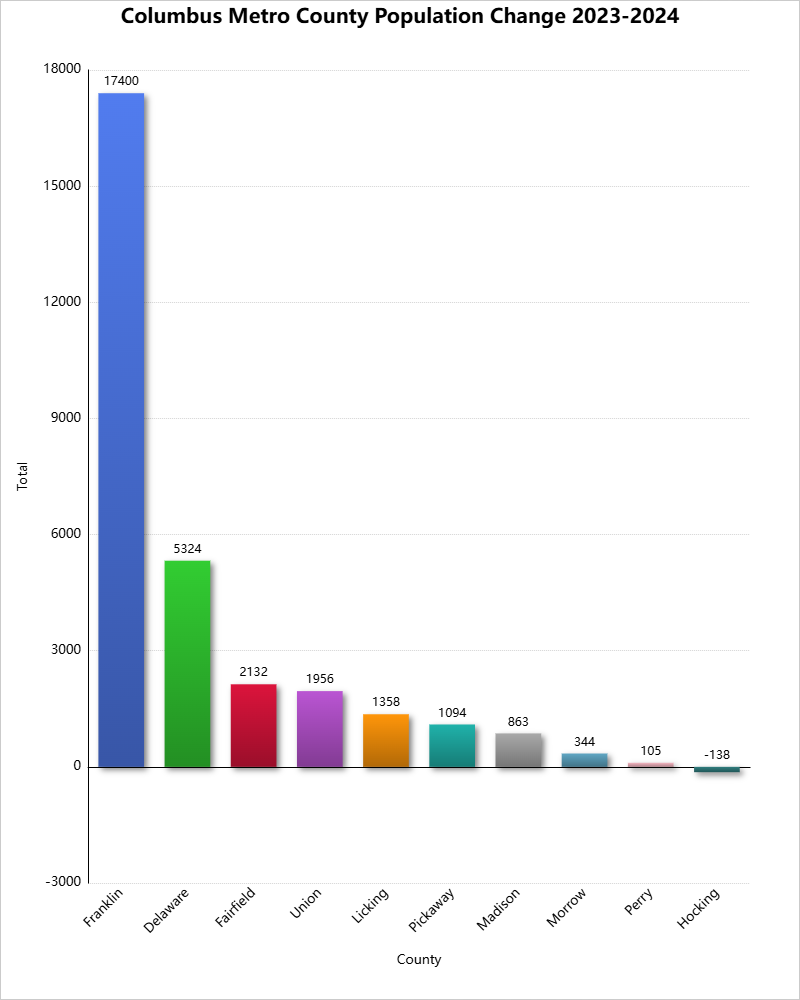
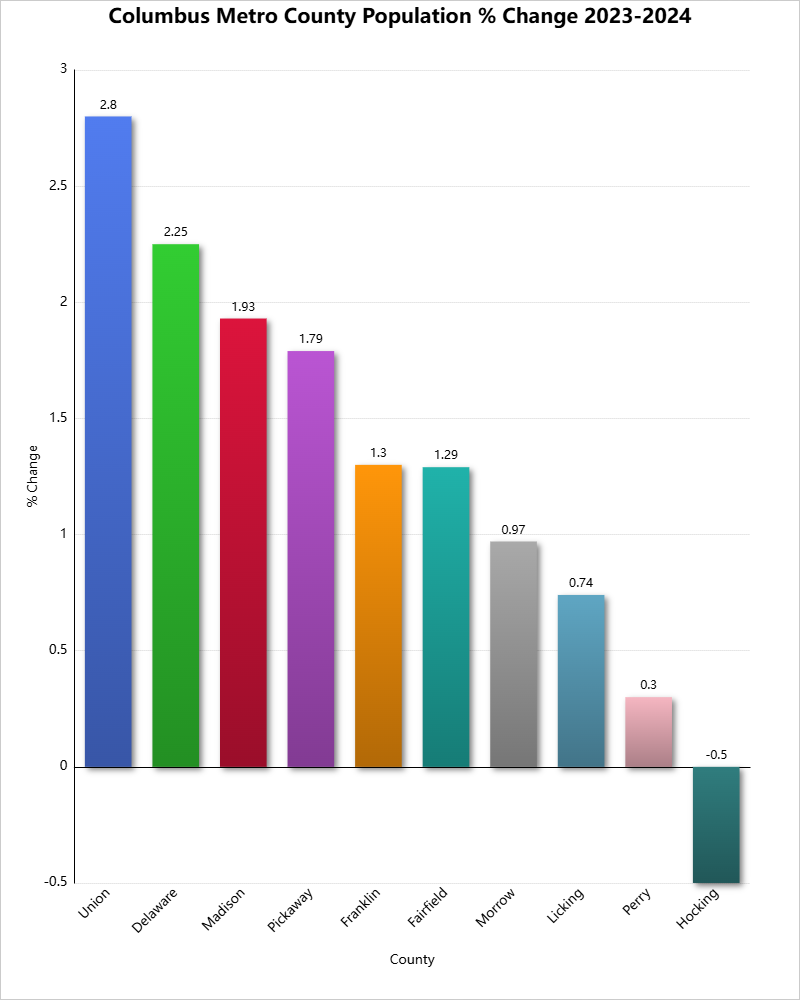
As you can see, all counties but Hocking grew in both the 2020-2024 and 2023-2024 periods. Most of the estimates were improvements over the 2023 version, as mentioned. For example, Franklin County’s estimates population in 2023 was 1,326,063, but the 2024 version for 2023 was revised to 1,338,903, indicating growth was significantly stronger than originally estimated.

2024 metro population estimates county population

Franklin County continued its very long run of being the top county in the metro for total growth.

2024 metro population estimates county percent change

2024 metro population estimates population change

2024 metro population estimates county population percent change

Here were the top 25 largest Ohio counties in 2024.
1. Franklin: 1,356,303
2. Cuyahoga: 1,240,594
3. Hamilton: 837,859
4. Summit: 538,370
5. Montgomery: 537,443
6. Lucas: 426,291
7. Butler: 399,542
8. Stark: 374,091
9. Lorain: 322,030
10. Warren: 256,059
11. Delaware: 237,966
12. Lake: 232,360
13. Mahoning: 225,786
14. Clermont: 214,123
15. Trumbull: 200,300
16. Licking: 184,898
17. Medina: 184,625
18. Greene: 172,347
19. Fairfield: 167,762
20. Portage: 163,839
21. Clark: 134,985
22. Wood: 133,077
23. Richland: 124,853
24. Wayne: 116,632
25. Miami: 111,950

Metro Area

2020

2024

Change

Akron

702,211

702,209

-2

Canton

401,594

400,551

-1,043

Cincinnati

2,249,812

2,302,815

53,003

Cleveland

2,185,745

2,171,877

-13,868

Columbus

2,138,980

2,225,377

86,397

Dayton

814,040

821,740

7,700

Toledo

606,234

601,396

-4,838

Youngstown

430,675

426,086

-4,589

2019 Ohio County Population Estimates

2019 Ohio county population estimates

The US Census has begun releasing 2019 population data, which will be the final data before we get the official, decennial census statistics for 2020. With Covid-19 ravaging the world and United States at the moment, it remains to be seen what effects it might have on the census counts, or if the official census may even end up delayed. While we wait for those issues to resolve, here are the 2019 Ohio county population estimates.

Total Ranked Population of Ohio’s Counties by Year
Census 2010—————————-July 1, 2018————————July 1, 2019
1. Cuyahoga: 1,280,122——–1. Franklin: 1,307,698———–1. Franklin: 1,316,756
2. Franklin: 1,163,414———–2. Cuyahoga: 1,241,718——–2. Cuyahoga: 1,235,072
3. Hamilton: 802,374————3. Hamilton: 815,445————-3. Hamilton: 817,473
4. Summit: 541,781————–4. Summit: 541,353————–4. Summit: 541,013
5. Montgomery: 535,153——-5. Montgomery: 531,600——–5. Montgomery: 531,687
6. Lucas: 441,815 —————6. Lucas: 429,612—————-6. Lucas: 428,348
7. Stark: 375,586—————–7. Butler: 382,000—————-7. Butler: 383,134
8. Butler: 368,130—————-8. Stark: 371,248—————–8. Stark: 370,606
9. Lorain: 301,356—————9. Lorain: 309,052—————-9. Lorain: 309,833
10. Mahoning: 238,823——–10. Warren: 231,945————-10. Warren: 234,602
11. Lake: 230,041—————11. Lake: 230,102—————–11. Lake: 230,149
12. Warren: 212,693————12. Mahoning: 229,216———12. Mahoning: 228,683
13. Trumbull: 210,312———-13. Clermont: 205,526———–13. Delaware: 209,177
14. Clermont: 197,363———-14. Delaware: 205,091———-14. Clermont: 206,428
15. Delaware: 174,214———15. Trumbull: 198,539————15. Trumbull: 197,974
16. Medina: 172,332————16. Medina: 178,978————–16. Medina: 179,746
17. Licking: 166,492————-17. Licking: 175,666————–17. Licking: 176,862
18. Greene: 161,573————18. Greene: 167,446————–18. Greene: 168,937
19. Portage: 161,419————19. Portage: 162,502————-19. Portage: 162,466
20. Fairfield: 146,156————20. Fairfield: 155,982————-20. Fairfield: 157,574
21. Clark: 138,333—————-21. Clark: 134,528—————-21. Clark: 134,083
22. Wood: 125,488—————22. Wood: 130,441—————-22. Wood: 130,817
23. Richland: 124,475———–23. Richland: 120,987————23. Richland: 121,154
24. Wayne: 114,520————-24. Wayne: 115,790—————-24. Wayne: 115,710
25. Columbiana: 107,841——25. Miami: 106,042—————–25. Miami: 106,987
26. Allen: 106,331—————26. Allen: 102,725——————26. Allen: 102,351
27. Miami: 102,506————–27. Columbiana: 102,473———27. Columbiana: 101,883
28. Ashtabula: 101,497———28. Ashtabula: 97,587————-28. Ashtabula: 97,241
29. Geauga: 93,389————-29. Geauga: 93,945—————-29. Geauga: 93,649
30. Tuscarawas: 92,582——–30. Tuscarawas: 92,079———-30. Tuscarawas: 91,987
31. Muskingum: 86,074———31. Muskingum: 86,131———–31. Muskingum: 86,215
32. Scioto: 79,499—————-32. Ross: 76,884——————-32. Ross: 76,666
33. Ross: 78,064——————33. Hancock: 75,920————–33. Hancock: 75,783
34. Erie: 77,079——————-34. Scioto: 75,480——————34. Scioto: 75,314
35. Hancock: 74,782————-35. Erie: 74,513———————35. Erie: 74,266
36. Belmont: 70,400————–36. Belmont: 67,533—————36. Belmont: 67,006
37. Jefferson: 69,709————37. Jefferson: 65,774—————37. Athens: 65,327
38. Marion: 66,501—————-38. Athens: 65,519—————–38. Jefferson: 65,325
39. Athens: 64,757—————-39. Marion: 65,427—————–39. Marion: 65,093
40. Lawrence: 62,450————-40. Knox: 61,900——————-40. Knox: 62,322
41. Washington: 61,778———-41. Washington: 60,111———–41. Washington: 59,911
42. Sandusky: 60,944————-42. Lawrence: 59,767————-42. Lawrence: 59,463
43. Knox: 60,921——————–43. Sandusky: 58,740————-43. Union: 58,988
44. Huron: 59,626——————-44. Huron: 58,364——————44. Sandusky: 58,518
45. Seneca: 56,745—————–45. Pickaway: 58,077————-45. Pickaway: 58,457
46. Pickaway: 55,698—————46. Union: 57,782——————46. Huron: 58,266
47. Ashland: 53,139—————–47. Seneca: 55,194—————-47. Seneca: 55,178
48. Darke: 53,139——————–48. Ashland: 53,706—————48. Ashland: 53,484
49. Union: 52,300——————–49. Darke: 51,299——————49. Darke: 51,113
50. Shelby: 49,423——————-50. Shelby: 48,622—————-50. Shelby: 48,590
51. Auglaize: 45,949—————–51. Auglaize: 45,736————-51. Logan: 45,672
52. Logan: 45,858——————–52. Logan: 45,332—————-52. Auglaize: 45,656
53. Brown: 44,846——————–53. Madison: 44,389————-53. Madison: 44,731
54. Crawford: 43,784—————-54. Holmes: 43,919—————54. Holmes: 43,960
55. Highland: 43,589—————-55. Brown: 43,570—————–55. Brown: 43,432
56. Madison: 43,435—————–56. Highland: 43,052————-56. Highland: 43,161
57. Fulton: 42,698——————–57. Fulton: 42,267—————–57. Fulton: 42,126
58. Holmes 42,366——————-58. Clinton: 42,085—————-58. Clinton: 41,968
59. Preble: 42,270——————–59. Crawford: 41,484————-59. Crawford: 41,494
60. Clinton: 42,040——————-60. Preble: 41,011—————–60. Mercer: 41,172
61. Ottawa: 41,428——————-61. Mercer: 40,952—————-61. Preble: 40,882
62. Mercer: 40,814——————-62. Ottawa: 40,769—————-62. Ottawa: 40,525
63. Champaign: 40,097————-63. Guernsey: 39,011————63. Champaign: 38,885
64. Guernsey: 40,087—————64. Champaign: 38,785———-64. Guernsey: 38,875
65. Defiance: 39,037—————-65. Defiance: 38,089————–65. Defiance: 38,087
66. Williams: 37,642—————–66. Williams: 36,739————–66. Williams: 36,692
67. Coshocton: 36,901————-67. Coshocton: 36,596———–67. Coshocton: 36,600
68. Perry: 36,058———————68. Perry: 36,039——————68. Perry: 36,134
69. Morrow: 34,827——————69. Morrow: 35,113—————-69. Morrow: 35,328
70. Putnam: 34,499——————70. Putnam: 33,802—————70. Putnam: 33,861
71. Jackson: 33,225——————71. Jackson: 32,366————–71. Jackson: 32,413
72. Hardin: 32,058——————–72. Hardin: 31,418—————-72. Hardin: 31,365
73. Gallia: 30.934———————73. Gallia: 29,945—————–73. Gallia: 29,898
74. Hocking: 29,380——————74. Fayette: 28,653—————74. Fayette: 28,525
75. Fayette: 29,030——————-75. Hocking: 28,357————–75. Van Wert: 28,275
76. Carroll: 28,836——————–76. Van Wert: 28,253————-76. Hocking: 28,264
77. Van Wert: 28,744—————–77. Pike: 27,932——————-77. Pike: 27,772
78. Pike: 28,709———————–78. Adams: 27,694—————-78. Adams: 27,698
79. Adams: 28,550——————-79. Henry: 27,092——————79. Henry: 27,006
80. Henry: 28,215———————80. Carroll: 27,082—————–80. Carroll: 26,914
81. Meigs: 23,770———————81. Meigs: 23,064—————–81. Meigs: 22,907
82. Wyandot: 22,615—————–82. Wyandot: 21,918————–82. Wyandot: 21,772
83. Paulding: 19,614—————–83. Paulding: 18,742————–83. Paulding: 18,672
84. Harrison: 15,864—————–84. Harrison: 15,167—————84. Harrison: 15,040
85. Morgan: 15,054——————85. Morgan: 14,581—————-85. Morgan: 14,508
86. Noble: 14,645———————86. Noble: 14,347——————86. Noble: 14,424
87. Monroe: 14,642——————-87. Monroe: 13,787—————87. Monroe: 13,654
88. Vinton: 13,435———————88. Vinton: 13,145—————-88. Vinton: 13,085

And here are the Top 25 Fastest Growing Counties by Total Growth by Time Period
Census 2010-July 1, 2019————————–July 1, 2018-July 1, 2019
1. Franklin: 153,342————————————1. Franklin: 9,058
2. Delaware: 34,963————————————2. Delaware: 4,086
3. Warren: 21,909—————————————3. Warren: 2,657
4. Hamilton: 15,099————————————-4. Hamilton: 2,028
5. Butler: 15,004—————————————–5. Fairfield: 1,592
6. Fairfield: 11,418————————————–6. Greene: 1,491
7. Licking: 10,370—————————————7. Union: 1,206
8. Clermont: 9,065————————————–8. Licking: 1,196
9. Lorain: 8,477——————————————9. Butler: 1,134
10. Medina: 7,414————————————–10. Miami: 945
11. Greene: 7,364————————————–11. Clermont: 902
12. Union: 6,688—————————————-12. Lorain: 781
13. Wood: 5,329—————————————-13. Medina: 768
14. Miami: 4,481—————————————-14. Knox: 422
15. Pickaway: 2,759———————————–15. Pickaway: 380
16. Holmes: 1,594————————————–16. Wood: 376
17. Knox: 1,401——————————————17. Madison: 342
18. Madison: 1,296————————————–18. Logan: 340
19. Wayne: 1,190—————————————-19. Mercer: 220
20. Portage: 1,047—————————————20. Morrow: 215
21. Hancock: 1,001————————————–21. Richland: 167
22. Athens: 570——————————————22. Highland: 109
23. Morrow: 501——————————————23. Champaign: 100
24. Mercer: 358——————————————24. Perry: 95
25. Ashland: 345—————————————–25. Montgomery: 87

Top 25 Slowest Growing Counties by Total Growth by Time Period
Census 2010-July 1, 2019——————————-July 1, 2018-July 1, 2019
1. Cuyahoga: -45,050————————————1. Cuyahoga: -6,646
2. Lucas: -13,467——————————————2. Lucas: -1,264
3. Trumbull: -12,338—————————————3. Stark: -642
4. Mahoning: -10,140————————————-4. Columbiana: -590
5. Columbiana: -5,958————————————5. Trumbull: -565
6. Stark: -4,980———————————————6. Mahoning: -533
7. Jefferson: -4,384—————————————-7. Belmont: -527
8. Ashtabula: -4,256—————————————8. Jefferson: -449
9. Clark: -4,250———————————————9. Clark: -445
10. Scioto: -4,185——————————————10. Allen: -374
11. Allen: -3,980——————————————–11. Ashtabula: -346
12. Montgomery: -3,466———————————-12. Summit: -340
13. Belmont: -3,394—————————————-13. Marion: -334
14. Richland: -3,321—————————————-14. Lawrence: -304
15. Lawrence: -2,987————————————–15. Geauga: -296
16. Erie: -2,813———————————————-16. Erie: -247
17. Sandusky: -2,426————————————–17. Ottawa: -244
18. Crawford: -2,290—————————————18. Ashland: -222
19. Carroll: -1,922——————————————-19. Sandusky: -222
20. Washington: -1,867————————————20. Ross: -218
21. Darke: -1,846——————————————–21. Washington: -200
22. Seneca: -1,567——————————————22. Athens: -192
23. Brown: -1,414——————————————–23. Darke: -186
24. Marion: -1,408——————————————-24. Carroll: -168
25. Ross: -1,398———————————————25. Scioto: -166

Franklin County continues to vastly outpace all other 87 in the state.