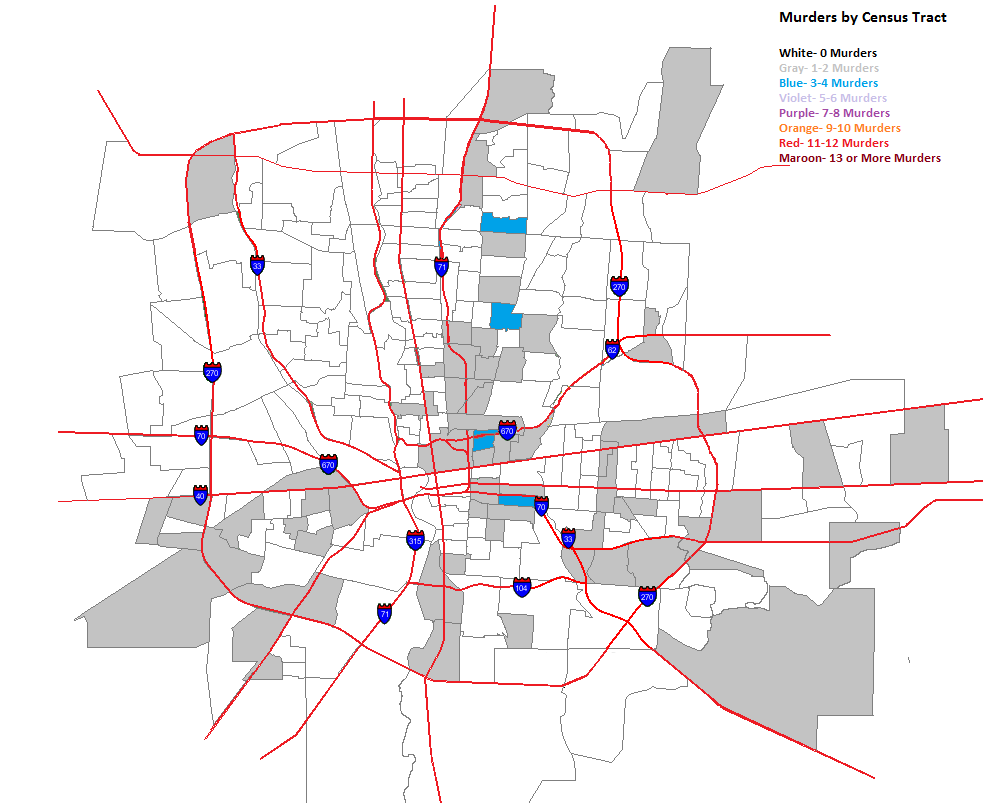
A few days ago, I posted maps for murders by zip code. Because zip codes encompass such large areas, they aren’t as accurate in showing where murders are taking place within them. To help show this more, I broke the maps down into Columbus murders by census tract. While the tracts can include large areas also, they are much smaller than zip codes and allow us to see more at the neighborhood level.
So here they are.
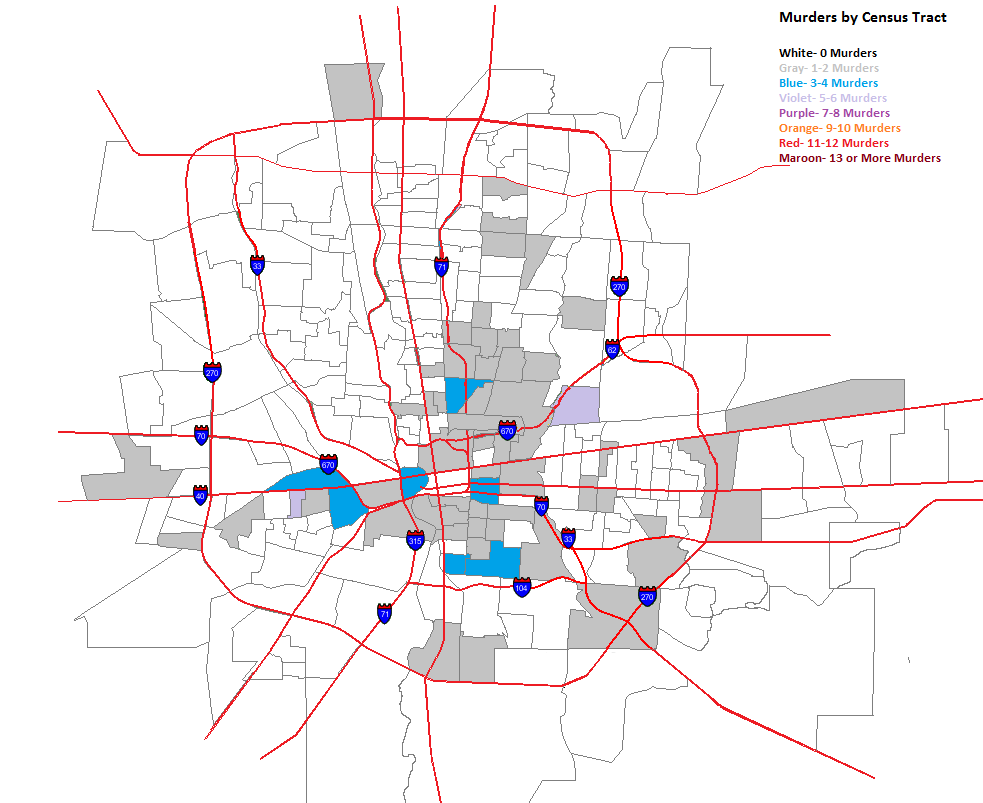
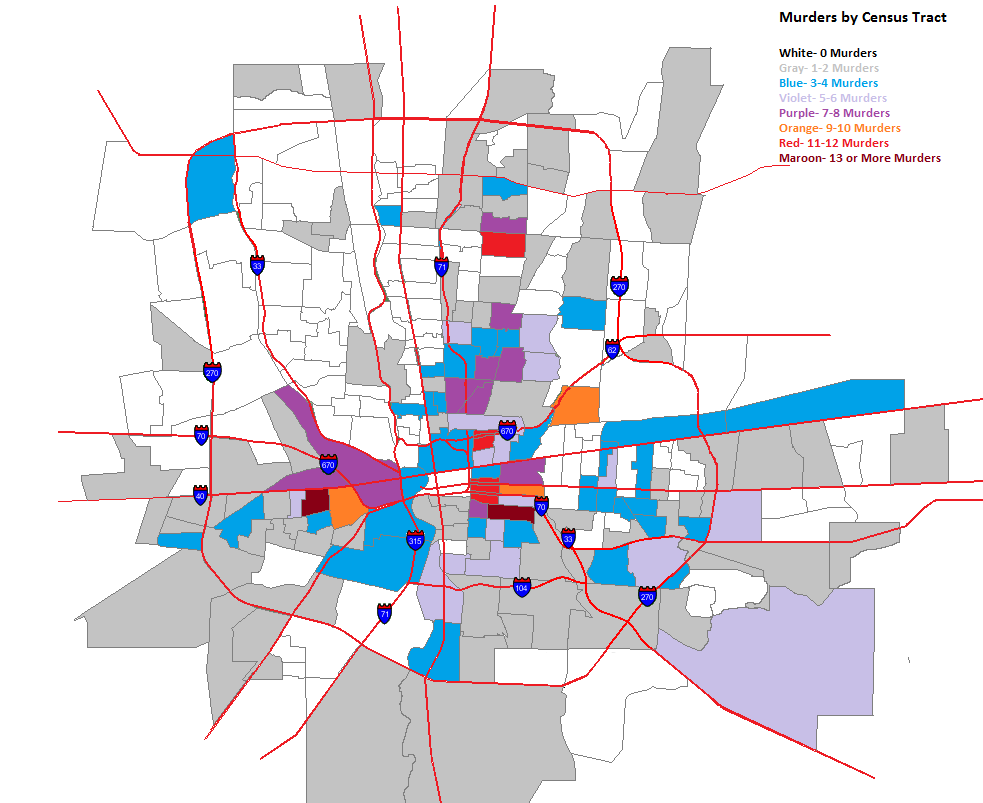
The same forces spreading murder further out into the suburbs in the zip codes seems to be at play in tracts as well. Here are the totals for the entire period.
The High Street corridor from Merion Village up through Worthington has very low or non-existent murder rates. This is also true for most of Whitehall, surprisingly, Bexley, most of the Northwest Side and much of the North Side, apart from the Tamarack Circle area.
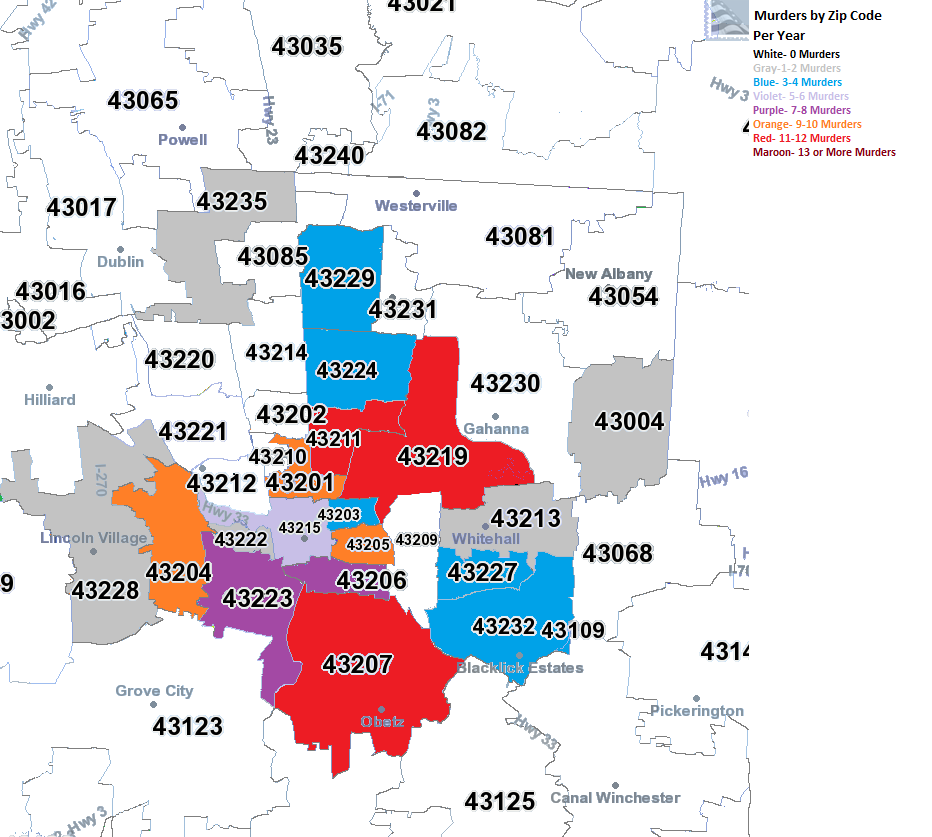
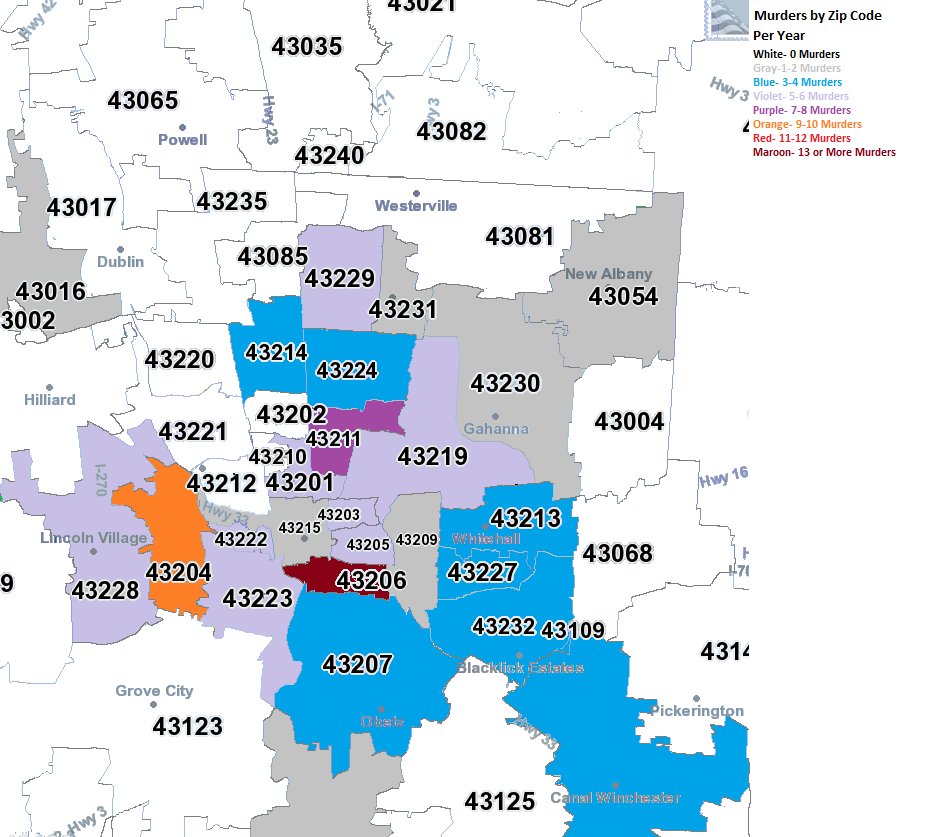
I have been wanting to do these maps for awhile now, as there have been several searches on the site for them and they weren’t available. The maps look at Columbus murders by zip code 2008-2012, highlighting which zip codes have seen the most murders by year and across the period as a whole.
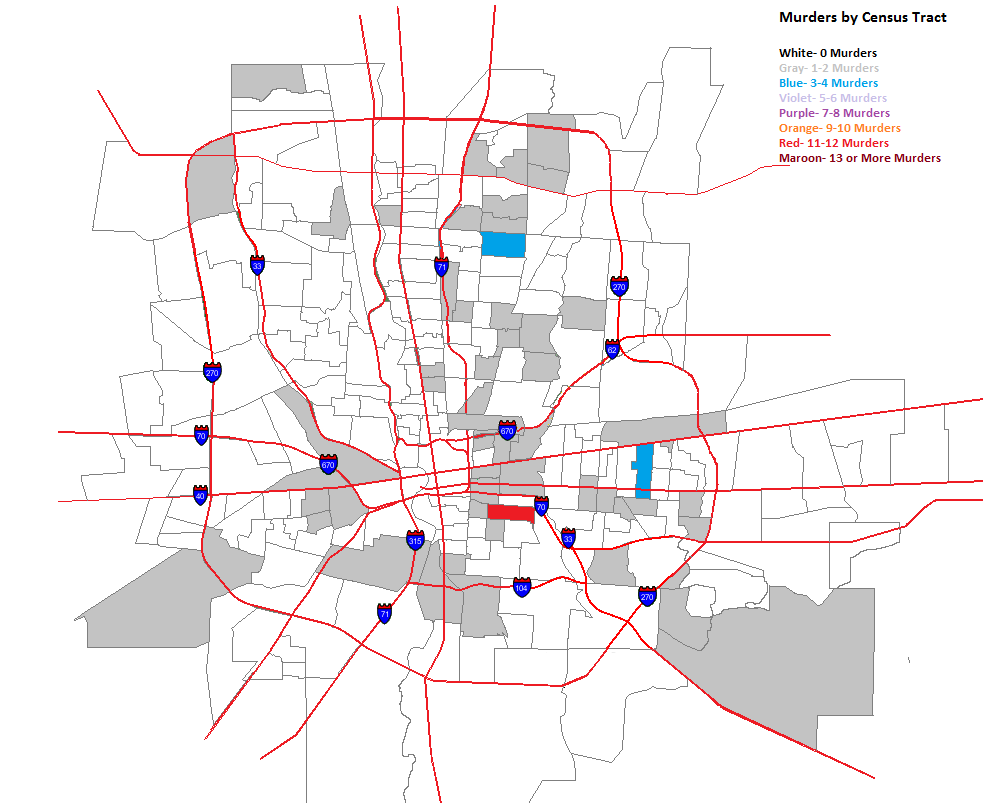
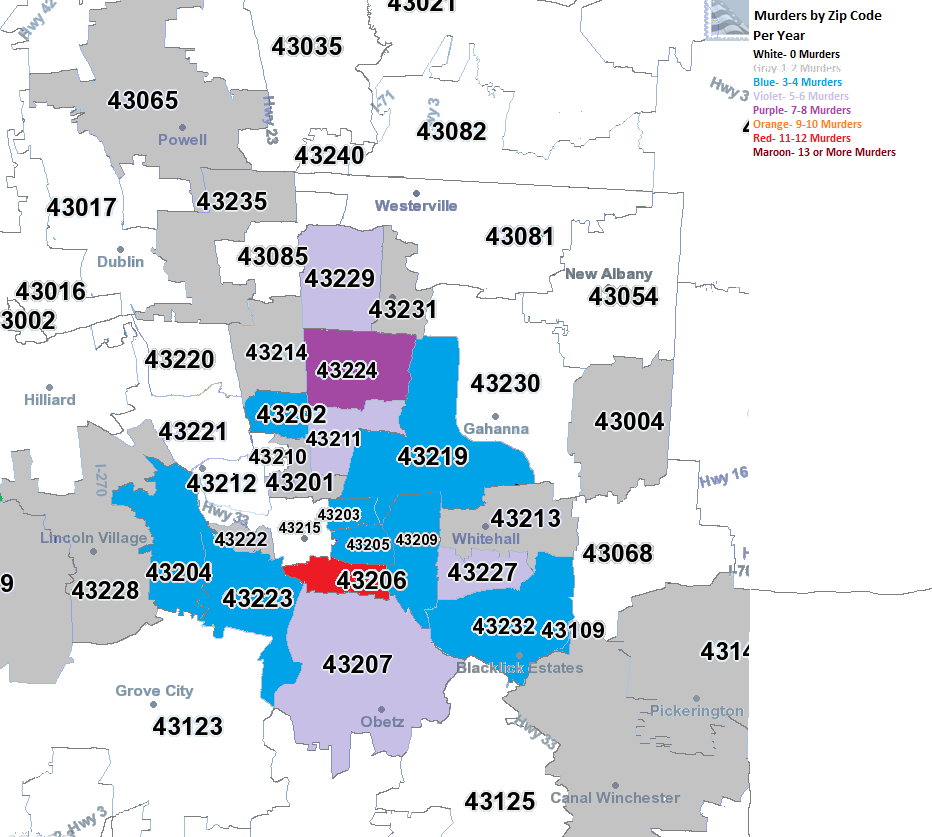
2008 In 2008, almost all murders were contained within the I-270 boundaries. The East and South Sides were the worst areas.
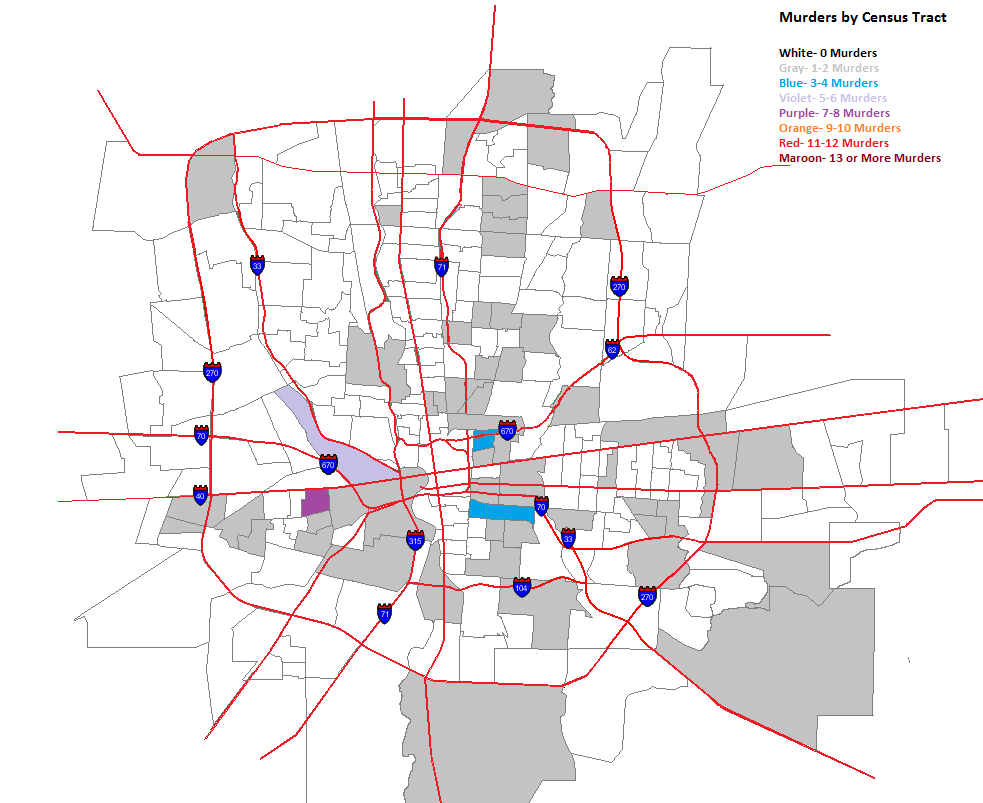
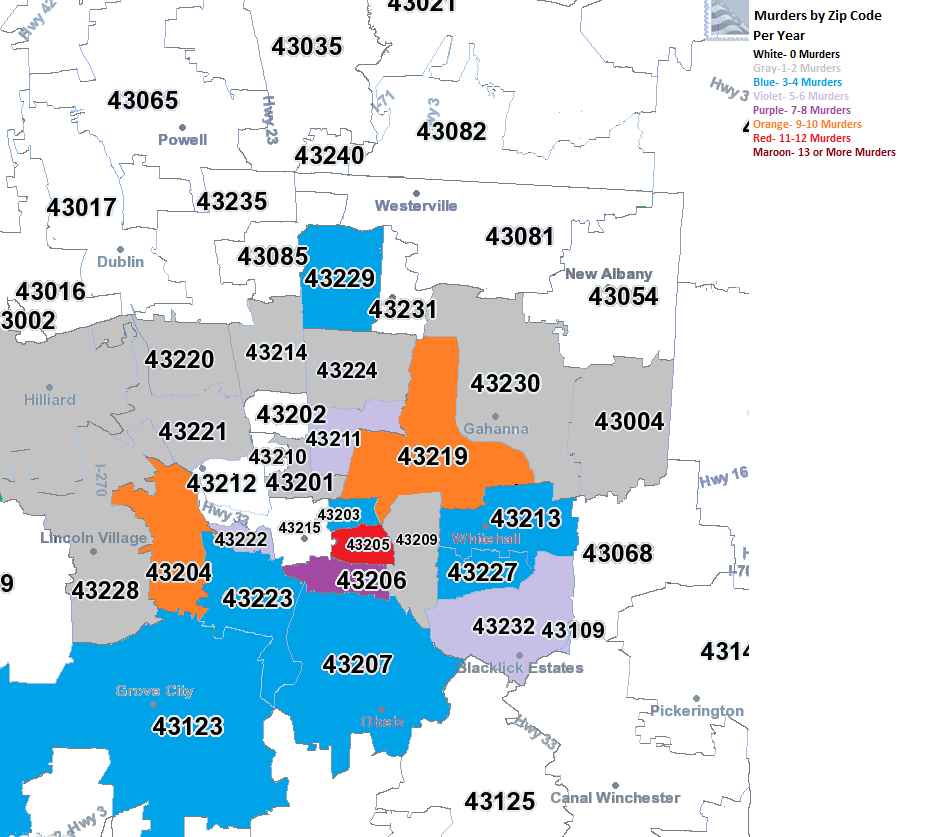
2009 In 2009, there began to be a bit of diffusion on where murder was taking place. While parts of the urban core remained the worst areas, suburban areas also saw the occasional murder.
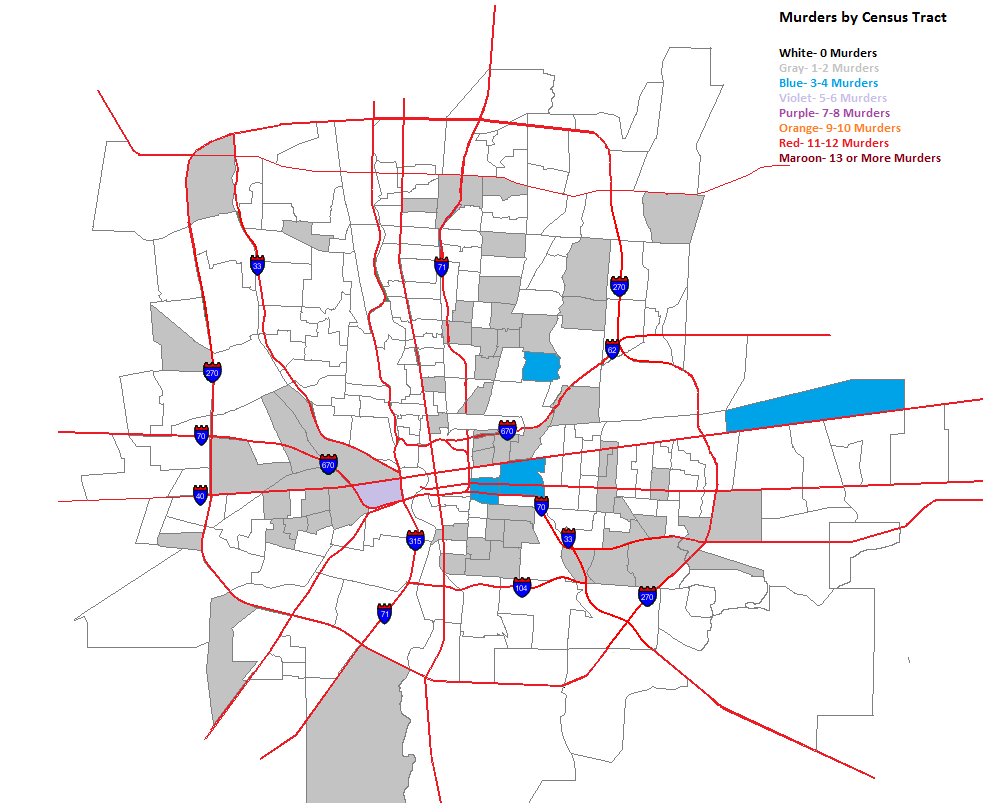
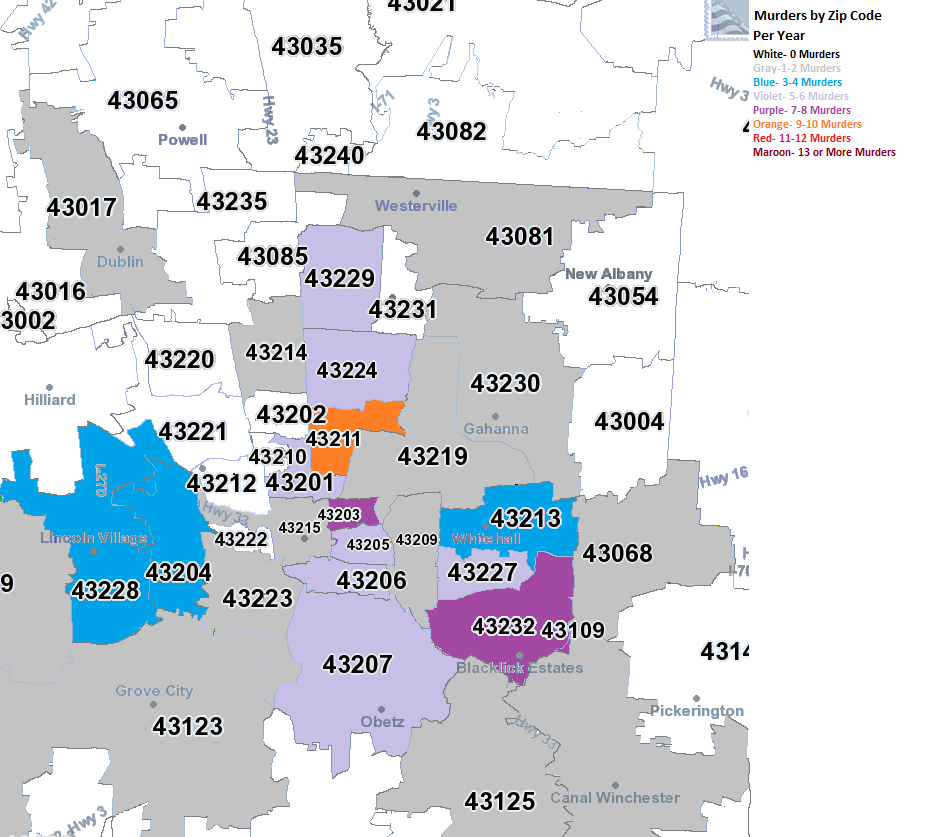
2010 The diffusion continued in 2010.
2011 And in 2011.
2012 2012 was the most diffuse of all the years, with no heavily concentrated areas, even in the urban core as much. Meanwhile, most of the suburban zip codes within Franklin County saw at least 1 murder.
The question is, what do we make of this? This is only a 5-year data set, but it may be supporting evidence for current urban trends. The first trend being that the urban core is rapidly gentrifying in many areas. The second being that poverty is, through economic and development trends, is spreading further out from the core. Concentrated poverty and crime go hand in hand, so while the suburbs may see a bit of increase in crime, the urban core is starting to see less. Something to watch over time to see if such trends continue.
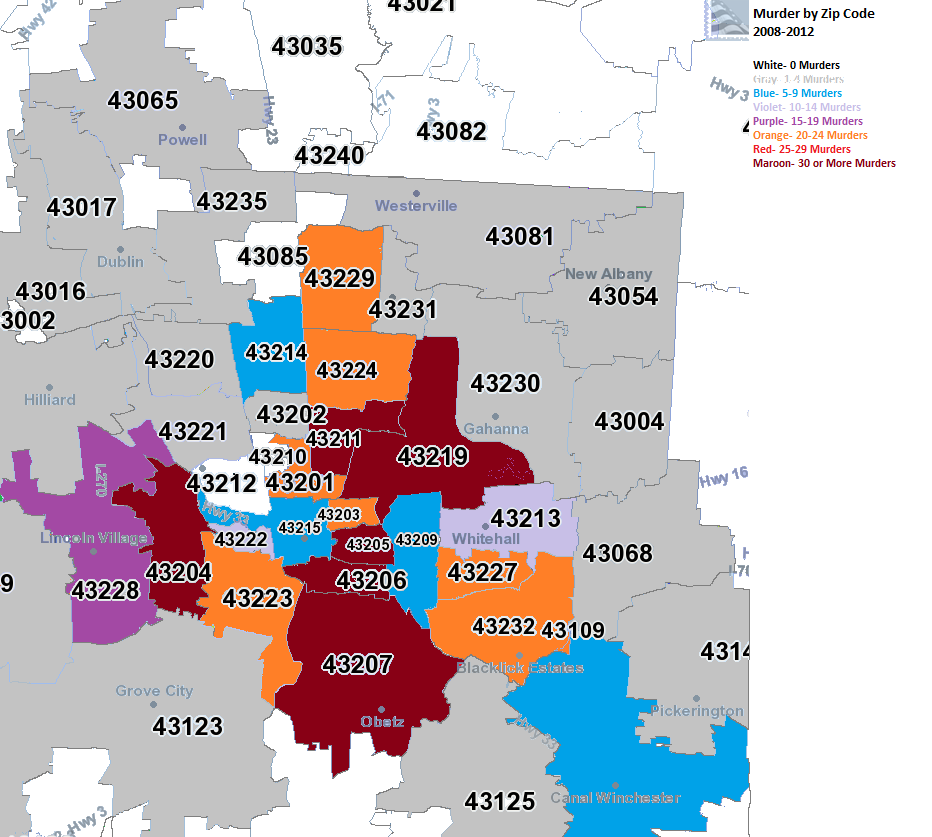
2008-2012 What strikes me about the 5-year map is that Grandview/Upper Arlington have been entirely murder free while every zip around them have had at least one. Also, Downtown is also relatively murder free, as is Bexley and the Clintonville areas.
Of course, zip codes include large areas. What are the neighborhoods that are actually seeing murders and which ones are not? To find out, we’ll have to go down to the tract level. Over the next few days, I’ll post those maps.
Columbus City Unemployment Rate: 5.7% Unemployment Rate Change since April 2012: -0.6 Unemployment Rate Change since January 2013: -1.1 Civilian Labor Force: 425,600 Civilian Labor Force Change since April 2012: +200 Civilian Labor Force Change since January 2013: -800 Employment: 401,400 Employment Change since April 2012: +2,800 Employment Change since January 2013: +4,100 Unemployment: 24,200 Unemployment Change since April 2012: -2,500 Unemployment Change since January 2013: -4,900
Franklin County Unemployment Rate: 5.7% Unemployment Rate Change since April 2012: -0.5 Unemployment Rate Change since January 2013: -1.1 Civilian Labor Force: 622,300 Civilian Labor Force Change since April 2012: +600 Civilian Labor Force Change since January 2013: -1,400 Employment: 587,100 Employment Change since April 2012: +4,100 Employment Change since January 2013: +6,100 Unemployment: 35,200 Unemployment Change since April 2012: -3,400 Unemployment Change since January 2013: -7,400
Columbus Metro Area Unemployment Rate: 5.7% Unemployment Rate Change since April 2012: -0.4 Unemployment Rate Change since January 2013: -1.3 Civilian Labor Force: 964,400 Civilian Labor Force Change since April 2012: +1,700 Civilian Labor Force Change since January 2013: -3,500 Employment: 909,800 Employment Change since April 2012: +6,300 Employment Change since January 2013: +9,300 Unemployment: 54,600 Unemployment Change since April 2012: -4,600 Unemployment Change since January 2013: -12,800
Ohio Overall Unemployment Rate: 7.0% Unemployment Rate Change since April 2012: -0.3 Unemployment Rate Change since January 2013 : +0.0 Civilian Labor Force: 5,741,116 Civilian Labor Force Change since April 2012: -22,664 Civilian Labor Force Change since January 2013: +824 Employment: 5,341,401 Employment Change since April 2012: -1,270 Employment Change since January 2013: +549 Unemployment: 399,715 Unemployment Change since April 2012: -21,394 loyment Change since January 2013: +275
Non-Farm Jobs Total: 954,100 Change from April 2012: +7,000 Change from January 2013: +9,500
By Industry Mining/Logging/Construction Total: 28,400 Change from April 2012: -500 Change from January 2013: +1,500
Manufacturing Total: 66,500 Change from April 2012: +700 Change from January 2013: +1,500
Trade/Transportation/Utilities Total: 179,600 Change from April 2012: -900 Change from January 2013: -3,600
Information Total: 16,400 Change from April 2012: -300 Change from January 2013: -100
Financial Activities Total: 71,400 Change from April 2012: +300 Change from January 2013: -300
Professional and Business Services Total: 158,300 Change from April 2012: +1,000 Change from January 2013: +2,700
Education and Health Services Total: 141,000 Change from April 2012: +3,000 Change from January 2013: +1,500
Leisure and Hospitality Total: 95,200 Change from April 2012: +3,800 Change from January 2013: +6,700
Other Services Total: 36,100 Change from April 2012: -100 Change from January 2013: -100
Government Total: 161,200 Change from April 2012: +0 Change from January 2013: +700
Columbus poverty, like poverty everywhere else, is not exactly a positive metric. But how does its own rate compare to that of other Ohio cities? The following numbers are based off the American Community Survey. They are estimates, not physical counts like the population census, so there is a definite fudge factor involved with them as to their overall accuracy. 2011 is the latest year available for the ACS estimates.
2011 % of City Population Living in Poverty, Lowest to Highest 1. Columbus: 23.2% 2. Akron: 28.9% 3. Cincinnati: 29.5% 4. Toledo: 30.1% 5. Youngstown: 33.2% 6. Cleveland: 34.3% 7. Dayton: 35.7%
During and just after the recession’s housing crash, single-family home construction in the Columbus area seemed to fall apart, much like it did across the nation. Foreclosure rates soared, prices fell and builders were suddenly left with too many homes they couldn’t get rid of.
Out of the ashes of this market rose a surge in rental demand. It suddenly made more and more sense to rent rather than to own, especially for young professionals and empty nesters who wanted to downsize during tough economic times. Not only did what housing people wanted change, but so did where they wanted it to be located.
Columbus experienced a relative boom in rental housing during the late 1990s into the first few years of the 2000s, but almost all of that rental housing was constructed along and outside of I-270, where the suburbs were exploding with growth. Inside of 270 saw little of this, and the urban core neighborhoods around Downtown were almost completely ignored altogether. Single-family housing became popular again during the early 2000s mild recession, and the housing boom that would help lead to the Great Recession of 2007-2009 really began at that time. However, it was in 2002 that the City and Mayor Coleman came up with a 10-year plan to help bring more residents to Downtown. It began offering tax incentives to developers who would build there, in some cases 100% abatements, in a goal to have 10,000 residential units built in and around Downtown by 2012.
I’ve done a ton of research on the results of this move by the city, and it did have an impact. From what I’ve been able to find (so far), Downtown and the surrounding neighborhoods saw the addition of less than 200 residential units between 2000 and 2002. 2003 saw over 500 alone with the new incentives package in place. Between 2003 and 2006, the area added over 2,000 new residential units, most of them condos. As the Great Recession hit in 2007, the rate of new projects slowed to half of what it was, though still higher than it was prior to 2003.
As the Great Recession eased and more financing became available, construction began to pick up once more. With the new trends in favor of urban living and rentals, the rental market has exploded and overall Columbus residential development is booming across all parts of the city.