Repost
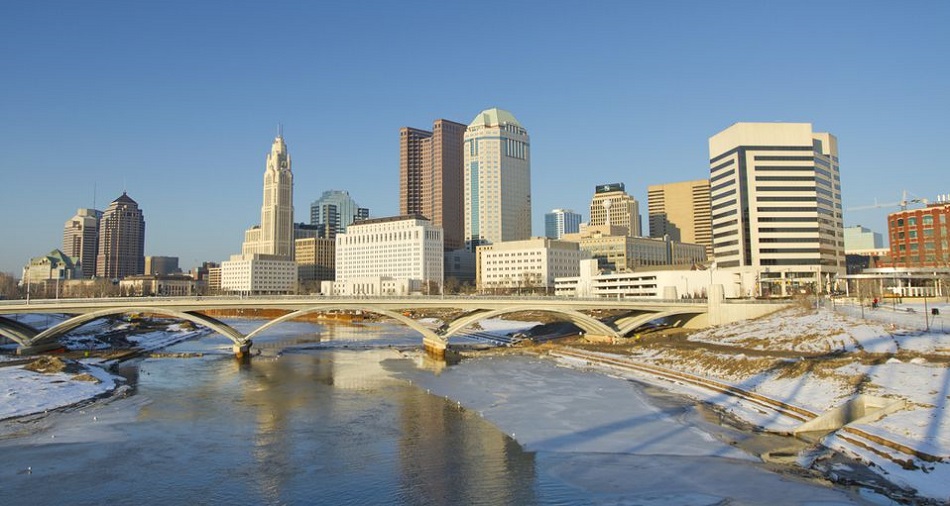
The March, 2008 Columbus snowstorm was a historic and memorable event that will likely not be surpassed for a very long time, if ever. More than one week prior to the Blizzard of 2008, models had been hinting at a significant storm somewhere in the eastern US. Initially, models took the storm up the East Coast, but as the storm neared, models moved it further and further west and settled upon a track just west/just along the spine of the Appalachians. The track waffled for days, but never strayed far from the Appalachian track. Because the storm was originating near the Gulf of Mexico, models were showing the storm pulling vast amounts of moisture north into cold air over the Ohio Valley. Simply put, the track and conditions were being forecast to be perfect for a significant Ohio snowstorm.
Local forecasters, however, weren’t buying it… at least not at first. Four days before the storm, neither the NWS nor the television forecasters were calling for a significant event. The winter of 2007-08 had brought several storm busts, and none of them seemed ready to buy into another one. So right up to 24-36 hours before the event began, most forecasters were calling for 6″ maximum north and west of the I-71 corridor with a mix along the corridor and mostly rain to the south and east.
At 4AM on March 6th, the National Weather Service issued a Winter Storm Watch for parts of Ohio, including Central Ohio. The Watch called for 5″-10″ northwest of I-71, with lesser amounts along 71 due to a predicted changeover to sleet and freezing rain and far less just to the south and east.
URGENT – WINTER WEATHER MESSAGE
NATIONAL WEATHER SERVICE WILMINGTON OH
353 AM EST THU MAR 6 2008
INZ050-058-059-066-073>075-080-KYZ089>095-OHZ026-034-035-042>046-
051>056-060>063-070>072-077-078-061700-
/O.NEW.KILN.WS.A.0005.080307T1200Z-080309T0000Z/
WAYNE-FAYETTE IN-UNION IN-FRANKLIN IN-RIPLEY-DEARBORN-OHIO-
SWITZERLAND-CARROLL-GALLATIN-BOONE-KENTON-CAMPBELL-OWEN-GRANT-
HARDIN-MERCER-AUGLAIZE-DARKE-SHELBY-LOGAN-UNION OH-DELAWARE-MIAMI-
CHAMPAIGN-CLARK-MADISON-FRANKLIN OH-LICKING-PREBLE-MONTGOMERY-
GREENE-FAYETTE OH-BUTLER-WARREN-CLINTON-HAMILTON-CLERMONT-
INCLUDING THE CITIES OF…RICHMOND…CONNERSVILLE…LIBERTY…
BROOKVILLE…VERSAILLES…LAWRENCEBURG…RISING SUN…VEVAY…
CARROLLTON…WARSAW…BURLINGTON…INDEPENDENCE…ALEXANDRIA…
OWENTON…WILLIAMSTOWN…KENTON…CELINA…WAPAKONETA…
GREENVILLE…SIDNEY…BELLEFONTAINE…MARYSVILLE…DELAWARE…
PIQUA…URBANA…SPRINGFIELD…LONDON…COLUMBUS…NEWARK…
EATON…DAYTON…XENIA…WASHINGTON COURT HOUSE…HAMILTON…
LEBANON…WILMINGTON…CINCINNATI…MILFORD
353 AM EST THU MAR 6 2008
…WINTER STORM WATCH IN EFFECT FROM FRIDAY MORNING THROUGH
SATURDAY EVENING…
THE NATIONAL WEATHER SERVICE IN WILMINGTON HAS ISSUED A WINTER
STORM WATCH…WHICH IS IN EFFECT FROM FRIDAY MORNING THROUGH
SATURDAY EVENING.
LOW PRESSURE WILL DEVELOP IN THE LOWER MISSISSIPPI VALLEY LATE
TONIGHT AND LIFT NORTHEAST INTO THE TENNESSEE AND OHIO VALLEYS
FRIDAY AND SATURDAY. SNOW WILL OVERSPREAD THE REGION FROM THE
SOUTH ON FRIDAY MORNING. THE SNOW WILL LIKELY MIX WITH OR
CHANGE OVER TO SLEET AND FREEZING RAIN FRIDAY AFTERNOON AND
EVENING ALONG AND TO THE EAST OF THE INTERSTATE 71 CORRIDOR FROM
CINCINNATI TO COLUMBUS. AS COLDER AIR FILTERS BACK INTO THE
REGION…ANY MIXED PRECIPITATION WILL CHANGE BACK TO ALL SNOW
FRIDAY NIGHT AND CONTINUE INTO SATURDAY. MINOR ICE ACCUMULATIONS
ON TREES AND POWER LINES WILL BE POSSIBLE. PRECIPITATION WILL
REMAIN MOSTLY ALL SNOW WEST OF THE INTERSTATE 71 CORRIDOR. 5 TO 10
INCHES OF SNOW WILL BE POSSIBLE IN THESE AREAS…WITH LIGHTER
AMOUNTS FURTHER EAST WHERE SNOW MIXES WITH FREEZING RAIN AND
SLEET.
THE EXACT PATH AND STRENGTH OF THE SYSTEM IS STILL IN QUESTION.
IF THE SYSTEM MOVES FARTHER WEST MORE WARM AIR WILL LIFT INTO THE
REGION…CAUSING LOWER SNOWFALL TOTALS AND MORE MIXED PRECIPITATION.
IF THE SYSTEM SLIDES FARTHER EAST…LESS MIXED PRECIPITATION WOULD
OCCUR AND SNOWFALL TOTALS WOULD BE HIGHER.
The Watch above did acknowledge that less mix could lead to higher totals, but nothing to the degree that would eventually fall. By later on the afternoon of the 6th, Watch totals did begin to creep up somewhat to 6″-10″ for the I-71 corridor, but the forecast still called for significant icing.
A Winter Storm Warning was finally issued at 4:30AM on March 7th, just hours before the snow would begin to fall.
OHZ045-046-053>056-062-063-071-072-078-071745-
/O.UPG.KILN.WS.A.0005.080307T1200Z-080309T0000Z/
/O.NEW.KILN.WS.W.0006.080307T1700Z-080308T2100Z/
UNION OH-DELAWARE-CLARK-MADISON-FRANKLIN OH-LICKING-GREENE-
FAYETTE OH-WARREN-CLINTON-CLERMONT-
INCLUDING THE CITIES OF…MARYSVILLE…DELAWARE…SPRINGFIELD…
LONDON…COLUMBUS…NEWARK…XENIA…WASHINGTON COURT HOUSE…
LEBANON…WILMINGTON…MILFORD
436 AM EST FRI MAR 7 2008
…WINTER STORM WARNING IN EFFECT FROM NOON TODAY TO 4 PM EST
SATURDAY…
THE NATIONAL WEATHER SERVICE IN WILMINGTON HAS ISSUED A WINTER
STORM WARNING…WHICH IS IN EFFECT FROM NOON TODAY TO 4 PM EST
SATURDAY.
LIGHT SNOW WILL OVERSPREAD THE REGION LATE THIS MORNING. THE SNOW
WILL BECOME HEAVIER THIS AFTERNOON…AND LAST THROUGH SATURDAY
AFTERNOON. FIVE TO SEVEN INCHES OF SNOW IS EXPECTED
TONIGHT…WITH AN ADDITIONAL FIVE TO SEVEN INCHES FALLING SATURDAY
MORNING. SNOW WILL TAPER OFF AND END SATURDAY AFTERNOON. IN
ADDITION…NORTH WINDS AT 20 TO 30 MPH WITH HIGHER GUSTS WILL
CAUSE SIGNIFICANT BLOWING AND DRIFTING…AND LIMIT VISIBILITIES TO
NEAR ZERO AT TIMES. BY LATE SATURDAY AFTERNOON…A FOOT OR MORE OF
SNOW IS EXPECTED WITH DRIFTS OVER TWO FEET.
The Warning abandoned all mention of mixing as models came in colder, and totals were now predicted to be at least a foot in the Columbus area with near blizzard conditions.
My personal account of the storm:
On Thursday, March 6th, I worked a 12-hour day at my store. Customers were talking about forecasts of 4-8″, which in central Ohio is significant in and of itself. We typically get one or two 6″ storms, but rarely up to 8″ and almost never more than that. In fact, in all of Columbus history, there have been less than a dozen snow events that broke double digits. Still, in the talking there were whispers that the storm would be more significant. By Thursday night when I arrived home, I discovered the radar was lit up over the South with a growing area of precipitation heading north. Temperatures had already cooled into the low 30s as a cold front had moved through during the day. Forecasts had changed late in the afternoon, and there were many calls of 6-10″ along I-71 by Sunday.
Friday, March 7th was my day off, and I woke up before 8am in the excitement and inticipation of the impending snow. The radar was showing returns north of the Ohio River then and it was already snowing in Cincinnati. Finally, at 9:05am, flurries began to fall and quickly intensified to a steady, windblown snow. A 9:30, I left the house to go to the store. By the time I reached it, the snow had turned heavy and was accumulating quickly. Visibility had dropped to a 1/4 mile at times and many roads were already snowcovered by the time I reached home.
The snow continued throughout the day and forecasts kept changing. At 3:30PM, the Winter Storm Warning was upgraded to a Blizzard Warning for the entire area until 4PM the following day.
URGENT – WINTER WEATHER MESSAGE
NATIONAL WEATHER SERVICE WILMINGTON OH
325 PM EST FRI MAR 7 2008
…EXTREME WINTER WEATHER CONDITIONS EXPECTED THROUGH SATURDAY AFTERNOON…
.A MAJOR WINTER STORM WILL CONTINUE TO AFFECT THE OHIO VALLEY
OVERNIGHT INTO SATURDAY. THIS STORM WILL HIT AS A ONE TWO PUNCH.
THE INITIAL PUNCH TODAY…FOLLOWED BY A BRIEF LULL IN THE SNOW
INTENSITY THIS EVENING…BEFORE PICKING UP IN INTENSITY AGAIN
OVERNIGHT WHEN STRONG LOW PRESSURE WILL COMBINE WITH AN UPPER
LEVEL DISTURBANCE TO BRING A SECOND ROUND OF HEAVY SNOW TO THE
REGION. WINDS WILL GUST UP TO 40 MPH AT TIMES OVERNIGHT…THESE
WINDS COMBINED WITH SNOW AND BLOWING SNOW WILL CAUSE EXTREME
WINTER WEATHER CONDITIONS.
INZ066-073>075-080-KYZ089>099-OHZ026-043>046-051>056-060>065-
070>073-077>080-082-080430-
/O.CAN.KILN.WS.W.0006.000000T0000Z-080308T2100Z/
/O.NEW.KILN.BZ.W.0001.080307T2025Z-080308T2100Z/
FRANKLIN IN-RIPLEY-DEARBORN-OHIO-SWITZERLAND-CARROLL-GALLATIN-
BOONE-KENTON-CAMPBELL-OWEN-GRANT-PENDLETON-BRACKEN-ROBERTSON-
MASON-HARDIN-SHELBY-LOGAN-UNION OH-DELAWARE-MIAMI-CHAMPAIGN-CLARK-
MADISON-FRANKLIN OH-LICKING-PREBLE-MONTGOMERY-GREENE-FAYETTE OH-
PICKAWAY-FAIRFIELD-BUTLER-WARREN-CLINTON-ROSS-HAMILTON-CLERMONT-
BROWN-HIGHLAND-PIKE-
INCLUDING THE CITIES OF…BROOKVILLE…VERSAILLES…
LAWRENCEBURG…RISING SUN…VEVAY…CARROLLTON…WARSAW…
BURLINGTON…INDEPENDENCE…ALEXANDRIA…OWENTON…WILLIAMSTOWN…
FALMOUTH…BROOKSVILLE…MOUNT OLIVET…MAYSVILLE…KENTON…
SIDNEY…BELLEFONTAINE…MARYSVILLE…DELAWARE…PIQUA…URBANA…
SPRINGFIELD…LONDON…COLUMBUS…NEWARK…EATON…DAYTON…
XENIA…WASHINGTON COURT HOUSE…CIRCLEVILLE…LANCASTER…
HAMILTON…LEBANON…WILMINGTON…CHILLICOTHE…CINCINNATI…
MILFORD…GEORGETOWN…HILLSBORO…PIKETON
325 PM EST FRI MAR 7 2008
…BLIZZARD WARNING IN EFFECT UNTIL 4 PM EST SATURDAY…
…WINTER STORM WARNING IS CANCELLED…
THE NATIONAL WEATHER SERVICE IN WILMINGTON HAS ISSUED A BLIZZARD
WARNING…WHICH IS IN EFFECT UNTIL 4 PM EST SATURDAY. THE WINTER
STORM WARNING HAS BEEN CANCELLED.
A MAJOR WINTER STORM WILL CONTINUE TO AFFECT THE OHIO VALLEY
OVERNIGHT INTO SATURDAY. THIS STORM WILL HIT AS A ONE TWO PUNCH.
THE INITIAL PUNCH TODAY…FOLLOWED BY A BRIEF LULL IN THE SNOW
INTENSITY THIS EVENING…BEFORE PICKING UP IN INTENSITY AGAIN
OVERNIGHT WHEN STRONG LOW PRESSURE WILL COMBINE WITH AN UPPER
LEVEL DISTURBANCE TO BRING A SECOND ROUND OF HEAVY SNOW TO THE
REGION. WINDS WILL GUST UP TO 40 MPH AT TIMES OVERNIGHT. BEFORE
THE STORM ENDS SATURDAY AFTERNOON…YOU CAN EXPECT 10 TO 15 INCHES
OF ACCUMULATION. THE STRONG WINDS COMBINED WITH SNOW AND BLOWING
SNOW WILL CAUSE EXTREME WINTER WEATHER CONDITIONS. THE SNOW AND
BLOWING SNOW WILL REDUCE VISIBILITIES TO NEAR ZERO AT TIMES
CAUSING WHITEOUT…AND BLIZZARD CONDITIONS.
DO NOT TRAVEL UNLESS ABSOLUTELY NECESSARY. CONDITIONS CAN DETERIORATE
RAPIDLY IN BLIZZARD CONDITIONS.
Meanwhile, the snow continued into the evening and overnight hours of the 7th. Although it did lighten somewhat towards midnight, it never completely stopped. By midnight, in any case, 5-7″ had fallen throughout Columbus and central Ohio, which set a daily record.
Saturday, March 8th dawned very wintry. By dawn, no less than 10″ was on the ground and the snow was continuing to fall heavily. Winds were generally sustained near 20mph in the morning and increased during the late morning/early afternoon. Heavy snow and winds combined to create total whiteout conditions at times, and every county along I-71 from Cincinnati to Cleveland went under a level 2 or level 3 snow emergency.
At 11am, I went for a walk in the snow. It was still falling heavily and roads were nearly impassable with deep snow. Cars in some cases were buried in snow.
By 2pm, a break in the snowfall came as the low moved to the east of Ohio. When it moved into New York, wraparound snow moved back into the area for 3-4 more hours before ending by 6:30pm Saturday afternoon. The sun even poked through the clouds as it set, producing a very picturesque and beautiful winter scene. A fitting end to the day.
All in all, it was a record setting snowstorm all across the state. Columbus’ 20.5″ of snowfall, including 15.5″ on Saturday alone, was the greatest snowstorm of all time for the city. It also established the greatest 24-hour snowfall and the greatest snow depth ever recorded for any month at 18″. No part of the state was spared, as all major cities except Toledo had 10″ or more. Drifts of 5-7 feet deep were reported in many areas.
Aside from Columbus’ record, here were some other totals across Ohio.
Cincinnati: 10.7″
Dayton: 15.4″
Lancaster: 17.0″
Akron: 17.1″
Marysville: 15.5″
Chillicothe: 14.0″
Westerville: 15.0″
Grove City: 11.3″
London: 17.0″
Cleveland: 14.8″
Delaware: 13.5″
Springfield: 15.0″
Belletontaine: 11.0″
Circleville: 13.5″
The storm also brought some areas of the state to record territory in total seasonal snowfall.
Incidentally, 30 years and 2 months prior, the Great Blizzard of 1978 struck. It is somewhat of note that Ohio’s greatest blizzards on record occurred during the “8” years. 1918, 1978, and now 2008.
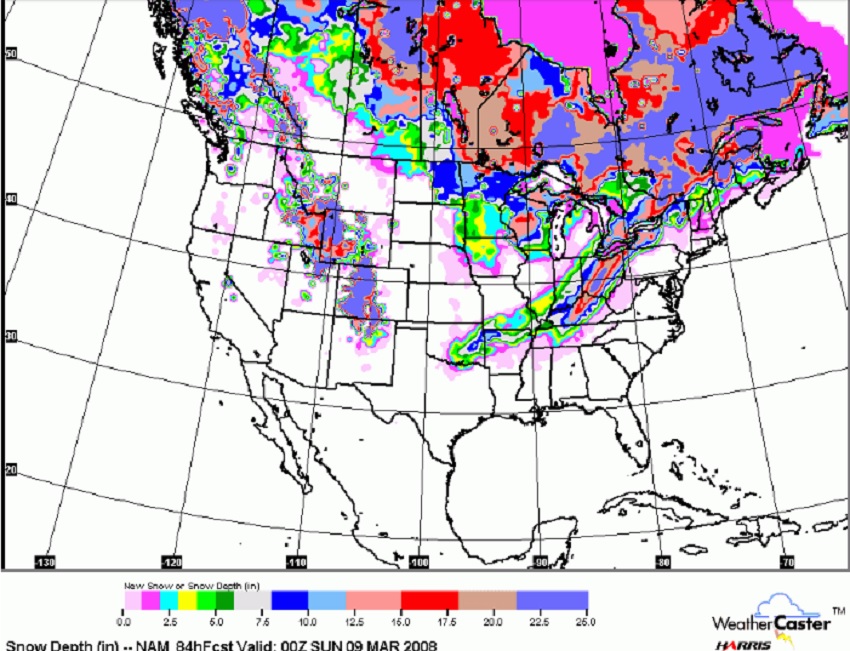
The first image below is a model snow depth forecast ending on March 9th. The second is a photo of the heavy snow in Columbus during the evening of the 7th.
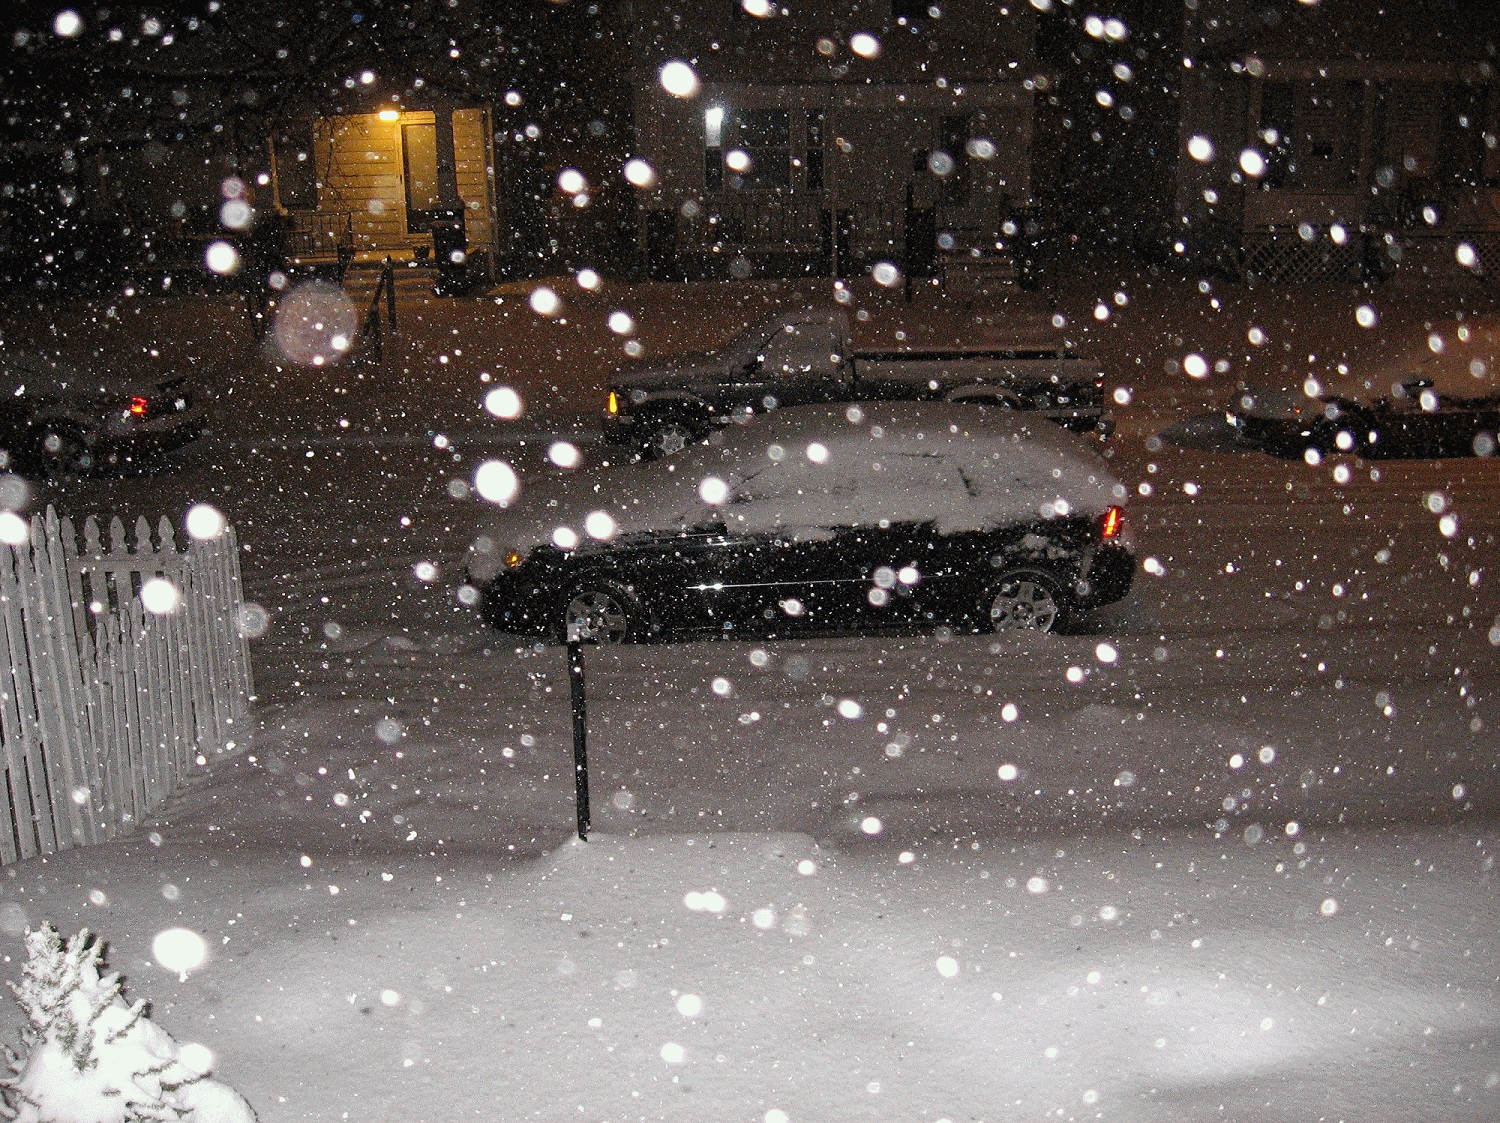
Snow in Hilltop, Columbus.
Here are some videos during the storm.
Cincinnati
Cleveland
Columbus
Historic winter storms from other months and years, along with many more records, can be found under Weather History
And to look up current weather and local forecasts go here: Wilmington National Weather Service