2016 Population Estimates for Counties and Metros


The 2016 population estimates came out this morning from the Census. Nationally, it seems that overall growth rates slowed down from where they were the year prior, and there were some surprising results in a few cases.

First, let’s take a look at the core counties for Columbus and its peer/Midwest counterparts nationally. The core city is in parenthesis.
2010—————————————————2015———————————2016

1. Cook (Chicago): 5,194,675————-1. Cook: 5,224,823————-1. Cook: 5,203,499
2. Clark (Las Vegas): 1,951,269———-2. Clark: 2,109,289————-2. Clark: 2,155,664
3. Wayne (Detroit): 1,820,584————-3. Santa Clara: 1,910,105—-3. Bexar: 1,928,680
4. Santa Clara (San Jose): 1,781,642—4. Bexar: 1,895,482—4. Santa Clara: 1,919,402
5. Bexar (San Antonio): 1,714,773——-5. Wayne: 1,757,062———5. Wayne: 1,749,366
6. Sacramento (Sac.): 1,418,788–6. Sacramento: 1,496,664–6. Sacramento: 1,414,460
7. Cuyahoga (Cleveland): 1,280,122—7. Orange: 1,284,864——–7. Orange: 1,314,367
8. Allegheny (Pittsburgh): 1,223,348—8. Cuyahoga: 1,255,025—-8. Franklin: 1,264,518
9. Franklin (Columbus): 1,163,414—–9. Franklin: 1,250,269—–9. Cuyahoga: 1,249,352
10. Hennepin (Minn.): 1,152,425—10. Allegheny: 1,229,298—-10. Hennepin: 1,232,483
11. Orange (Orlando): 1,145,951—11. Hennepin: 1,220,459—-11. Allegheny: 1,225,365
12. Travis (Austin): 1,024,266——12. Travis: 1,174,818——12. Travis: 1,199,323
13. Milwaukee (Mil): 947,735–13. Mecklenburg: 1,033,466–13. Mecklenburg: 1,054,835
14. Mecklenburg (Charl.): 919,628–14. Milwaukee: 956,314—14. Milwaukee: 951,448
15. Marion (Indianapolis): 903,393—15. Marion: 938,058———–15. Marion: 941,229
16. Hamilton (Cincinnati): 802,374—16. Hamilton: 807,748——–16. Hamilton: 809,099
17. Multnomah (Portland): 735,334–17. Multnomah: 789,125—17. Multnomah: 799,766
18. Jackson (Kansas City): 674,158–18. Jackson: 686,373——-18. Jackson: 691,801
19. Davidson (Nashville): 626,667—19. Davidson: 678,323——-19. Davidson: 684,410
20. Providence (Providence): 626,671–20. Kent: 636,095———20. Kent: 642,173
21. Kent (Grand Rapids): 602,622–21. Providence: 632,488—-21. Providence: 633,673
22. Summit (Akron): 541,781———22. Douglas: 549,168——–22. Douglas: 554,995
23. Montgomery (Dayton): 535,153–23. Summit: 541,316——–23. Summit: 540,300
24. Douglas (Omaha): 517,110–24. Montgomery: 531,567——24. Dane: 531,273
25. Sedgwick (Wichita): 498,365–25. Dane: 522,878———–25. Montgomery: 531,239
26. Dane (Madison): 488,073——-26. Sedgwick: 510,360——26. Sedgwick: 511,995
27. Lucas (Toledo): 441,815——–27. Polk: 466,688————–27. Polk: 474,045
28. Virginia Beach (VB): 437,994–28. Virginia Beach: 451,854–28. Vir. Beach: 452,602
29. Polk (Des Moines): 430,640—-29. Lucas: 433,496————-29. Lucas: 432,488
30. Allen (Fort Wayne): 355,359—30. Allen: 368,040————-30. Allen: 370,404
31. St. Louis (St. Louis): 319,294–31. St. Louis: 314,875———31. St. Louis: 311,404
32. Lancaster (Lincoln): 285,407—32. Lancaster: 305,705——-32. Lancaster: 309,637
33. Mahoning (Youngstown): 238,823–33. Mahoning: 231,767–33. Mahoning: 230,008

Franklin County moved up one spot to 8th most populated core county of the group.

Total Core County Growth of the 33 Cities Census July 1, 2015 to July 1, 2016
1. Clark-Las Vegas: +46,375
2. Bexar-San Antonio: +33,198
3. Orange-Orlando: +29,503
4. Travis-Austin: +24,505
5. Mecklenburg-Charlotte: +21,369
6. Sacramento-Sacramento: +17,816
7. Franklin-Columbus: +14,249
8. Hennepin-Minneapolis: +12,024
9. Multnomah-Portland: +10,641
10. Santa Clara-San Jose: +9,297
11. Dane-Madison: +8,395
12. Polk-Des Moines: +7,357
13. Davidson-Nashville: +6,087
14. Kent-Grand Rapids: +6,078
15. Douglas-Omaha: +5,827
16. Jackson-Kansas City: +5,428
17. Lancaster-Lincoln: +3,932
18. Marion-Indianapolis: +3,171
19. Allen-Fort Wayne: +2,364
20. Sedgwick-Wichita: +1,635
21. Hamilton-Cincinnati: +1,351
22. Providence-Providence: +1,185
23. Virginia Beach-Virginia Beach: +748
24. Montgomery-Dayton: -328
25. Lucas-Toledo: -1,008
26. Summit-Akron: -1,016
27. Mahoning-Youngstown: -1,759
28. St. Louis-St. Louis: -3,471
29. Allegheny-Pittsburgh: -3,933
30. Milwaukee-Milwaukee: -4,866
31. Cuyahoga-Cleveland: -5,673
32. Wayne-Detroit: -7,696
33. Cook-Chicago: -21,324

And Total Core County Population Change Census 2010 to July 1, 2016 for the 33
1. Bexar: +213,907
2. Clark: +204,395
3. Travis: +175,057
4. Orange: +168,416
5. Santa Clara: +137,760
6. Mecklenburg: +135,207
7. Franklin: +101,104
8. Sacramento: +95,672
9. Hennepin: +80,058
10. Multnomah: +64,432
11. Davidson: +57,729
12. Polk: +43,405
13. Dane: +43,200
14. Kent: +39,551
15. Douglas: +37,885
16. Marion: +37,836
17. Lancaster: +24,230
18. Jackson: +17,643
19. Allen: +15,075
20. Virginia Beach: +14,608
21. Sedgwick: +13,630
22. Cook: +8,824
23. Providence: +7,006
24. Hamilton: +6,725
25. Milwaukee: +3,713
26. Allegheny: +2,017
27. Summit: -1,481
28. Montgomery: 3,914
29. St. Louis: -7,890
30. Mahoning: -8,815
31. Lucas: -9,327
32. Cuyahoga: -30,770
33. Wayne: -71,218

Here are the metro populations for the above 33 cities.
2010—————————————————————————–2016

1. Chicago: 9,461,105———————————————–1. Chicago: 9,512,999
2. Detroit: 4,296,250————————————————-2. Detroit: 4,297,617
3. Minneapolis: 3,348,859——————————————3. Minneapolis: 3,551,036
4. St. Louis: 2,787,701———————————————-4. St. Louis: 2,807,002
5. Pittsburgh: 2,356,285——————————————–5. Charlotte: 2,474,314
6. Portland: 2,226,009———————————————–6. Orlando: 2,441,257
7. Charlotte: 2,217,012———————————————-7. San Antonio: 2,429,609
8. Sacramento: 2,149,127——————————————8. Portland: 2,424,955
9. San Antonio: 2,142,508——————————————9. Pittsburgh: 2,342,299
10. Orlando: 2,134,411———————————————-10. Sacramento: 2,296,418
11. Cincinnati: 2,114,580——————————————–11. Cincinnati: 2,165,139
12. Cleveland: 2,077,240——————————————–12. Las Vegas: 2,155,664
13. Kansas City: 2,009,342——————————————13. Kansas City: 2,104,509
14. Las Vegas: 1,951,269——————————————-14. Austin: 2,056,405
15. Columbus: 1,901,974——————————————–15. Cleveland: 2,055,612
16. Indianapolis: 1,887,877——————————————16. Columbus: 2,041,520
17. San Jose: 1,836,911———————————————-17. Indianapolis: 2,004,230
18. Austin: 1,716,289————————————————–18. San Jose: 1,978,816
19. Virginia Beach: 1,676,822—————————————19. Nashville: 1,865,298
20. Nashville: 1,670,890———————————————20. Virginia Beach: 1,726,907
21. Providence: 1,600,852——————————————21. Providence: 1,614,750
22. Milwaukee: 1,555,908——————————————-22. Milwaukee: 1,572,482
23. Grand Rapids: 988,938—————————————–23. Grand Rapids: 1,047,099
24. Omaha: 865,350————————————————-24. Omaha: 924,129
25. Dayton: 799,232————————————————-25. Dayton: 800,683
26. Akron: 703,200—————————————————26. Akron: 702,221
27. Wichita: 630,919————————————————-27. Madison: 648,929
28. Toledo: 610,001————————————————–28. Wichita: 644,672
29. Madison: 605,435————————————————29. Des Moines: 634,725
30. Des Moines: 569,633——————————————-30. Toledo: 605,221
31. Youngstown: 565,773——————————————31. Youngstown: 544,746
32. Fort Wayne: 416,257——————————————-32. Fort Wayne: 431,802
33. Lincoln: 302,157————————————————-33. Lincoln: 326,921

The Columbus metro fell one spot in this list, but should recover it next year.

Total Metro Area Population Change July 1,2015 to July 1, 2016 for the 33
1. Orlando: +59,125
2. Austin: +58,301
3. Charlotte: +49,671
4. San Antonio: +47,906
5. Las Vegas: +46,375
6. Portland: +40,148
7. Nashville: +36,337
8. Minneapolis: +32,784
9. Sacramento: +28,830
10. Columbus: +21,376
11. Kansas City: +20,045
12. Indianapolis: +17,688
13. Des Moines: +12,145
14. San Jose: +10,238
15. Omaha: +9,861
16. Cincinnati: +9,747
17. Grand Rapids: +8,762
18. Madison: +8,315
19. Lincoln: +4,094
20. Virginia Beach: +3,439
21. Fort Wayne: +2,430
22. Providence: +2,176
23. Wichita: +1,656
24. Dayton: +883
25. Detroit: +79
26. Toledo: -358
27. Akron: -1,137
28. St. Louis: -1,328
29. Milwaukee: -1,867
32. Cleveland: -4,317
31. Youngstown: -4,644
32. Pittsburgh: -8,972
33. Chicago: -19,570

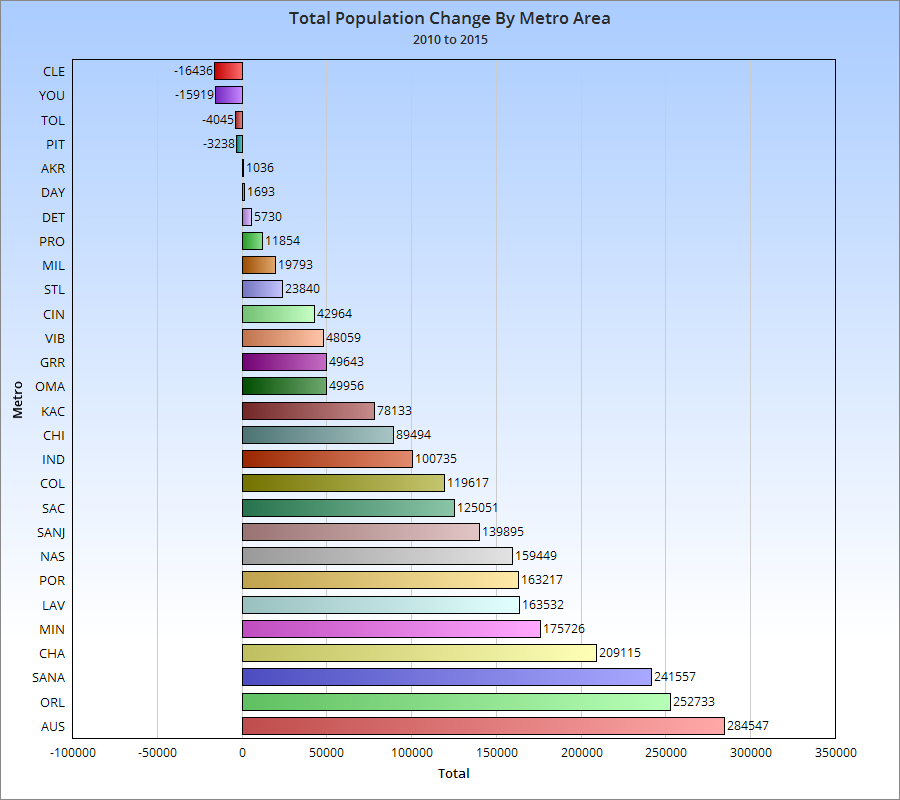
And the Total Metro Area Population Change Census 2010 to July 1, 2016
1. Austin: +340,085
2. Orlando: +306,858
3. San Antonio: +287,093
4. Charlotte: +257,340
5. Las Vegas: +204,395
6. Minneapolis: +202,177
7. Portland: +198,943
8. Nashville: +194,415
9. Sacramento: +147,274
10. San Jose: +141,875
11. Columbus: +139,517
12. Indianapolis: +116,148
13. Kansas City: +95,171
14. Des Moines: +65,092
15. Omaha: +58,773
16. Grand Rapids: +58,159
17. Chicago: +51,449
18. Cincinnati: +50,388
19. Virginia Beach: +50,090
20. Madison: +43,492
21. Lincoln: +24,764
22. St. Louis: +19,243
23. Milwaukee: +16,528
24. Fort Wayne: +15,548
25. Wichita: +13,753
26. Providence: +13,550
27. Dayton: +1,464
28. Detroit: +1,304
29. Akron: -982
30. Toledo: -4,780
31. Pittsburgh: -13,992
32. Youngstown: -21,053
33. Cleveland: -21,646

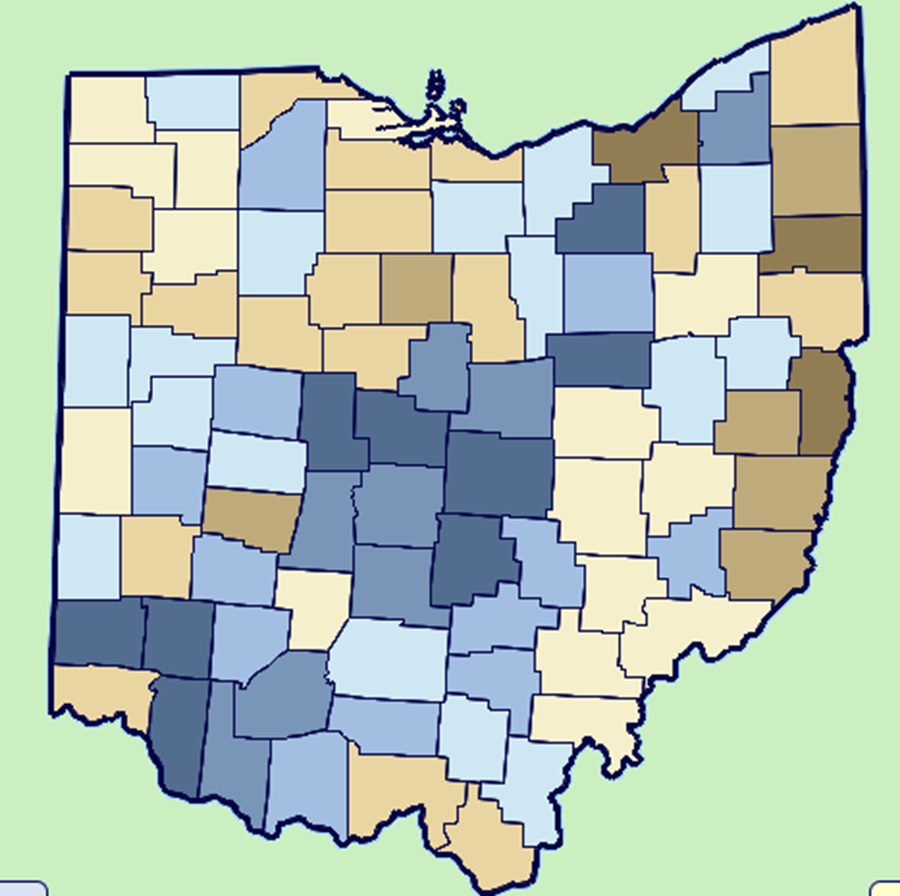
Now let’s take a closer look at Ohio only.
2016 population estimates

Top 20 Most-Populated Ohio Counties
2010————————————————-2016

1. Cuyahoga: 1,280,122—————-1. Franklin: 1,264,518
2. Franklin: 1,163,414——————-2. Cuyahoga: 1,249,352
3. Hamilton: 802,374——————–3. Hamilton: 809,099
4. Summit: 541,781———————-4. Summit: 540,300
5. Montgomery: 535,153—————5. Montgomery: 531,239
6. Lucas: 441,815————————6. Lucas: 432,488
7. Stark: 375,586————————-7. Butler: 377,537
8. Butler: 368,130————————8. Stark: 373,612
9. Lorain: 301,356———————–9. Lorain: 306,365
10. Mahoning: 238,823—————-10. Mahoning: 230,008
11. Lake: 230,041———————–11. Lake: 228,614
12. Warren: 212,693——————–12. Warren: 227,063
13. Trumbull: 210,312——————13. Clermont: 203,022
14. Clermont: 197,363——————14. Trumbull: 201,825
15. Delaware: 174,214—————–15. Delaware: 196,463
16. Medina: 172,332——————–16. Medina: 177,221
17. Licking: 166,492———————17. Licking: 172,198
18. Greene: 161,573———————18. Greene: 164,765
19. Portage: 161,419——————–19. Portage: 161,921
20. Fairfield: 146,156——————–20. Fairfield: 152,597

Top 10 Fastest-Growing Counties July 1, 2015 to July 1, 2016
1. Franklin: +14,249
2. Delaware: +3,579
3. Warren: +2,624
4. Butler: +2,078
5. Licking: +1,439
6. Hamilton: +1,351
7. Fairfield: +1,271
8. Clermont: +1,231
9. Lorain: +1,152
10. Union: +1,142

Top 10 Fastest-Declining Counties July 1, 2015 to July 1, 2016
1. Cuyahoga: -5,673
2. Trumbull: -1,806
3. Mahoning: -1,759
4. Stark: -1,253
5. Clark: -1,029
6. Summit: -1,016
7. Lucas: -1,008
8. Columbiana: -998
9. Madison: -684
10. Scioto: -664

Top 10 Fastest-Growing Counties Census 2010 to July 1, 2016
1. Franklin: +100,989
2. Delaware: +22,274
3. Warren: +14,195
4. Butler: +9,402
5. Hamilton: +6,731
6. Fairfield: +6,420
7. Licking: +5,706
8. Clermont: +5,659
9. Lorain: +5,009
10. Medina: +4,888

Top 10 Fastest-Declining Counties Census 2010 to July 1, 2016
1. Cuyahoga: -30,757
2. Lucas: -9,327
3. Mahoning: -8,799
4. Trumbull: -8,493
5. Columbiana: -4,156
6. Montgomery: -3,897
7. Clark: -3,547
8. Scioto: -3,411
9. Richland: -3,368
10. Ashtabula: -3,257


Peer and Columbus Metro GDP Comparison


Metro GDP comparison

This metro GDP comparison is based on information from the Bureau of Economic Analysis.

Rank of Major Midwest Metros and Columbus National Peers by GDP, 2001, 2010 and 2015
In Millions
2001——————————————–2010————————————-2015

1. Chicago, IL: $416,444————-1. Chicago: $533,825————–1. Chicago: $640,656
2. Detroit, MI: $190,921———–2. Minneapolis: $199,606——-2. Minneapolis: $248,779
3. Minneapolis, MN: $148,192—–3. Detroit: $197,973—————–3. Detroit: $245,607
4. San Jose, CA: $125,037———4. San Jose: $163,836———–4. San Jose: $235,222
5. St. Louis, MO: $102,385———5. Portland: $141,233————5. Portland: $158,770
6. Pittsburgh, PA: $88,769———-6. St. Louis: $133,888———6. St. Louis: $155,077
7. Cleveland: $87,796————-7. Pittsburgh: $117,895———-7. Charlotte: $152,447
8. Portland, OR: $80,753———8. Charlotte: $114,500————8. Pittsburgh: $138,873
9. Cincinnati: $79,638————-9. Indianapolis: $111,084——-9. Indianapolis: $134,081
10. Kansas City, MO: $79,544—-10. Cleveland: $109,365—–10. Cleveland: $128,448
11. Charlotte, NC $78,675———11. Kansas City: $107,265—11. Cincinnati: $127,057
12. Indianapolis, IN: $78,009——-12. Cincinnati: $104,314—-12. Kansas City: $125,618
13. Columbus: $74,172————-13. Orlando: $101,307——–13. Columbus: $124,381
14. Sacramento, CA: $66,696—–14. Columbus: $96,475——14. Orlando: $121,329
15. Orlando, FL: $66,644———–15. Sacramento: $96,015—-15. Austin: $119,949
16. Milwaukee, WI: $65,033——–16. Austin: $87,473———-16. Sacramento: $118,822
17. Nashville, TN: $58,245———17. Milwaukee: $86,569—–17. Nashville: $113,680
18. Las Vegas, NV: $57,035——-18. Las Vegas: $85,020—–18. San Antonio: $108,879
19. Virginia Beach, VA: $54,040—-19. Nashville: $84,804—19. Las Vegas: $103,343
20. Austin, TX: $53,915——20. Virginia Beach: $82,685—–20. Milwaukee: $102,209
21. San Antonio, TX: $53,248—21. San Antonio: $81,722—21. Virginia Beach: $95,680
22. Providence, RI: $49,997——-22. Providence: $67,754—-22. Providence: $78,694
23. Grand Rapids, MI: $35,248—-23. Omaha: $47,711——-23. Omaha: $59,090
24. Omaha, NE: $32,044——–24. Grand Rapids: $41,221–24. Grand Rapids: $53,949
25. Dayton: $29,658————–25. Dayton: $34,226————25. Dayton: $39,206
26. Toledo: $22,216————–26. Akron: $28,628————–26. Akron: $34,419
27. Akron: $21,684—————27. Toledo: $27,158————-27. Toledo: $34,019
28. Youngstown: $15,314——28. Youngstown: $17,293——28. Youngstown: $21,417

Rank by Total Change in Millions 2001-2015
1. Chicago: +$224,212
2. San Jose: +$110,185
3. Minneapolis: +$100,587
4. Portland: +$78,017
5. Charlotte: +$73,772
6. Austin: +$66,034
7. Indianapolis: +$56,072
8. San Antonio: +$55,631
9. Nashville: +$55,435
10. Detroit: +$54,686
11. Orlando: +$54,685
12. St. Louis: +$52,692
13. Sacramento: +$52,126
14. Columbus: +$50,209
15. Pittsburgh: +$50,104
16. Cincinnati: +$47,419
17. Las Vegas: +$46,308
18. Kansas City: +$46,074
19. Virginia Beach: +$41,640
20. Cleveland: +$40,652
21. Milwaukee: +$37,176
22. Providence: +$28,697
23. Omaha: +$27,046
24. Grand Rapids: +$18,701
25. Akron: +$12,735
26. Toledo: +$11,803
27. Dayton: +$9,548
28. Youngstown: +$6,103

Rank by Total Change in Millions 2010-2015
1. Chicago: +$106,831
2. San Jose: +$71,386
3. Minneapolis: +$49,173
4. Detroit: +$47,634
5. Charlotte: +$37,947
6. Austin: +$32,476
7. Nashville: $28,876
8. Columbus: +$27,906
9. San Antonio: +$27,157
10. Indianapolis +$22,997
11. Sacramento: +$22,807
12. Cincinnati: +$22,743
13. St. Louis: +$21,189
14. Pittsburgh: +$20,978
15. Orlando: +$20,022
16. Cleveland: +$19,083
17. Kansas City: +$18,353
18. Las Vegas: +$18,323
19. Portland: +$17,537
20. Milwaukee: +$15,640
21. Virginia Beach: +$12,995
22. Grand Rapids: +$12,728
23. Omaha: +$11,379
24. Providence: +$10,940
25. Toledo: +$6,861
26. Akron: +$5,791
27. Dayton: +$4,980
28. Youngstown: +$4,124

Total Rank by % Change 2001-2015
1. Austin: +122.48%
2. San Antonio: +104.48%
3. Portland: +96.61%
4. Nashville: +95.18%
5. Charlotte: +93.77%
6. San Jose: +88.12%
7. Omaha: +84.40%
8. Orlando: +82.06%
9. Las Vegas: +81.19%
10. Sacramento: +78.15%
11. Virginia Beach: +77.05%
12. Indianapolis: +71.88%
13. Minneapolis: +67.88%
14. Columbus: +67.69%
15. Cincinnati: +59.54%
16. Akron: +58.73%
17. Kansas City: +57.92%
18. Providence: +57.40%
19. Milwaukee: +57.16%
20. Pittsburgh: +56.44%
21. Chicago: +53.84%
22. Toledo: +53.13%
23. Grand Rapids: +53.06%
24. St. Louis: +51.46%
25. Cleveland: +46.30%
26. Youngstown: +39.85%
27. Dayton: +32.19%
28. Detroit: +28.64%

Total Rank by % Change 2010-2015
1. San Jose: +43.57%
2. Austin: +37.13%
3. Nashville: +34.05%
4. San Antonio: +33.23%
5. Charlotte: +33.14%
6. Grand Rapids: +30.88%
7. Columbus: +28.93%
8. Toledo: +25.26%
9. Minneapolis: +24.64%
10. Detroit: +24.06%
11. Omaha: +23.85%
12. Youngstown: +23.85%
13. Sacramento: +23.75%
14. Cincinnati: +21.80%
15. Las Vegas: +21.55%
16. Indianapolis: +20.70%
17. Akron: +20.23%
18. Chicago: +20.01%
19. Orlando: +19.76%
20. Milwaukee: +18.07%
21. Pittsburgh: +17.79%
22. Cleveland: +17.45%
23. Kansas City: +17.11%
24. Providence: +16.15%
25. St. Louis: +15.83%
26. Virginia Beach: +15.72%
27. Dayton: +14.55%
28. Portland: +12.42%

Finally, let’s take a look at per-capita GDP and income.

Rank of Metros by Per-Capita GDP in Dollars, 2015
1. San Jose: $112,851
2. Minneapolis: $63,474
3. Portland: $62,229
4. Chicago: $59,688
5. Indianapolis: $59,479
6. Milwaukee: $58,219
7. Omaha: $57,334
8. Cleveland: $56,013
9. Nashville: $55,841
10. Charlotte: $55,610
11. Pittsburgh: $55,335
12. Austin: $55,323
13. Columbus: $55,005
14. Kansas City: $54,097
15. Cincinnati: $52,649
16. Detroit: $51,428
17. Virginia Beach: $49,606
18. Toledo: $49,428
19. St. Louis: $49,258
20. Sacramento: $46,697
21. Grand Rapids: $46,677
22. Orlando: $45,756
23. Akron: $44,246
24. Dayton: $43,748
25. Providence: $43,744
26. Las Vegas: $43,476
27. San Antonio: $42,169
28. Youngstown: $34,960

Total Growth 2001-2015 by Rank, in Dollars
1. San Jose: +$40,677
2. Portland: +$18,225
3. Pittsburgh: +$10,064
4. Austin: +$9,925
5. Toledo: +$7,414
6. Virginia Beach: +$7,256
7. Nashville: +$7,071
8. Cleveland: +$6,767
9. Milwaukee: +$6,744
10. Omaha: +$6,581
11. Akron: +$6,167
12. Minneapolis: +$5,900
13. Providence: +$5,560
14. Chicago: +4,663
15. San Antonio: +$4,652
16. Cincinnati: +$4,426
17. Youngstown: +$4,391
18. Sacramento: +$3,210
19. Columbus: +$3,182
20. Indianapolis: +$2,984
21. Grand Rapids: +$2,971
22. Charlotte: +$2,880
23. Kansas City: +$2,770
24. St. Louis: +$2,699
25. Detroit: +$2,011
26. Dayton: +$162
27. Orlando: -$1,630
28. Las Vegas: -$5,041

Total Per-Capita GDP Growth 2010-2015, in Dollars
1. San Jose: +$23,814
2. Toledo: +$6,242
3. Pittsburgh: +$6,172
4. Nashville: +$5,643
5. Detroit: +$5,459
6. Austin: +$5,307
7. Grand Rapids: +$5,158
8. Youngstown: +$4,987
9. San Antonio: +$4,878
10. Columbus: +$4,864
11. Minneapolis: +$4,644
12. Charlotte: +$4,578
13. Chicago: +$4,004
14. Cleveland: +$3,992
15. Cincinnati: +$3,986
16. Akron: +$3,774
17. Milwaukee: +$2,913
18. Omaha: +$2,863
19. Sacramento: +$2,680
20. Providence: +$1,902
21. St. Louis: +$1,884
22. Dayton: +$1,439
23. Kansas City: +$1,270
24. Indianapolis: +$1,186
25. Virginia Beach: +$998
26. Las Vegas: +$206
27. Portland: -$992
28. Orlando: -$1,345

What the numbers suggest is that Columbus was performing at a middle-mediocre level in the first half of the 2001-2015 period, and has generally been performing significantly better in the latter half. In Ohio, Columbus is poised to become Ohio’s largest metro economy over the next few years.


2015 City Population Estimates


2015 city population estimates

The latest 2015 city population estimates came out today from the US Census, so let’s take a look at them.

First of all, let’s look at the top 25 cities in Ohio on July 1, 2015, and the population change from July 1, 2014.
1. Columbus: 850,106 +12,175
2. Cleveland: 388,072 -1,788
3. Cincinnati: 298,550 +509
4. Toledo: 279,789 -803
5. Akron: 197,542 -557
6. Dayton: 140,599 -235
7. Parma: 79,937 -119
8. Canton: 71,885 -395
9. Youngstown: 64,628 -438
10. Lorain: 63,647 -104
11. Hamilton: 62,407 -44
12. Springfield: 59,680 -246
13. Kettering: 55,525 -117
14. Elyria: 53,775 -179
15. Lakewood: 50,656 -297
16. Cuyahoga Falls: 49,146 -123
17. Middletown: 48,760 -6
18. Newark: 47,986 +140
19. Euclid: 47,676 -242
20. Mentor: 46,901 +35
21. Mansfield: 46,830 -5
22. Beavercreek: 46,227 +217
23. Dublin: 45,098 +794
24. Cleveland Heights: 44,962 -243
25. Strongsville: 44,668 -9

Only a handful of the top 25 saw growth.

Now let’s look at the Columbus metro overall, and the change since July 1, 2014.
1. Columbus: 850,106
2. Newark (Licking): 47,986
3. Dublin: 45,098
4. Lancaster (Fairfield): 39,766
5. Grove City: 39,388
6. Westerville: 38,384
7. Delaware (Delaware): 37,995
8. Reynoldsburg: 37,158
9. Upper Arlington: 34,907
10. Gahanna: 34,590
11. Hilliard: 33,649
12. Marysville (Union): 22,817
13. Pickerington (Fairfield): 19,745
14. Whitehall: 18,694
15. Pataskala (Licking): 15,245
16. Worthington: 14,498
17. Bexley: 13,654
18. Circleville (Pickaway): 13,857
19. Powell (Delaware): 12,927
20. Heath (Licking): 10,489
21. London (Madison): 10,060
22. New Albany: 9,879
23. Canal Winchester: 7,818
24. Grandview Heights: 7,328
25. Logan (Hocking): 7,117
26. Granville (Licking): 5,747
27. Groveport: 5,737
28. Sunbury (Delaware): 5,097
29. Johnstown (Licking): 4,918
30. Obetz: 4,761
31. New Lexington (Perry): 4,727
32. Plain City (Madison): 4,302
33. West Jefferson (Madison): 4,279
34. Ashville (Pickaway): 4,190
35. Mount Gilead (Morrow): 3,653
36. Baltimore (Fairfield): 2,970
37. Buckeye Lake (Licking): 2,760
38. Crooksville (Perry): 2,498
39. Hebron (Licking): 2,409
40. Richwood (Union): 2,281
41. Utica (Licking): 2,196
42. Cardington (Morrow): 2,047
43. South Bloomfield (Pickaway): 1,851
44. Mount Sterling (Madison): 1,745
45. Commercial Point (Pickaway): 1,611
46. Somerset (Perry): 1,464
47. Bremen (Fairfield): 1,437
48. Ashley (Delaware): 1,361
49. Lithopolis (Fairfield) 1,351
50. Minerva Park: 1,318
51. Hanover (Licking): 1,131
52. Williamsport (Pickaway): 1,051
53. Millersport (Fairfield): 1,049
54. Urbancrest: 1,033
55. Thornville (Perry): 997
56. Pleasantville (Fairfield): 958
57. New Holland (Pickaway): 836
58. Milford Center (Union): 823
59. Junction City (Perry): 810
60. Amanda (Fairfield): 747
61. Shawnee Hills (Delaware): 735
62. New Straitsville (Perry): 715
63. Ostrander (Delaware): 688
64. Galena (Delaware): 684
65. Shawnee (Perry): 646
66. Valleyview: 636
67. Thurston (Fairfield): 610
68. Marble Cliff: 584
69. Corning (Perry): 573
70. Riverlea: 569
71. Stoutsville (Fairfield): 566
72. Kirkersville (Licking): 541
73. Carroll (Fairfield): 520
74. Laurelville (Hocking): 517
75. Alexandria (Licking): 523
76. Murray City (Hocking): 435
77. Edison (Morrow): 435
78. Sugar Grove (Fairfield): 431
79. Hartford (Licking): 402
80. St. Louisville (Licking): 376
81. South Solon (Madison): 361
82. Marengo (Morrow): 346
83. Harrisburg: 334
84. Midway (Madison): 327
85. Rushville (Fairfield): 305
86. Tarlton (Pickaway): 290
87. Orient (Pickaway): 275
88. Magnetic Springs (Union): 276
89. Fulton (Morrow): 261
90. Lockbourne: 247
91. Unionville Center (Union): 239
92. Chesterville (Morrow): 230
93. Darbyville (Pickaway): 229
94. Gratiot (Licking): 224
95. Glenford (Perry): 177
96. Sparta (Morrow): 163
97. Hemlock (Perry): 156
98. West Rushville (Fairfield): 135
99. Brice: 120
100. Rendville (Perry): 36

Finally, let’s take a look at population growth ranking between Census 2010 and July 1, 2015.
1. Columbus: +63,073
2. Hilliard: +5,214
3. Grove City: +3,813
4. Dublin: +3,347
5. Delaware: +3,242
6. Westeville: +2,264
7. New Albany: +2,155
8. Powell: +1,472
9. Pickerington: +1,454
10. Gahanna: +1,342
11. Reynoldsburg: +1,265
12. Upper Arlington: +1,136
13. Lancaster: +986
14. Worthington: +923
15 Grandview Heights: +792
16. Marysville: +723
17. Canal Winchester: +717
18. Sunbury: +708
19. Whitehall: +632
20. Bexley: +597
21. Circleville: +543
22. Newark: +413
23. Groveport: +374
24. Johnstown: +286
25. Pataskala: +283
26. Lithopolis: +245
27. Obetz: +229
28. Hanover: +210
29. Heath: +179
30. London: +156
31. South Bloomfield: +107
32. Granville: +101
33. Ashville: +93
34. Plain City: +77
35. Urbancrest: +73
36. Hebron: +73
37. Utica: +64
38. West Jefferson: +57
39. Shawnee Hills: +54
40. Richwood: +52
41. Minverva Park: +46
42. Galena: +45
43. Ostrander: +45
44. New Holland: +35
45. Milford Center: +31
46. Ashley: +31
47. Commercial Point: +29
48. Williamsport: +28
49. Riverlea: +24
50. Kirkersville: +16
51. Valleyview: +16
52. Buckeye Lake: +14
53. Harrisburg: +14
54. Bremen: +12
55. Marble Cliff: +11
56. Amanda: +10
57. Lockbourne: +10
58. Tarlton: +8
59. Magnetic Springs: +8
60. Darbyville: +7
61. Brice: +7
62. Thurston: +6
63. Alexandria: +6
64. Stoutsville: +6
65. Unionville Center: +6
66. Thornville: +6
67. Millersport: +5
68. Orient: +5
69. Sugar Grove: +5
70. Hartford: +5
71. South Solon: +5
72. Somerset: +5
73. Midway: +5
74. Marengo: +4
75. Baltimore: +4
76. Glenford: +4
77. Fulton: +3
78. Gratiot: +3
79. St. Louisville: +3
80. Rushville: +3
81. Chesterville: +2
82. Sparta: +2
83. West Rushville: +1
84. Hemlock: +1
85. Cardington: 0
86. Rendville: 0
87. Pleasantville: -2
88. Edison: -2
89. Carroll: -4
90. New Lexington: -4
91. Mount Gilead: -7
92. New Straitsville: -7
93. Junction City: -9
94. Shawnee: -9
95. Corning: -10
96. Laurelville: -10
97. Murray City: -14
98. Logan: -35
99. Mount Sterling: -37
100. Crooksville: -37

So 86 of the metro’s 100 places have either grown or held steady in population since 2010. That is an increase from 70 places during the 2000s.


2015 Metro Area Population Estimates and Peer Comparison


As promised, here are the 2015 metro area population estimates for Columbus and its regional and national peers.

2015 Metro Population Estimates
Chicago, IL: 9,551,031
Detroit, MI: 4,302,043
Minneapolis, MN: 3,524,583
St. Louis, MO: 2,811,588
Charlotte, NC: 2,426,363
Portland, OR: 2,389,228
Orlando, FL: 2,387,138
San Antonio, TX: 2,384,075
Pittsburgh, PA: 2,353,045
Sacramento, CA: 2,274,194
Cincinnati: 2,157,719
Las Vegas, NV: 2,114,801
Kansas City, MO: 2,087,471
Cleveland: 2,060,810
Columbus: 2,021,632
Austin, TX: 2,000,860
Indianapolis: 1,988,817
San Jose, CA: 1,976,836
Nashville, TN: 1,830,345
Virginia Beach, VA: 1,724,876
Providence, RI: 1,613,070
Milwaukee, WI: 1,575,747
Grand Rapids, MI: 1,038,583
Omaha, NE: 915,312
Dayton: 800,909
Akron: 704,243
Toledo: 605,956
Youngstown: 549,885
2015 metro area population estimates

Components of Metro Area Population Change


As you can see, while Columbus has a middle of the road birth rate for its peers, its relatively low death rate means that it manages to be near the top of the its peer group in natural growth.


It seems that while international migration is competitive with peers in the Columbus metro, domestic migration would need to improve to truly be at the upper peer level. At the very least, it is positive.

For more local and national population and demographic data, visit:
Demographics and Population
US Census


Young Professionals and the City: A Comparison Part 2


young professionals and the city

The first part of this comparison of young professionals and the city, seen here, seemed to be well-received, so I wanted to expand the examination of the 25-34 age group. In the first post, I just compared growth of this population by Columbus’ peers, but let’s take a closer look at this group through educational attainment. I will use the same 33 cities I used in the first post.

Educational Attainment 2014 Rank by City of Bachelors Degree or Higher within 25-34 Population
1. Chicago: 268,470
2. Austin: 97,721
3. Columbus: 75,305
4. San Jose: 68,392
5. Charlotte: 63,132
6. San Antonio: 62,572
7. Portland: 60,259
8. Minneapolis: 51,043
9. Indianapolis: 48,188
10. Pittsburgh: 35,860
11. Kansas City: 32,101
12. Madison: 30,039
13. Milwaukee: 29,661
14. Omaha: 28,984
15. St. Louis: 28,946
16. Sacramento: 27,304
17. Cincinnati: 25,496
18. St. Paul: 22,929
19. Virginia Beach: 22,134
20. Orlando: 20,181
21. Wichita: 19,659
22. Las Vegas: 17,817
23. Lincoln: 16,429
24. Grand Rapids: 15,724
25. Detroit: 14,285
26. Fort Wayne: 12,228
27. Cleveland: 12,013
28. Des Moines: 10,089
29. Providence: 10,432
30. Toledo: 8,514
31. Akron: 6,600
32. Dayton: 4,029
33. Youngstown: 1,084

Columbus has the 3rd highest total of 25-34-year-olds with at least a bachelor’s degree, even compared to some cities with larger populations in the city or metro area. This is likely due to the high number of colleges and universities in the area, not least of which includes Ohio State.

2014 % of Total 25-34 Age Group with Bachelors or Higher
1. Madison: 67.0%
2. Pittsburgh: 57.4%
3. Minneapolis: 56.3%
4. Portland: 51.5%
5. Chicago: 51.1%
6. Austin: 48.9%
7. Cincinnati: 47.0%
8. St. Louis: 46.9%
9. Charlotte: 44.5%
10. San Jose: 44.5%
11. Columbus: 44.1%
12. St. Paul: 42.1%
13. Lincoln: 41.0%
14. Omaha: 40.8%
15. Grand Rapids: 40.5%
16. Kansas City: 40.5%
17. Orlando: 37.1%
18. Indianapolis: 34.3%
19. Wichita: 33.7%
20. Providence: 32.7%
21. Sacramento: 32.5%
22. Fort Wayne: 32.4%
23. Des Moines: 29.8%
24. Milwaukee: 29.6%
25. Virginia Beach: 29.3%
26. San Antonio: 27.6%
27. Akron: 23.4%
28. Cleveland: 21.4%
29. Las Vegas: 19.7%
30. Toledo: 19.5%
31. Dayton: 19.1%
32. Detroit: 15.9%
33. Youngstown: 12.8%

While just outside of the top 10 in the peer group, Columbus still performs in the top 1/3rd when it comes to the % of 25-34-year-olds that have at least a bachelor’s degree.

2000-2014 Total Change in Age 25-34 with a Bachelor’s Degree or Higher
1. Chicago: +78,514
2. Austin: +38,348
3. Portland: +26,042
4. San Antonio: +23,504
5. Columbus: +21,601
6. Charlotte: +19,149
7. Pittsburgh: +19,060
8. Minneapolis: +15,629
9. St. Louis: +14,538
10. San Jose: +13,372
11. Sacramento: +11,530
12. Kansas City: +10,499
13. Madison: +8,774
14. Orlando: +8,600
15. Omaha: +8,521
16. Indianapolis: +8,369
17. Milwaukee: +7,031
18. Grand Rapids: +6,275
19. Wichita: +6,049
20. Fort Wayne: +5,350
21. Cincinnati: +5,083
22. Las Vegas: +4,433
23. St. Paul: +4,316
24. Virginia Beach: +4,167
25. Lincoln: +3,450
26. Providence: +2,488
27. Des Moines: +806
28. Dayton: +59
29. Youngstown: -108
30. Cleveland: -522
31. Akron: -628
32. Detroit: -1,471
33. Toledo: -1,639

Another great showing is in the total growth of 25-34-year-olds with at least a bachelor’s degree. Again, Columbus is outperforming several larger cities/metros on the list.

2000-2014 Total % Change in Age 25-34 with a Bachelor’s Degree or Higher
1. Pittsburgh: +113.45%
2. St. Louis: +100.90%
3. Fort Wayne: +77.78%
4. Portland: +76.11%
5. Orlando: +74.26%
6. Sacramento: +73.09%
7. Grand Rapids: +66.41%
8. Austin: +64.59%
9. San Antonio: +60.16%
10. Kansas City: +48.60%
11. Wichita: +44.45%
12. Minneapolis: +44.13%
13. Charlotte: +43.54%
14. Omaha: +41.64%
15. Chicago: +41.33%
16. Madison: +41.26%
17. Columbus: +40.22%
18. Las Vegas: +33.12%
19. Providence: +31.32%
20. Milwaukee: +31.07%
21. Lincoln: +26.58%
22. Cincinnati: +24.90%
23. San Jose: +24.30%
24. St. Paul: +23.19%
25. Virginia Beach: +23.19%
26. Indianapolis: +21.02%
27. Des Moines: +8.68%
28. Dayton: +1.49%
29. Cleveland: -4.16%
30. Akron: -8.69%
31. Youngstown: -9.06%
32. Detroit: -9.34%
33. Toledo: -16.14%

So in Part 1, it was shown that Columbus had one of the fastest growing 25-34 populations. These numbers show that it also has one of the largest age 25-34 populations with a Bachelor’s degree or higher in terms of totals, and one of the fastest growing in terms of totals. By %, however, it performs a bit worse, but part of the reason for that is because so many of these cities started with relatively low educated populations to begin with. Overall, Columbus seems to be very attractive, not only to this age group, but also for those within the group that are highly educated.