Columbus’s foreign-born population origins are much more varied, and the overall population larger, than what one might expect. As of 2017, they made up 12% of the city’s population, the highest in more than 100 years. I’ve looked at such numbers before, but I wanted to update for the most recent available numbers.
In the 2nd post related to the recently-released Census demographic data, I’ll look at Columbus city diversity and peer comparison for how it’s been changing since 2005.
Rank by City of Total White, non-Hispanic Population by Year 2005————————————–2010————————————-2017 1. Chicago, IL: 819,215————1. Chicago: 853,910————1. Chicago: 879,334 2. Indianapolis, IN: 491,044—2. Indianapolis: 482,195—–2. Columbus: 490,149 3. Columbus: 442,958———-3. Columbus: 470,971—-3. Indianapolis: 468,665 4. Portland, OR: 382,033———-4. Portland: 417,876————4. Austin: 453,801 5. San Antonio, TX: 356,420—–5. Austin: 384,065————5. Portland: 452,132 6. Austin, TX: 347,013——-6. San Antonio: 351,420—6. San Antonio: 375,463 7. Nashville, TN: 314,518——–7. Nashville: 339,030——–7. Nashville: 368,195 8. Charlotte, NC: 302,789——-8. Charlotte: 331,357——8. Charlotte: 360,270 9. Virginia Beach, VA: 290,891–9. Virginia Beach: 282,812——9. Omaha: 311,349 10. San Jose, CA: 281,822—–10. Las Vegas: 280,604———–10. Las Vegas: 280,201 11. Las Vegas, NV: 281,679—-11. Omaha: 277,606———–11. Virginia Beach: 277,338 12. Omaha, NE: 267,685——–12. San Jose: 265,311————12. Kansas City: 272,548 13. Kansas City, MO: 249,123—13. Kansas City: 247,473——13. San Jose: 267,315 14. Wichita, KS: 245,527———-14. Wichita: 245,146————14. Minneapolis: 252,304 15. Milwaukee, WI: 219,891——15. Minneapolis: 242,848——15. Wichita: 243,143 16. Minneapolis, MN: 216,975—16. Milwaukee: 221,514——–16. Lincoln: 226,297 17. Lincoln, NE: 197,287———-17. Lincoln: 216,076————-17. Milwaukee: 207,043 18. Toledo: 183,746—————-18. Pittsburgh: 203,622———18. Pittsburgh: 196,687 19. Pittsburgh, PA: 180,725——19. Fort Wayne: 179,646——-19. Madison: 187,566 20. Madison, WI: 161,631——–20. Madison: 178,307————20. Fort Wayne: 166,912 21. St. Paul, MN: 161,329——–21. Toledo: 177,341————–21. Toledo: 164,104 22. Sacramento, CA: 160,599—22. Sacramento: 165,610——22. Sacramento: 159,291 23. Fort Wayne, IN: 157,672—–23. St. Paul: 159,704———–23. St. Paul: 152,558 24. Des Moines, IA: 149,786—–24. Des Moines: 145,937——24. Cincinnati: 143,028 25. Cleveland: 147,359———–25. Cincinnati: 143,120———25. Des Moines: 137,235 26. St. Louis, MO: 143,590——26. Cleveland: 137,977———26. St. Louis: 134,471 27. Cincinnati: 138,486———–27. St. Louis: 134,146———–27. Cleveland: 126,714 28. Akron: 128,976—————-28. Akron: 120,800————–28. Grand Rapids: 114,349 29. Grand Rapids, MI: 113,791—29. Grand Rapids: 104,636—29. Akron: 113,951 30. Orlando, FL: 92,326———–30. Orlando: 96,867————-30. Orlando: 95,876 31. Detroit, MI: 77,163————-31. Dayton: 72,663————–31. Dayton: 71,094 32. Dayton: 67,581—————–32. Providence: 64,284——–32. Detroit: 70,931 33. Providence, RI: 64,223——-33. Detroit: 55,298————–33. Providence: 59,321
Columbus moved from 3rd to 2nd over the period.
Rank by City of Total Black, non-Hispanic Population by Year 2005—————————————–2010———————————2017 1. Chicago: 938,097—————–1. Chicago: 895,294———–1. Chicago: 797,253 2. Detroit: 683,999——————–2. Detroit: 587,707————-2. Detroit: 529,593 3. Milwaukee: 222,040————–3. Charlotte: 251,274———-3. Charlotte: 292,104 4. Cleveland: 221,797—————4. Milwaukee: 230,473——–4. Columbus: 248,476 5. Charlotte: 205,216—————-5. Indianapolis: 226,314——-5. Indianapolis: 236,606 6. Indianapolis: 193,948————6. Columbus: 216,486———6. Milwaukee: 228,720 7. Columbus: 179,197—————7. Cleveland: 208,528———7. Cleveland: 186,073 8. St. Louis: 168,768—————-8. Nashville: 171,104———–8. Nashville: 180,830 9. Nashville: 148,051—————-9. St. Louis: 157,382———–9. St. Louis: 143,761 10. Kansas City: 131,694———-10. Kansas City: 138,461—–10. Kansas City: 138,346 11. Cincinnati: 131,010————-11. Cincinnati: 131,909——–11. Cincinnati: 127,589 12. Pittsburgh: 81,758————–12. Virginia Beach: 79,583—-12. San Antonio: 97,925 13. Virginia Beach: 80,004——–13. San Antonio: 79,307——13. Virginia Beach: 82,181 14. Orlando: 73,736—————–14. Toledo: 75,033————-14. Minneapolis: 75,006 15. Toledo: 72,190——————-15. Pittsburgh: 71,539——–15. Toledo: 74,906 16. Sacramento: 71,452————16. Orlando: 70,988————16. Orlando: 72,796 17. San Antonio: 70,723————17. Minneapolis: 63,749——17. Austin: 69,860 18. Dayton: 60,196——————-18. Sacramento: 61,976——18. Sacramento: 67,305 19. Akron: 59,810——————–19. Austin: 61,833————–19. Las Vegas: 65,663 20. Las Vegas: 59,780————–20. Dayton: 61,402————-20. Pittsburgh: 65,268 21. Austin: 59,583——————-21. Akron: 60,653—————-21. Akron: 61,461 22. Minneapolis: 57,499————22. Las Vegas: 60,187———22. Dayton: 57,043 23. Omaha: 50,333——————23. Omaha: 55,086————-23. Omaha: 56,098 24. Grand Rapids: 40,408———24. Wichita: 42,662————-24. St. Paul: 51,737 25. Wichita: 39,165—————–25. Grand Rapids: 41,848—–25. Wichita: 40,756 26. Fort Wayne: 35,221———–26. St. Paul: 41,923————-26. Grand Rapids: 38,130 27. St. Paul: 34,903—————-27. Fort Wayne: 39,016——–27. Fort Wayne: 37,941 28. Portland: 30,828—————28. Portland: 37,355————28. Portland: 34,624 29. San Jose: 27,446————–29. San Jose: 29,831———-29. San Jose: 28,126 30. Providence: 18,794———–30. Des Moines: 19,962——-30. Providence: 27,274 31. Des Moines: 16,709———-31. Providence: 19,265——–31. Des Moines: 22,170 32. Madison: 12,660————–32. Madison: 17,560————32. Madison: 14,185 33. Lincoln: 7,082——————33. Lincoln: 9,023—————33. Lincoln: 11,487
Columbus moved up from 7th to 4th in total Black, non-Hispanic during the period. Surprisingly, quite a few cities have actually been losing this demographic since 2010 at least.
Rank by City of Total Asian, non-Hispanic Population by Year 2005————————————-2010——————————————2017 1. San Jose: 269,186————–1. San Jose: 303,227—————–1. San Jose: 366,134 2. Chicago: 127,686—————-2. Chicago: 148,280——————2. Chicago: 179,176 3. Sacramento: 80,307————3. Sacramento: 84,556————-3. Sacramento: 93,476 4. Portland: 36,278—————–4. Austin: 46,575———————-4. Austin: 71,539 5. Austin: 35,239——————–5. Portland: 43,185——————-5. St. Paul: 61,082 6. St. Paul: 35,184——————6. St. Paul: 41,989——————-6. Charlotte: 55,142 7. Columbus: 27,125—————7. Las Vegas: 37,406—————7. Columbus: 53,027 8. Las Vegas: 25,077————–8. Charlotte: 37,181—————–8. Portland: 52,219 9. Charlotte: 23,356—————-9. Columbus: 35,468—————-9. Las Vegas: 44,735 10. Virginia Beach: 22,501——10. San Antonio: 29,200———–10. San Antonio: 38,119 11. San Antonio: 20,492———11. Virginia Beach: 27,303—–11. Virginia Beach: 29,735 12. Minneapolis: 20,189———12. Milwaukee: 22,670————–12. Minneapolis: 26,833 13. Milwaukee: 19,596———–13. Minneapolis: 21,426————13. Indianapolis: 26,548 14. Nashville: 16,943————-14. Wichita: 19,420——————14. Milwaukee: 25,624 15. Wichita: 15,417—————15. Indianapolis: 17,137————15. Madison: 24,455 16. Madison: 12,708————–16. Nashville: 17,045—————16. Nashville: 24,034 17. Indianapolis: 12,312———17. Madison: 16,671—————-17. Wichita: 19,548 18. Providence: 10,751———-18. Pittsburgh: 12,036————–18. Pittsburgh: 19,357 19. Pittsburgh: 10,727————19. Providence: 11,497————19. Omaha: 17,412 20. Kansas City: 10,674———20. Lincoln: 10,452——————20. Des Moines: 17,143 21. Detroit: 9,577——————21. Kansas City: 10,263———–21. Kansas City: 15,213 22. Des Moines: 8,796———–22. Des Moines: 8,867————-22. Fort Wayne: 14,039 23. Lincoln: 7,513—————–23. St. Louis: 8,717—————–23. Lincoln: 13,992 24. St. Louis: 7,046—————24. Omaha: 8,397——————-24. Orlando: 11,852 25. Omaha: 6,971—————–25. Orlando: 7,870——————25. Detroit: 11,790 26. Cincinnati: 6,874————-26. Fort Wayne: 6,945————–26. St. Louis: 10,404 27. Cleveland: 6,289————27. Detroit: 6,549———————27. Providence: 9,361 28. Orlando: 5,528—————28. Cincinnati: 5,938—————-28. Cleveland: 9,217 29. Fort Wayne: 4,241———-29. Cleveland: 5,392—————-29. Akron: 8,007 30. Toledo: 4,150—————-30. Akron: 4,567———————30. Cincinnati: 7,906 31. Akron: 3,497—————–31. Grand Rapids: 3,695———–31. Grand Rapids: 7,056 32. Grand Rapids: 2,847——32. Toledo: 3,125——————–32. Toledo: 3,679 33. Dayton: 1,827—————33. Dayton: 1,231——————–33. Dayton: 848
Columbus maintained its rank since 2005.
Rank by City of Total Hispanic Population by Year 2005——————————————–2010————————————2017 1. Chicago: 778,234—————1. San Antonio: 853,654———-1. San Antonio: 969,065 2. San Antonio: 735,458———–2. Chicago: 763,968—————2. Chicago: 787,978 3. San Jose: 279,420————–3. San Jose: 318,389————–3. San Jose: 332,603 4. Austin: 223,361——————4. Austin: 288,130——————4. Austin: 324,973 5. Las Vegas: 153,813————5. Las Vegas: 181,923————-5. Las Vegas: 219,220 6. Sacramento: 111,559———6. Sacramento: 124,461———–6. Sacramento: 141,752 7. Milwaukee: 80,945————-7. Milwaukee: 104,619————-7. Milwaukee: 133,812 8. Providence: 60,008————-8. Charlotte: 96,246—————-8. Charlotte: 122,904 9. Charlotte: 58,466—————9. Indianapolis: 78,467————-9. Indianapolis: 93,042 10. Wichita: 49,928—————10. Providence: 76,645————10. Orlando: 86,305 11. Indianapolis: 47,764———11. Nashville: 61,212—————11. Providence: 77,893 12. Detroit: 46,993—————-12. Wichita: 59,823——————12. Nashville: 69,574 13. Orlando: 43,978————–13. Portland: 58,986—————–13. Wichita: 68,389 14. Portland: 43,324————–14. Orlando: 56,061—————–14. Portland: 67,551 15. Omaha: 39,674—————15. Omaha: 53,661——————15. Omaha: 66,056 16. Nashville: 37,463————-16. Kansas City: 49,800————16. Columbus: 55,782 17. Minneapolis: 37,017———17. Detroit: 45,580——————-17. Detroit: 48,328 18. Kansas City: 35,995———18. Columbus: 43,276————–18. Cleveland: 47,962 19. Grand Rapids: 32,368——19. Cleveland: 36,067————–19. Minneapolis: 46,375 20. Cleveland: 32,085———–20. Minneapolis: 34,504———–20. Kansas City: 45,975 21. Columbus: 24,607———–21. Grand Rapids: 30,659——21. Virginia Beach: 36,723 22. St. Paul: 22,402————–22. Virginia Beach: 29,206—–22. Grand Rapids: 32,016 23. Virginia Beach: 20,803—–23. St. Paul: 28,725————–23. Des Moines: 31,333 24. Des Moines: 18,952——–24. Des Moines: 23,832———-24. St. Paul: 30,007 25. Toledo: 18,404————–25. Toledo: 21,346——————25. Fort Wayne: 24,724 26. Fort Wayne: 16,438——-26. Fort Wayne: 19,576————26. Toledo: 22,796 27. Madison: 11,997———–27. Lincoln: 16,007——————27. Lincoln: 21,921 28. Lincoln: 9,672—————28. Madison: 14,062—————28. Madison: 20,741 29. St. Louis: 8,268————-29. St. Louis: 11,207————–29. St. Louis: 12,447 30. Pittsburgh: 5,018———-30. Cincinnati: 8,710—————30. Cincinnati: 11,787 31. Cincinnati: 3,855———–31. Pittsburgh: 7,282————–31. Pittsburgh: 9,212 32. Akron: 3,485—————-32. Akron: 3,990——————–32. Dayton: 5,765 33. Dayton: 1,693————–33. Dayton: 3,180——————-33. Akron: 5,536
Columbus moved up from 21st to 16th in the total Hispanic population.
Rank by City of Total Other, non-Hispanic Population by Year 2005——————————————-2010—————————————–2017 1. Chicago: 38,694—————1. Chicago: 37,379——————–1. Chicago: 58,721 2. San Jose: 29,456————2. San Jose: 32,439——————–2. Portland: 41,595 3. Sacramento: 21,370———-3. Sacramento: 30,900—————3. San Jose: 41,175 4. Portland: 21,164————–4. Portland: 28,027———————4. Sacramento: 40,066 5. Indianapolis: 20,242———-5. Las Vegas: 24,521—————–5. Columbus: 34,467 6. Columbus: 20,096————-6. Columbus: 23,738—————–6. Indianapolis: 32,525 7. San Antonio: 19,130———-7. San Antonio: 20,778————–7. Las Vegas: 31,889 8. Minneapolis: 18,580———-8. Minneapolis: 20,753————–8. San Antonio: 31,341 9. Detroit: 18,324—————–9. Virginia Beach: 20,268———-9. Austin: 30,541 10. Las Vegas: 18,304———-10. Indianapolis: 20,086———-10. Charlotte: 28,632 11. Virginia Beach: 16,685—-11. Charlotte: 18,360————–11. Virginia Beach: 24,458 12. Milwaukee: 14,476———-12. Detroit: 16,776—————–12. Nashville: 23,334 13. Kansas City: 13,399——–13. Milwaukee: 16,311———–13. Minneapolis: 21,808 14. Austin: 13,261—————-14. Wichita: 16,091—————14. Milwaukee: 20,166 15. Charlotte: 11,771————-15. Omaha: 15,519————–15. Wichita: 18,763 16. Wichita: 11,545—————16. Austin: 14,915—————-16. Kansas City: 16,743 17. Omaha: 8,552—————–17. Kansas City: 14,668——–17. Omaha: 15,988 18. St. Paul: 7,741—————-18. Nashville: 14,227————18. Cleveland: 15,586 19. Toledo: 7,447—————–19. St. Paul: 13,098————–19. Orlando: 13,429 20. Cincinnati: 7,315————-20. Pittsburgh: 11,280———–20. Detroit: 12,461 21. Cleveland: 7,004————-21. Toledo: 10,134—————21. Pittsburgh: 11,890 22. Providence: 6,488———–22. Akron: 9,020——————22. St. Paul: 11,220 23. Pittsburgh: 6,138————23. Fort Wayne: 8,513———–23. Fort Wayne: 11,180 24. St. Louis: 6,058————–24. Cleveland: 8,276————-24. Lincoln: 11,037 25. Fort Wayne: 5,774———-25. St. Louis: 7,704————–25. Toledo: 11,009 26. Orlando: 5,731—————26. Lincoln: 7,483—————-26. Cincinnati: 10,995 27. Nashville: 5,687————-27. Grand Rapids: 7,376——–27. Des Moines: 9,627 28. Madison: 4,708————–28. Orlando: 7,251—————28. Akron: 8,894 29. Lincoln: 4,508—————-29. Cincinnati: 7,230————29. Madison: 8,292 30. Akron: 4,431—————–30. Madison: 7,177————–30. St. Louis: 7,543 31. Grand Rapids: 4,154——31. Providence: 6,471———–31. Grand Rapids: 7,260 32. Des Moines: 2,674———32. Des Moines: 5,598———-32. Providence: 6,539 33. Dayton: 1,382—————33. Dayton: 3,025—————-33. Dayton: 5,629
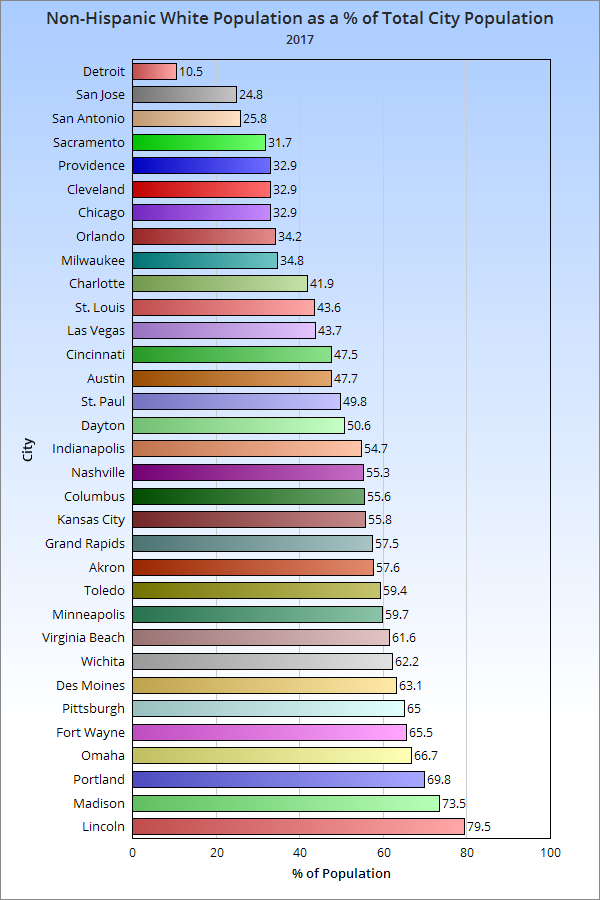
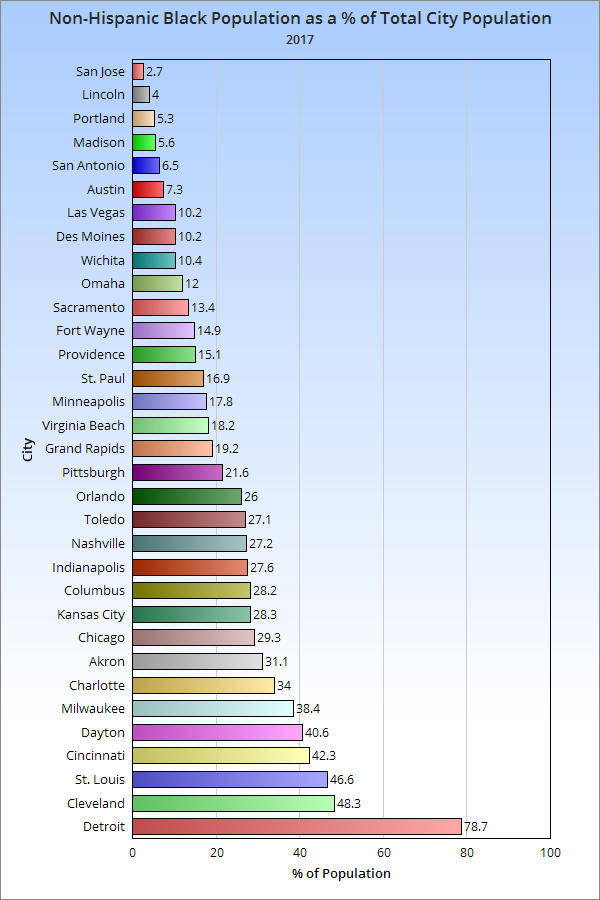
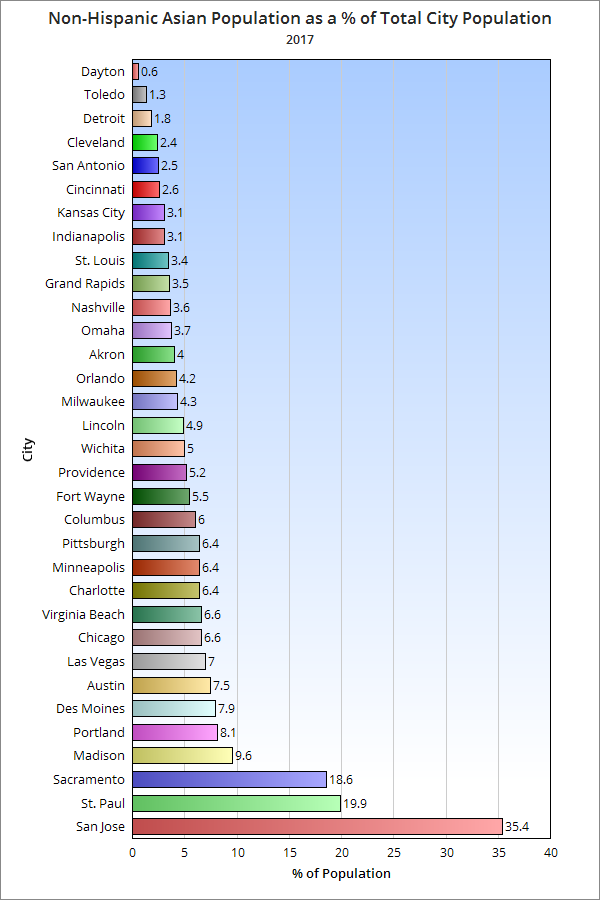
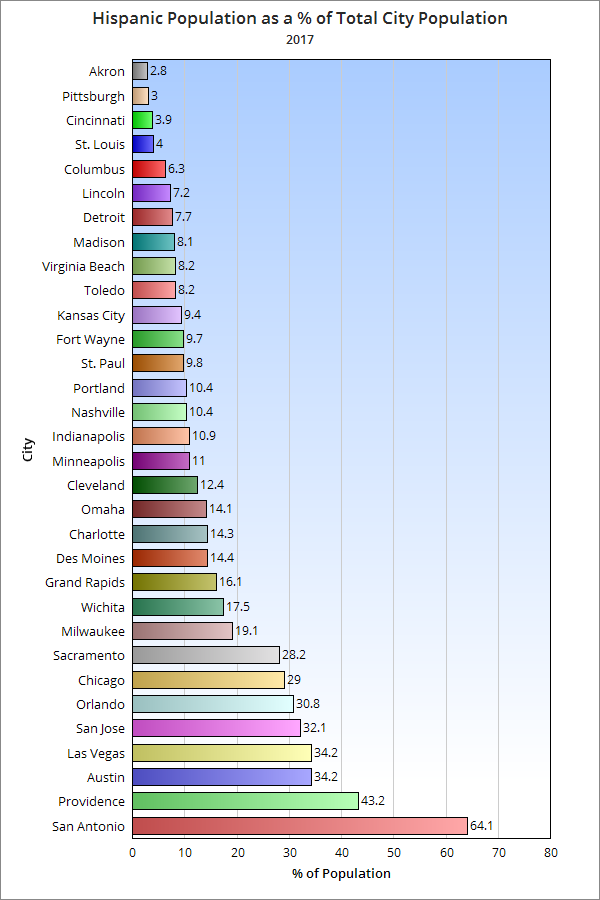
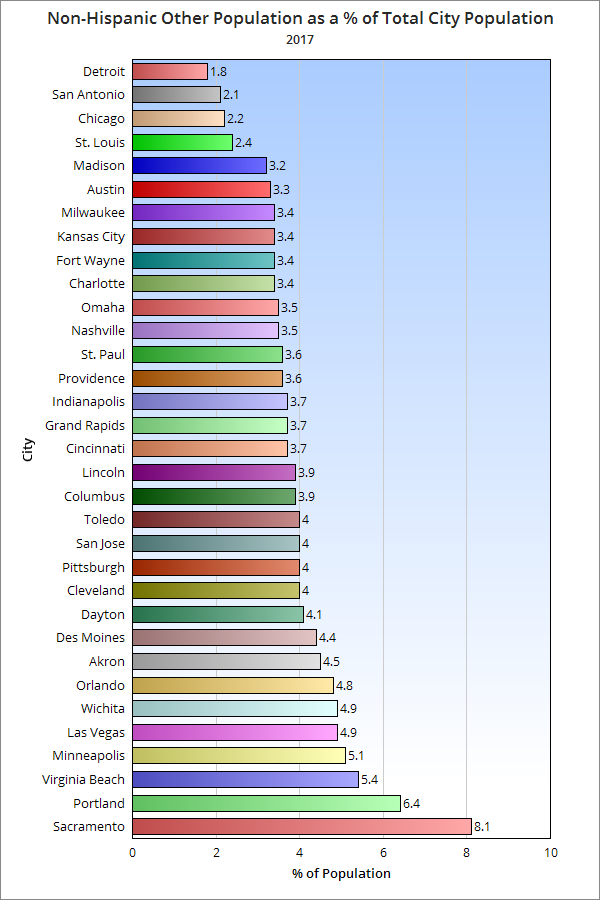
Finally, Columbus moved up from 6th to 5th in the total of Other, non-Hispanic population. Overall, Columbus ranks fairly well in totals vs. its peers, as one might expect given that it is one of the largest cities in the grouping. However, to truly find out how it compares with these other cities, you have to look at percentages, which tells how much of the city’s population is made up of each group. Columbus ranks in the middle of the pack for its % of Non-Hispanic White population. Like in most cities, even while this demographic is growing in total numbers in Columbus, the % of total population continues to fall. Columbus ranked in the top 3rd of peer cities for its % of Non-Hispanic Black population. Columbus also ranked in the top 3rd for its Non-Hispanic Asian population. Columbus ranks poorly with Hispanics in the group, ranking near the bottom. Finally, Columbus ranks in the middle for its Non-Hispanic Other population.
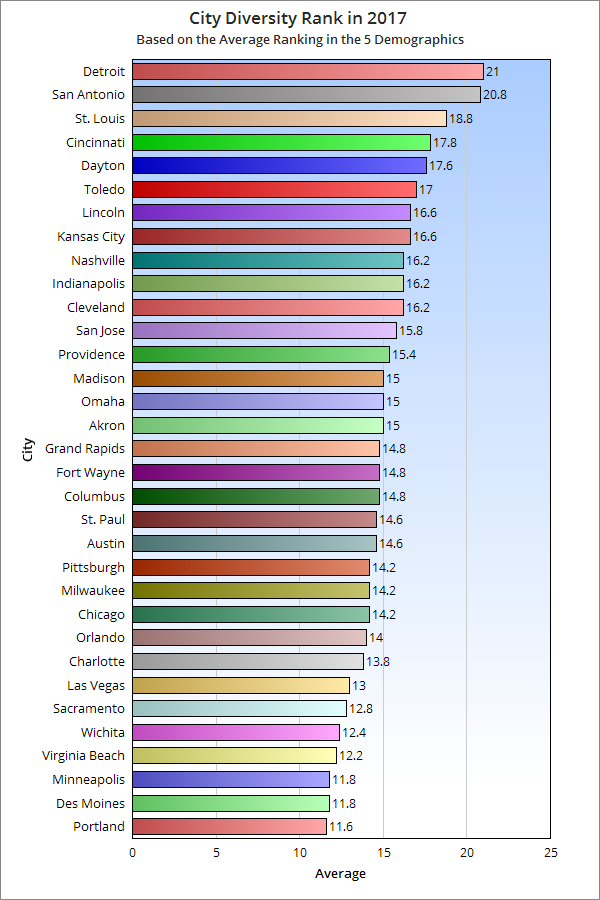
So what’s the final ranking for where Columbus is with diversity compared to its peers in 2017? To find out, I assigned points based on ranked position in each 5 racial categories and took the average of the positions in each 5. The result is that the higher the average number, the lower the overall diversity. So based on this, Columbus ranks in the top half of national and Midwest peers for diversity.
*Note: Normally, Youngstown would be included, but the data was not available.
The US Census 2017 demographic estimates came out today for cities and counties, and they show that Columbus is continuing to change quickly.
Highlights for the City of Columbus -The non-Hispanic Asian population continues to skyrocket, up over 67% since 2010. -Beyond that, all other racial groups saw population growth within the city since 2010. -The foreign-born population has climbed above 105,000, and now represents 12% of the total population, the highest % level since 1890. -Every age group has increased since 2010, but the older working-age population increased the most, as seen below: 19 and Under: +17,962 20-34: +22,627 35-64: +32,045 65+: +22,234
Check out all of the City, County and Metro Area demographic and population data on the Demographics and Population page.
The US Census recently released updated estimates for 2016 for smaller-area designations like tracts and blocks. Looking at them, I wanted to see where racial groups were growing the fastest at that level. The first map is based on the % change from 2010 to 2016. What’s interesting about this map is that it is such a hodgepodge. No single part of the county is dominated by growth in any specific racial group. However, a few things can be generally determined. For example, almost all of the tracts where the White population is growing the fastest are within I-270, and the majority of those within the eastern half of the Columbus in what have long been dominated by Black majority populations. These areas include parts of Linden, the Near South and Near East sides. That said, the White population was growing the fastest in just 30 census tracts by % change. This compared to 53 for the Black population, 83 for the Asian population and 107 for the Hispanic population.
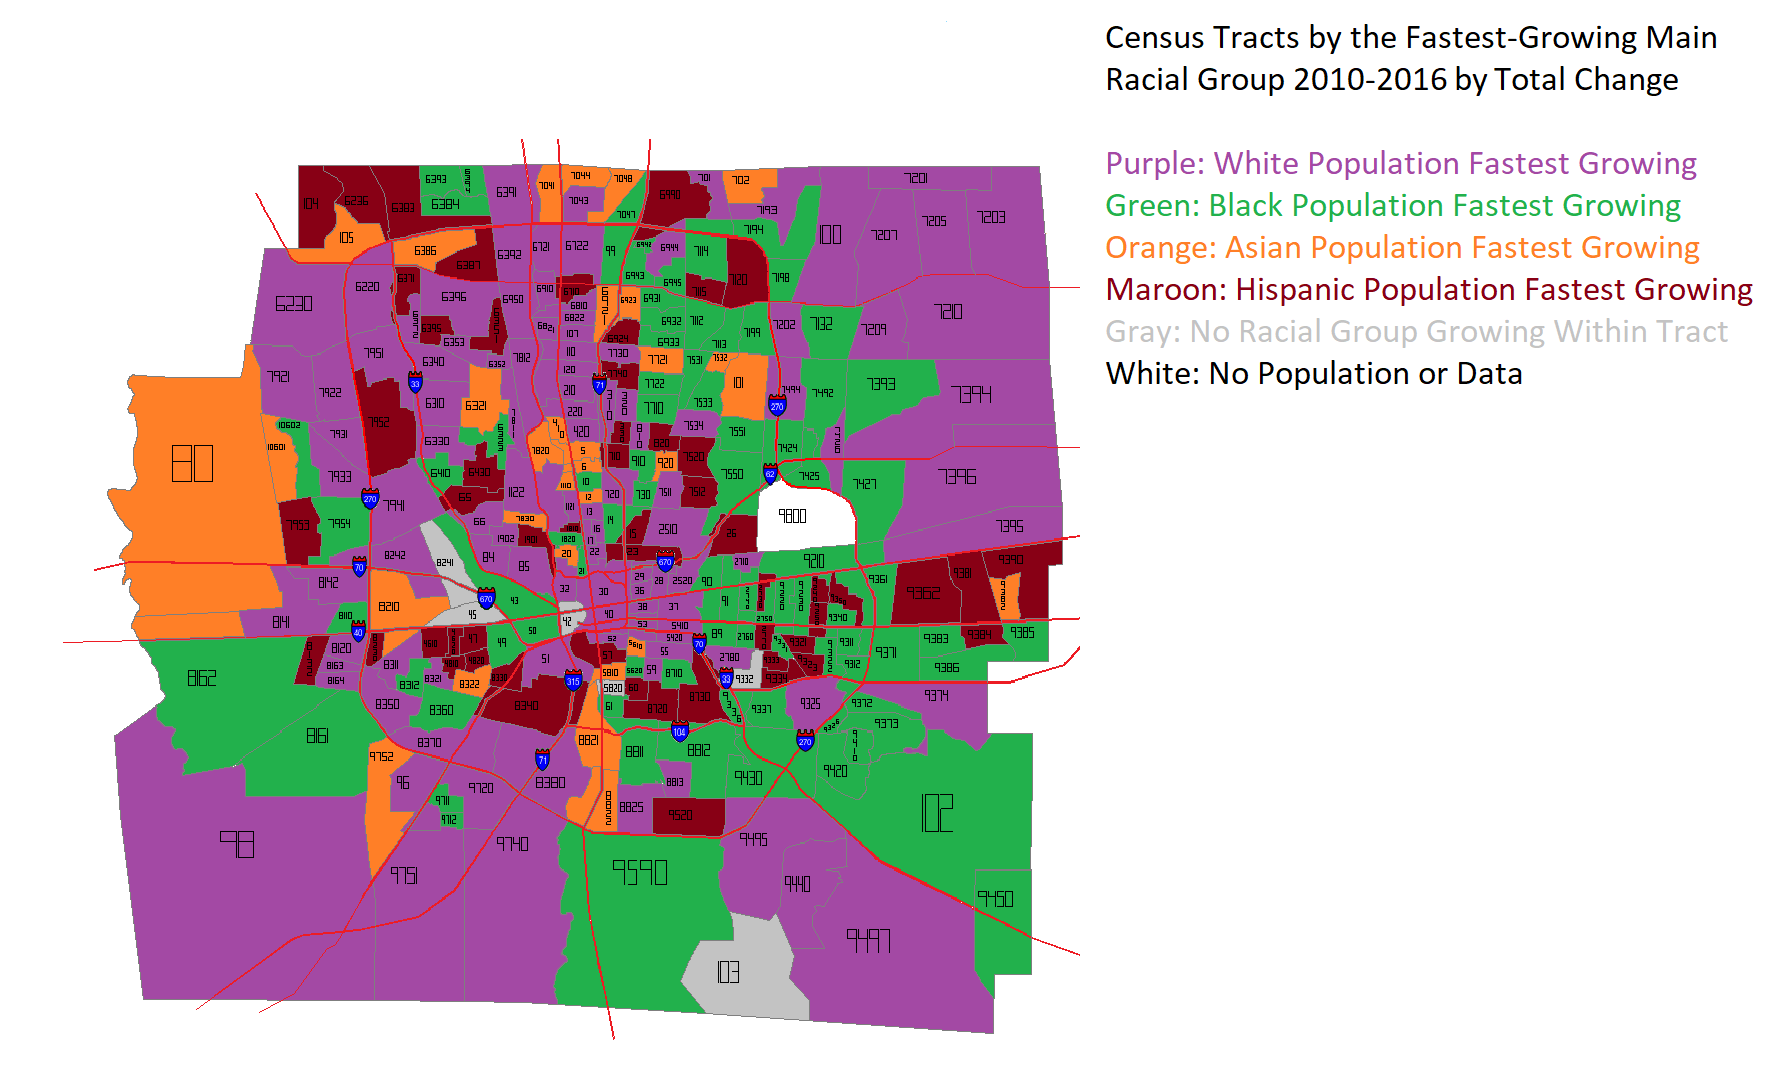
The next map takes a slightly different approach, measuring the TOTAL change in population, rather than by %. Again, a hodgepodge, but much less so than before. Instead of being the fastest-growing in just 30 tracts, the White population rockets up to 108 tracts. This shows that, while Asian and Hispanic populations have respectable % growth, this is largely based on comparatively small population bases. Still, non-White populations are clearly making inroads throughout Franklin County.
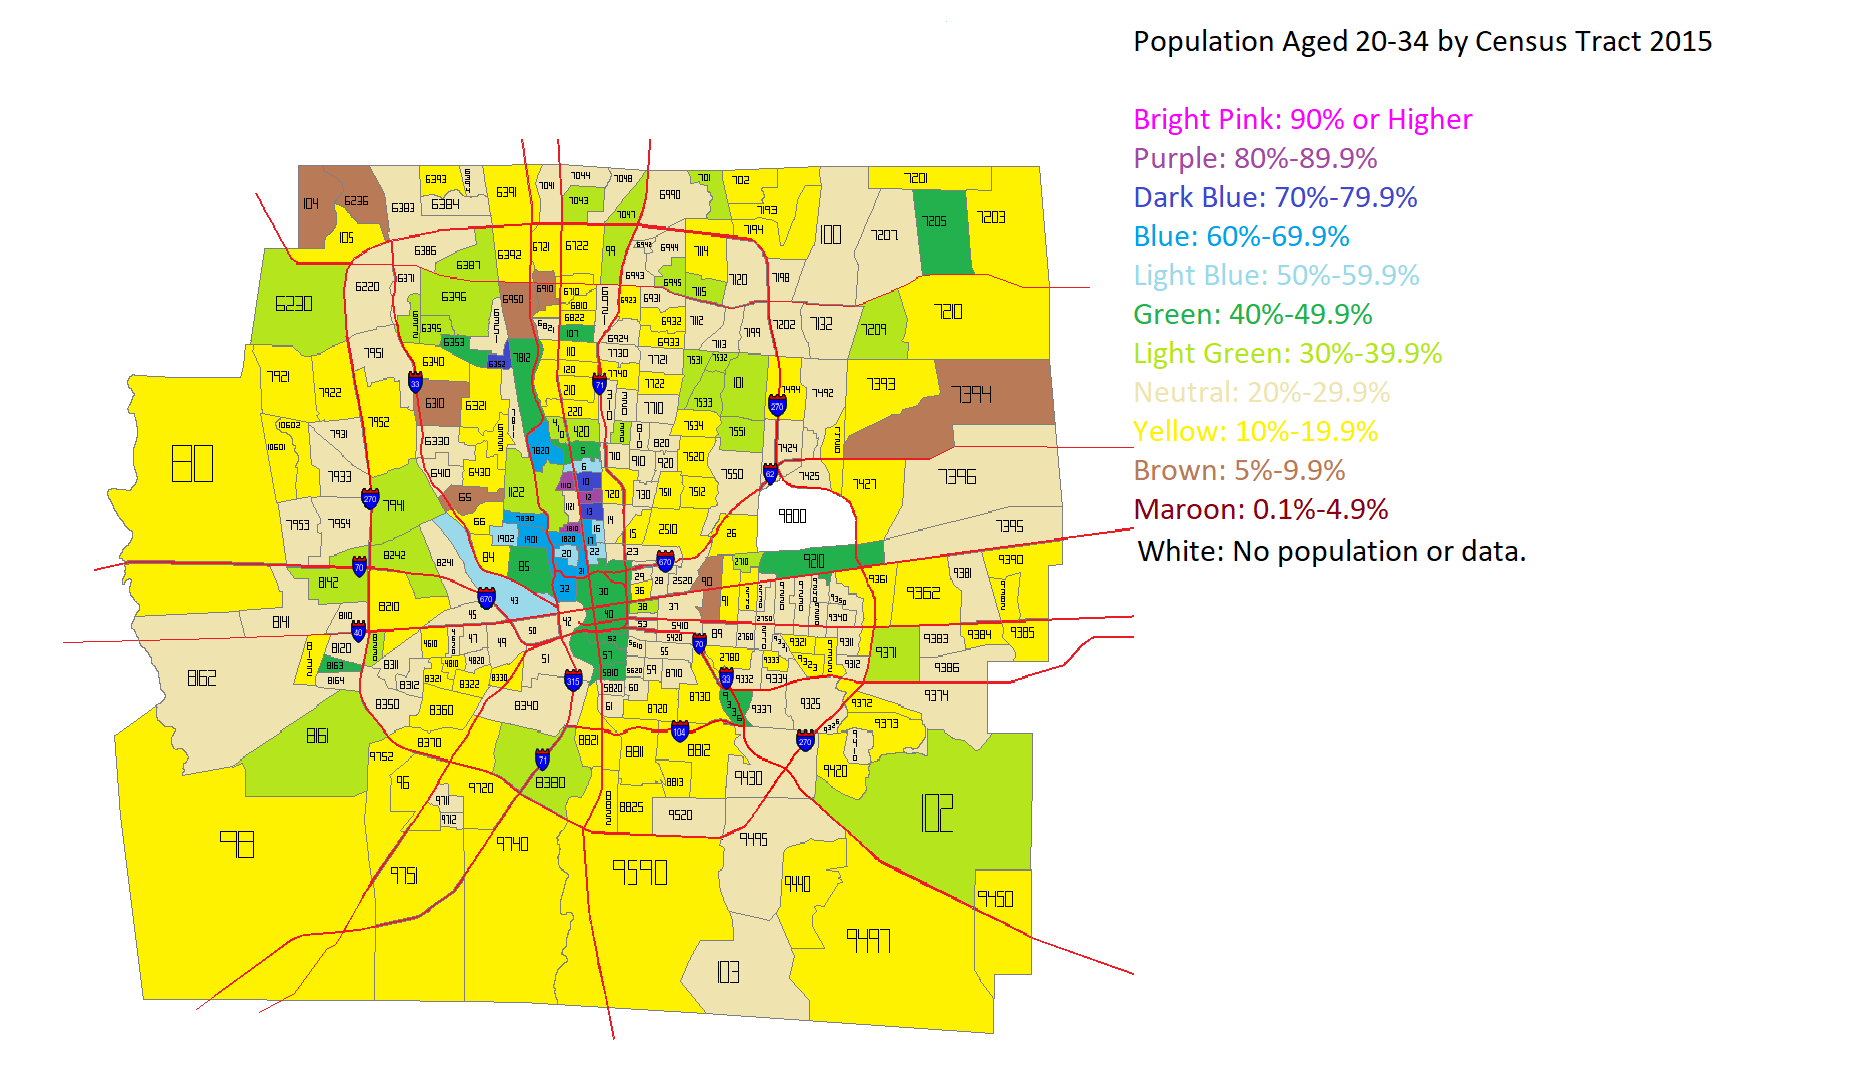
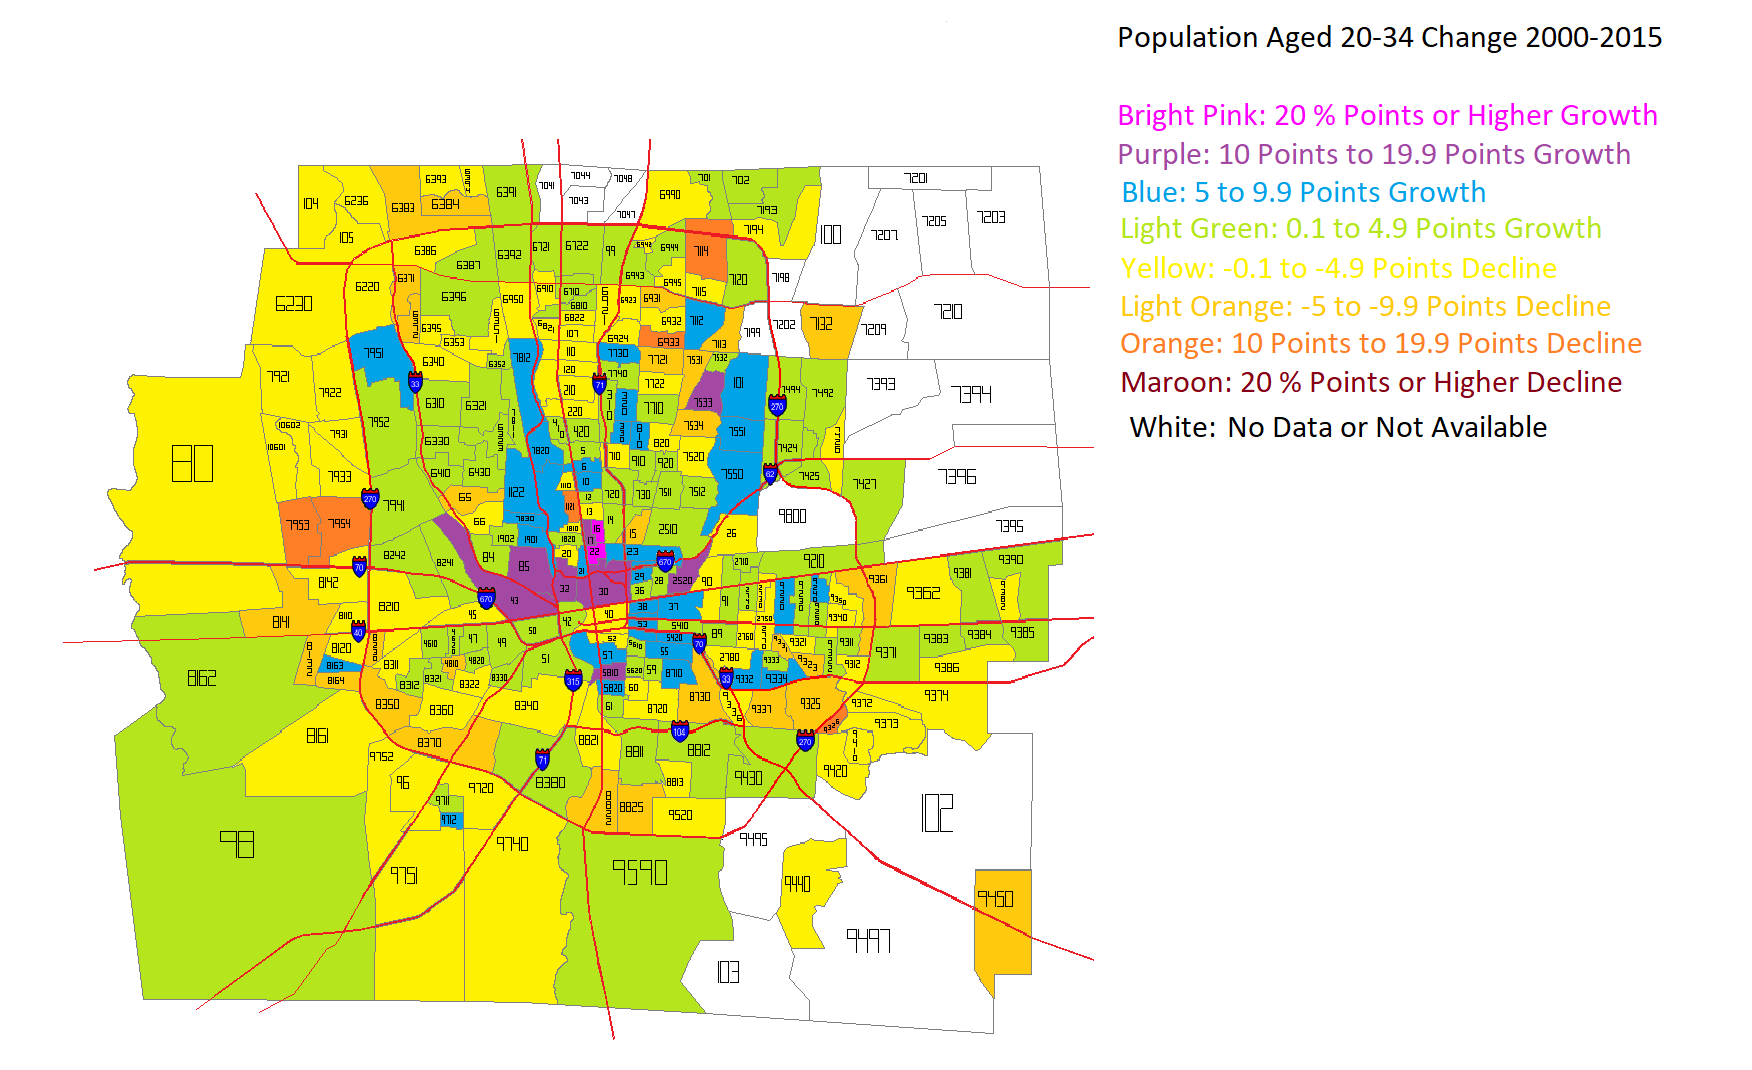
I’ve seen several articles across the internet lately questioning the idea that Millennials and young adults prefer density and urban areas. I decided to see how this played out in Franklin County overall. I first looked at the total population aged 20-34 in the year 2000 and the year 2015 by Census Tract. Here were the maps for those years.
After looking at the numbers for both years, I came up with this map for how that age group had changed in the 2000-2015 period.
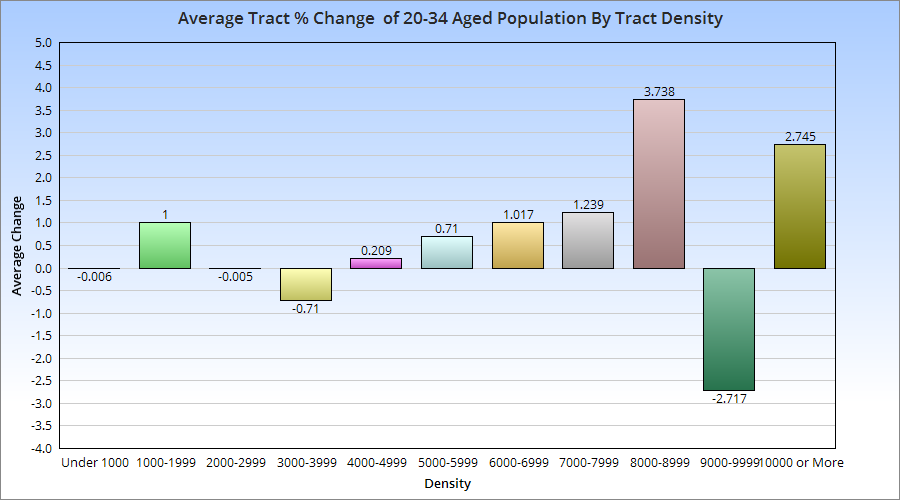
Unfortunately, some tracts, particularly in the eastern suburban areas, did not exist in 2000, and so I was not able to figure out the change for them during the period. The rest of the map, however, shows that the strongest growth in this age group was not only inside 270, but closest to Downtown and central corridors along Broad and High Streets. These maps don’t tell us about the relationship between those changes and the population density of the census tracts. So I went further and broke the tracts into increments of density to see where the strongest growth was occurring.
With a few exceptions, there appears to be a correlation between average 20-34 aged population growth and the density of the census tracts it occurs in. This suggests that this age group, at least in Franklin County, prefers areas with moderate to high density, which typically translates to urban living.