The Scioto Peninsula looking east.
The history of the Scioto Peninsula is much the same as the Franklinton neighborhood it resides in. Since Franklinton’s founding in 1797 (Columbus’ oldest neighborhood and predates Columbus itself by 15 years), it did not take long to figure out the area’s one major flaw: Floods. Essentially built upon a river flood plain, Franklinton flooded several times during the 19th century, but the most devastating came in 1913 and 1959. The 1913 flood, Ohio’s deadliest and most widespread natural disaster, inundated Franklinton with up to 20 feet of water in places, and the neighborhood flooded all the way back to where present-day I-70 cuts through the far western border. Franklinton suffered massive damage, and over 100 people died along the Scioto in Columbus. The flood in 1959 was less severe, thanks to flood protections put into place after 1913, but one consequence of this flood was that new construction and most renovation was all but prohibited due to the flood risk. This helped to stagnate the entire neighborhood, and combined with the urban decline for the next several decades, Franklinton gradually fell into disrepair. The Scioto Peninsula, the far eastern section of the neighborhood just across from Downtown, was always the hardest hit by flooding. As such, the 56-acre peninsula gradually became a manufacturing and warehouse site, although a few thousand people did live there in low-income housing projects. Central High School also helped to maintain a residential presence.
As manufacturing declined and more people left the urban core, the warehouses and businesses closed shop. Many were bulldozed into vacant lots. Central High was closed as a school in the early 1980s. By the mid-1990s, the area was largely empty except for Veteran’s Memorial and a handful of housing developments and businesses. Plans were in the works to help bring Franklinton back, however, and construction of the Franklinton Floodwall began at this time. This construction helped encourage COSI to move into Central High, renovating and expanding the old building in exhibit and museum space. Most of the rest of the peninsula became surface parking. In 2004, with the completion of the floodwall, building restrictions were finally lifted, but for several years, little happened. The stigma of a neighborhood in decline kept development interests away.
In 2010, Columbus came out with a list of 12 projects it wanted to accomplish in the downtown area. Some of them have come to pass, such as the renovation of the riverfront with Scioto Mile and the redevelopment of City Center into Columbus Commons. Another one of these projects was the redevelopment of the Scioto Peninsula. The city saw an opportunity in so much empty land so close to Downtown, especially coinciding with the emerging back-to-the-city movement. This prime real estate was ripe. The city began planning of this project early in 2012, as East Franklinton itself began to emerge as an artist destination. The Short North has, more or less, reached the final stage of gentrification. It’s become upscale, attracting high end retail and residential, as the number of art galleries has gradually declined due to rising rents. Franklinton has proven to be an attractive alternative, with such live-work projects as 400 Rich, which grew rapidly in its first year. Residential projects are now in the works, as well as more artist space, warehouse conversions and new bars and restaurants.
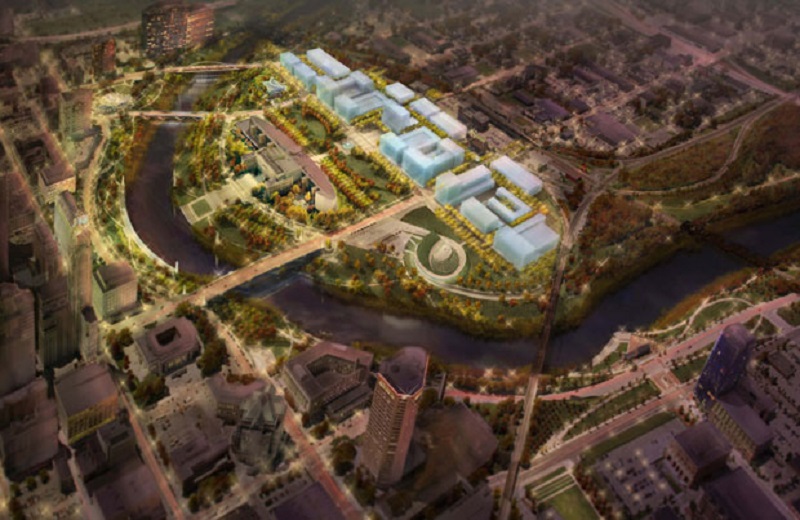
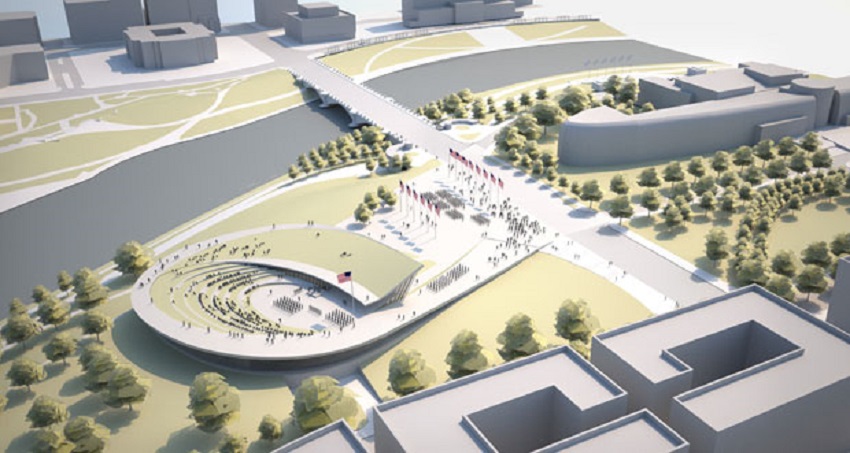
General plan for the Peninsula.
A few months back, details of the Peninsula’s redevelopment plan began to trickle out, but the official announcement finally came yesterday. Here is what we now know of the plan:
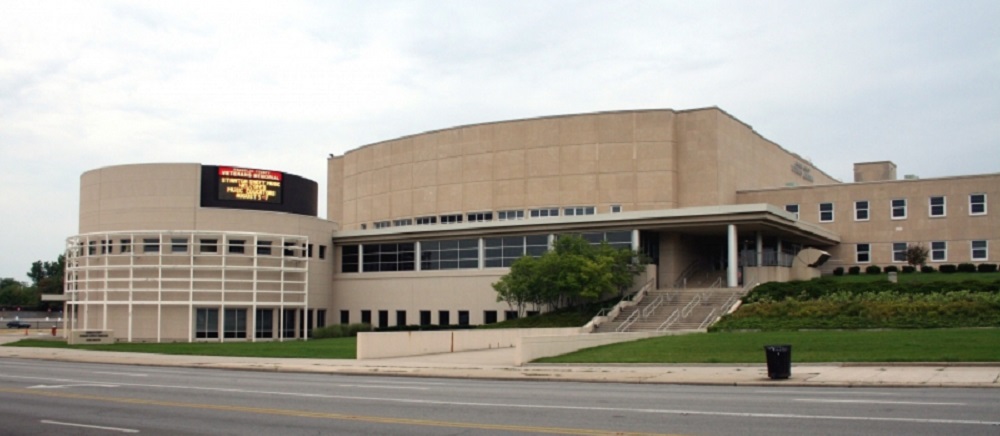
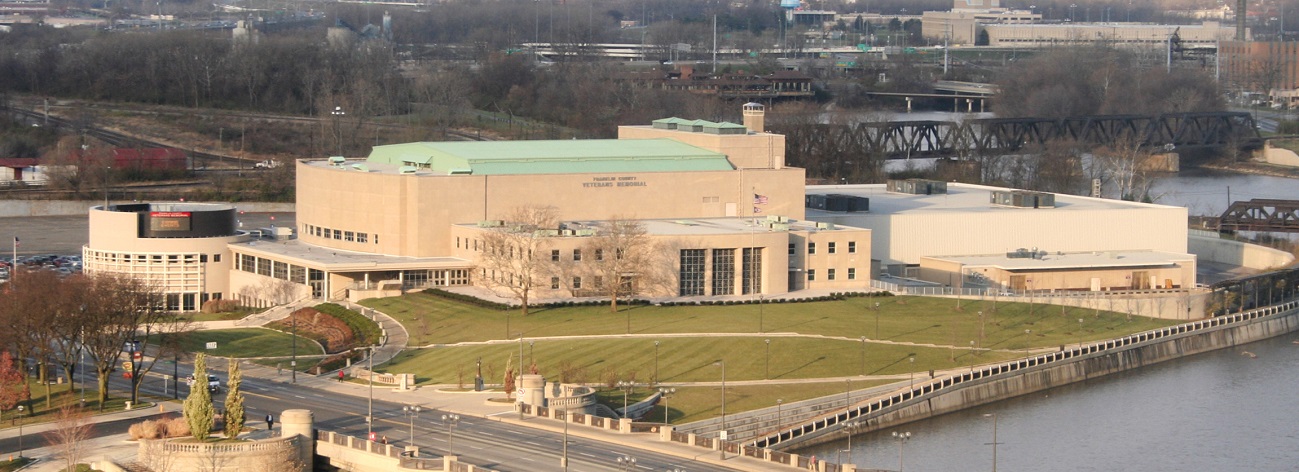
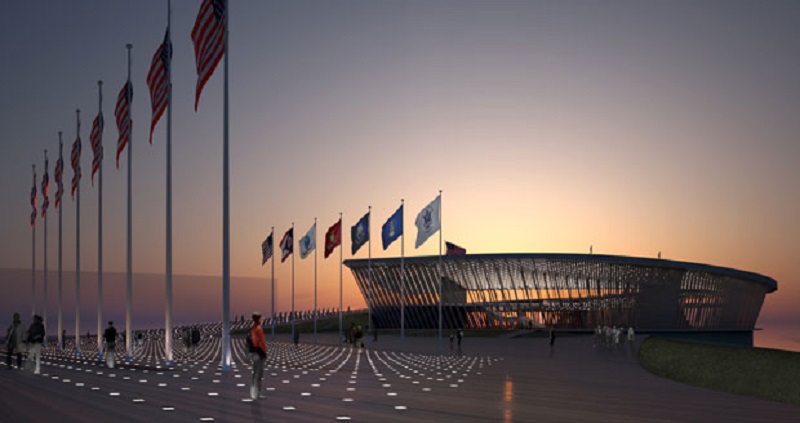
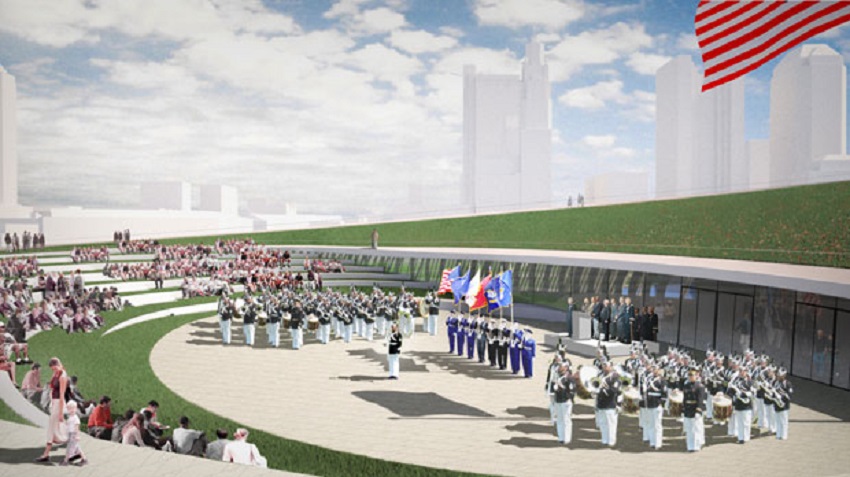
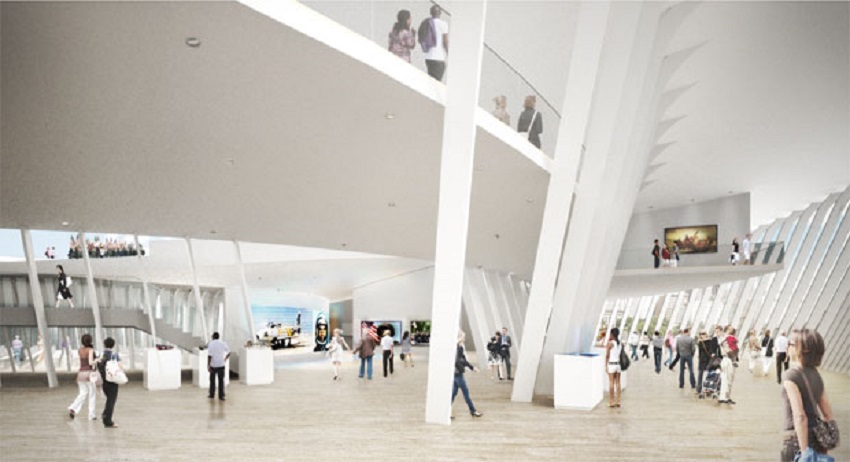
1. Veterans Memorial, built in 1955 and expanded/renovated a few times over the years, will be torn down and replaced with a new Vets. This new Vets will be of modern design, spiral in shape with glass walls and a rooftop, outdoor amphitheater. Inside will be an Ohio military museum, along with meeting and event space. Estimated costs run around $50 million.
Old Vets Memorial
New Veterans Memorial
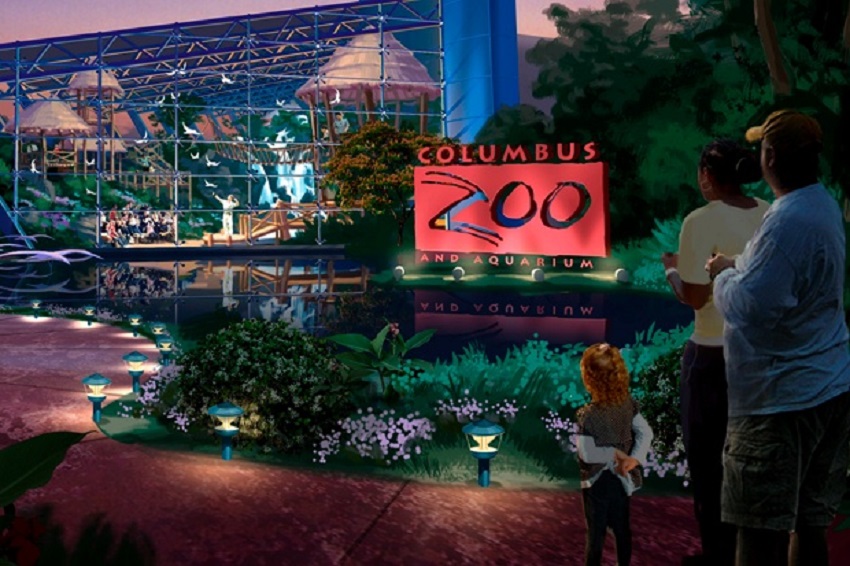
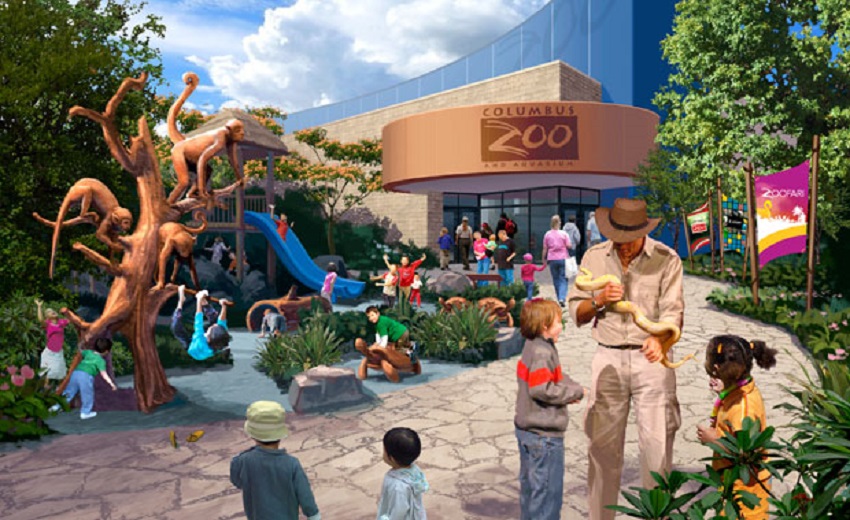
2. Southwest of COSI, the Columbus Zoo will build a $50+ million, 50,000 square foot zoo extension. The building will include an aquarium, rainforest, outdoor zoo-themed playground and other exhibits.
3. Where the current COSI parking lots are, a large underground parking garage will be constructed to serve the 3 attractions. Once complete, the garage will be covered by a large central park.
4. While not yet designed and weren’t talked about yesterday, previous details have included elevated walkways connecting all 3 buildings across the peninsula.
5. Between Bell Street and the railroad tracts that run along the western border of the peninsula, a mix of low, mid and high-rise mixed-use buildings will go in. Ground floor retail will line streets while upper floors will be mostly residential. Between 1,000 and 1,200 residential units are planned, but private interests could easily include more given the very high demand for urban residential and the fantastic location with views of Downtown and the river. Estimated costs exceed $100 million.
6. Not included specifically in the peninsula plan, but surely also impacting it, will be the Scioto River itself. Another one of the 12 projects is the removal of low-head dams through Downtown. This will lower the river level through Downtown, creating 33 acres of new land that will be landscaped into park space. Bike paths and walkways will also be constructed on this new land. The river itself will run faster, cleaner and open up more potential recreational uses. This project is set to begin this fall and complete in 2015. Estimated costs for the project are around $25 million.
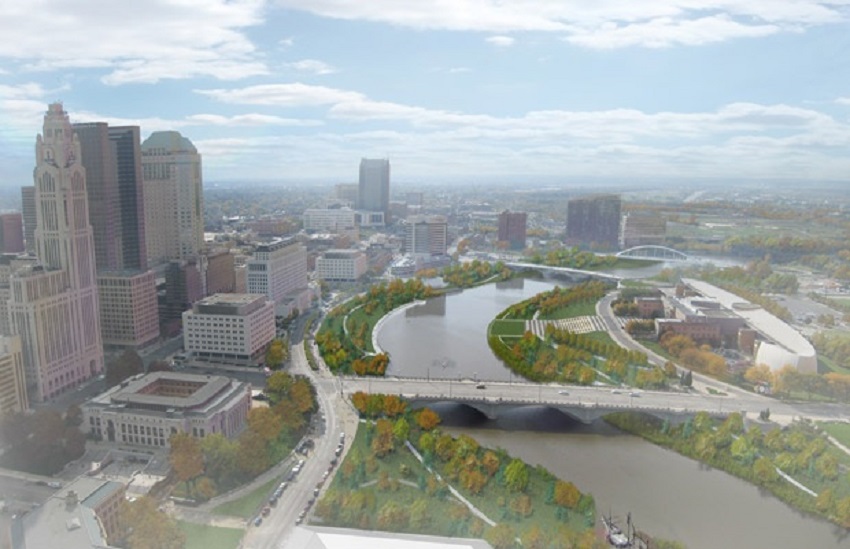
The Riverfront after reconstruction.
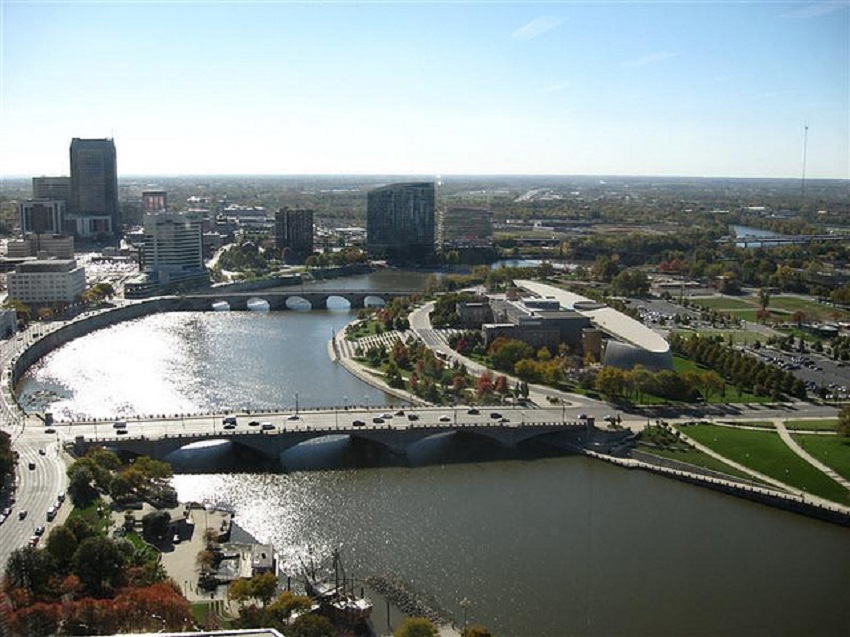
The Riverfront now.
7. After the completion of the river restoration project, another one of the 12 ideas should begin. That will be the construction of a signature pedestrian bridge connecting North Bank Park in the Arena District with the Scioto Peninsula near the new Vets. There are no cost estimates at this time.
So given all this, the Scioto River and the Scioto Peninsula are looking at several hundred million in investment and development over the next several years. This will radically change the riverfront, and has the potential to jumpstart Franklinton, especially eastern parts, in ways not seen in many decades.
Much more about local development can be found here:
Development Under Construction
Proposed Development