So first up to repost from the data loss will be one of the easiest. As mentioned the first time, I wanted to create a map that included the 10-county metro area highlighting every bit of existing, planned and under construction infrastructure involving biking and pedestrian activities. There are some existing maps that show this, but they are not regularly updated and they lack significant detail in what type of infrastructure exists.
The map is still very much a work in progress. I have neither finished the existing infrastructure level or the planned infrastructure level. I update it a bit more almost every day, so keep checking back!
With temperatures predicted to fall to near freezing for the first time this week for the fall season, I thought it might be interesting to take a look at the incidence of early season cold, and the average on when it tends to arrive.
Here are the earliest dates on record for the following:
Average Date of First Under-40 Temp By Decade (1878-2014) 2010s: October 11th 2000s: October 8th 1990s: October 2nd 1980s: September 30th 1970s: October 1st 1960s: September 25th 1950s: September 25th 1940s: September 30th 1930s: October 11th 1920s: October 2nd 1910s: October 9th 1900s: October 5th 1890s: October 1st 1880s: October 2nd 1870s: October 1st
Average Date of First 32 or Below High By Decade 2010s: December 4th 2000s: December 2nd 1990s: December 7th 1980s: November 28th 1970s: November 29th 1960s: November 23rd 1950s: November 26th 1940s: December 2nd 1930s: November 27th 1920s: November 28th 1910s: November 22nd 1900s: November 30th 1890s: November 25th 1880s: November 30th 1870s: December 4th
Average Date of First 32 or Below Low By Decade 2010s: October 24th 2000s: October 26th 1990s: October 22nd 1980s: October 17th 1970s: October 17th 1960s: October 8th 1950s: October 22nd 1940s: November 3rd 1930s: October 24th 1920s: October 28th 1910s: October 31st 1900s: October 24th 1890s: October 20th 1880s: October 20th 1870s: October 26th
This occasional series on failed and canceled projects around the city today talks about an unassuming parking garage that was originally supposed to be much more.
Beginning in 1984 and continuing into 1985, a parking garage/city office tower was being tossed around to house an increasing number of city office works. Space had become tight and many existing buildings were more than 50 years old and required extensive renovations. The Daimler Group started construction on the 10-story garage part of the project at the southeast corner of W. Gay and N. Front in late 1984. The 16-story office project that would’ve been built on top (for a total 26-story building) was just one of 3 options the city was considering to alleviate its office problems. The other two options consisted of a $75 million civic center about a block north of City Hall, or simply renovating the existing buildings.
In the end, it was deemed that there were too many other problems to spend public dollars on. At the time, there was quite an issue with road maintenance funding, and the city deemed that it was not the right time to build a brand new tower for city workers. By April 1985, the project was dead, although the garage was finished and remains to this day.
The Gay and Front garage in 2015.
Ironically, within a few years, the city would have several much larger office towers. 5 new towers were built between 1986 and 1991, though not all were specifically built for city offices. Renovation of existing buildings has been ongoing since.
This Random Columbus Photos 3 edition looks at a Downtown icon, the Columbus Athletic Club..
Photo Date: November 1, 1914 Location: 136 E. Broad Street
The photo shows the ongoing excavation of the Columbus Athletic Club. It was conceived a few years prior as a social club by a group of wealthy Columbus businessmen in 1912. The organization was originally housed in the Atlas Building at Gay and High, but the club wanted their own building. Construction began in early 1914, and the 6-story building was dedicated in 1915. The 100-year-old institution, now on the National Register of Historic Places, looks pretty much the same as it did when it was first built, and it remains a private club to this day. Over the years, the club has had many prominent members, including politicians and even a president, Warren G. Harding.
The FBI recently released full 2014 crime statistics for its Uniform Crime Reporting program, and the results show how Columbus crime plummets between 2010 and 2014.
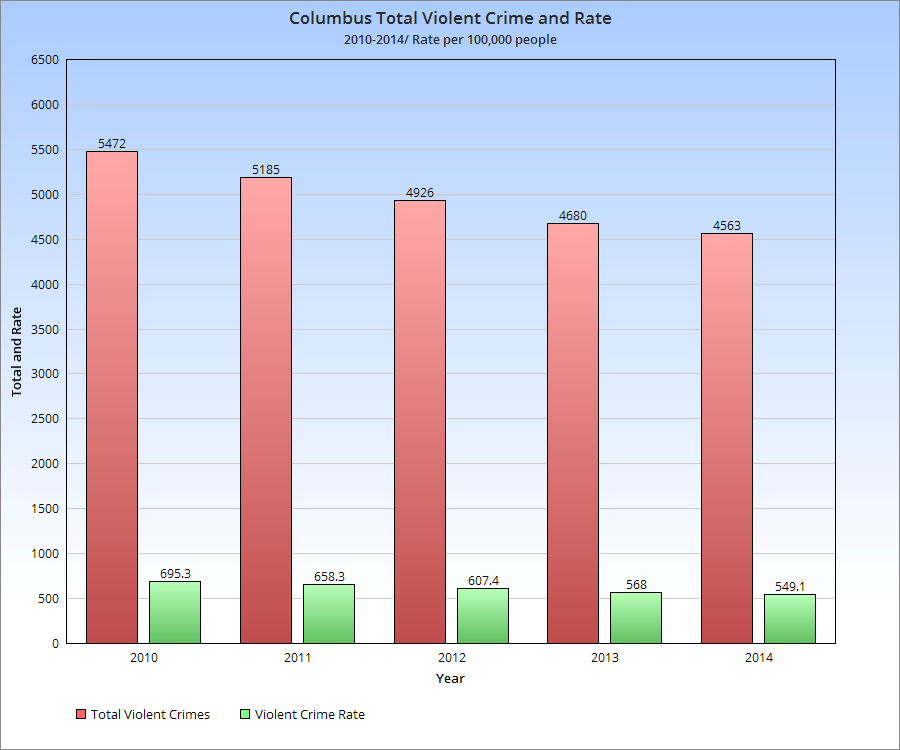
Let’s take a look at some of the numbers. First up, violent crimes.
Total violent crimes between 2010 and 2014 fell 16.6%, with any single person’s chances in 100k of being a victim of violent crime falling 21%. This is a pretty significant drop in just 4 years.
Here’s an individual violent crime breakdown: -Murders were down 15.2% -Rape was up 28.6%. The definition has changed in this time, which may explain some of that increase. -Robbery was down 37.7% -Aggravated Assault was up 14.6%.
So some good and bad. The good news for assault is that it’s well under where it was just 10 years ago, and almost 50% down from its historic peak in the early 1990s. It may have just been a bit worse year in 2014 for this, as all crime totals go through spikes even during a general decline. The bad news is that rape is historically high, but because the definitions have changed for it recently, it’s hard to make a fair comparison to previous years. If the current definition was in place years ago, it’s certainly possible it would now show a decline. Or, as with assault, rape totals could’ve seen a temporary spike above the trend line. Future years will tell the tale.
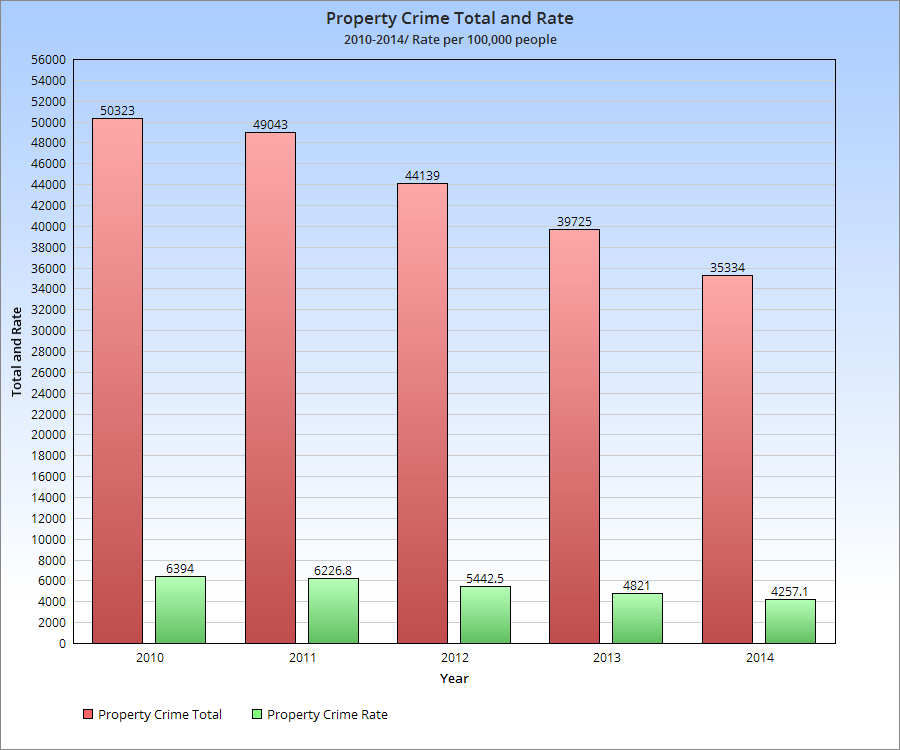
Now for property crime, something that’s always been somewhat high in Columbus, possibly due to the young population age and large number of college students.
Property crime in the city has dropped 29.8% 2010-2014, even more significant than the decrease in violent crime.
So what about 2015 and beyond? Well, indications are that crime is up for 2015 vs. last year, though there are differing theories as to why. Crime being up seems to be widespread in cities around the nation, and some of it has been attributed to a newfound national popularity in heroin. Until we see 2015’s number sometime next year, we won’t know exactly the impact. For now, we can celebrate that the city has indeed become safer.