New 2023 population estimates of Columbus metro places were just released by the US Census. In general, they showed that most places are now recovering from the pandemic population decline blip.
First, the full list of all available population estimates for Columbus metro area incorporated places. This list does not include Census Designated Places, as estimates for those are only done once per decade. Red places have moved down in the rankings, green have moved up.
2023 Population Estimates by Columbus Metro Places | ||
Rank | 2020 | 2023 |
1 | Columbus: 905,939 | Columbus: 913,175 |
2 | Newark: 49,948 | Newark: 51,046 |
3 | Dublin: 49,313 | Dublin: 48,923 |
4 | Delaware: 41,327 | Delaware: 45,158 |
5 | Grove City: 41,244 | Grove City: 42,782 |
6 | Reynoldsburg: 41,070 | Lancaster: 41,422 |
7 | Lancaster: 40,540 | Reynoldsburg: 41,220 |
8 | Westerville: 39,194 | Westerville: 37,958 |
9 | Hilliard: 37,113 | Hilliard: 37,262 |
10 | Upper Arlington: 36,795 | Upper Arlington: 35,743 |
11 | Gahanna: 35,726 | Gahanna: 35,159 |
12 | Marysville: 25,585 | Marysville: 28,423 |
13 | Pickerington: 23,100 | Pickerington: 25,256 |
14 | Whitehall: 20,127 | Whitehall: 19,727 |
15 | Pataskala: 17,883 | Patakala: 18,346 |
16 | Worthington: 14,783 | Worthington: 14,497 |
17 | Powell: 14,250 | Powell: 14,491 |
18 | Bexley: 13,925 | Circleville: 14,452 |
19 | Circleville: 13,925 | Bexley: 12,785 |
20 | New Albany: 11,053 | New Albany: 11,335 |
21 | Heath: 10,414 | Heath: 10,693 |
22 | London: 10,272 | London: 10,533 |
23 | Canal Winchester: 9,119 | Canal Winchester: 9,777 |
24 | Grandview Heights: 8,085 | Grandview Heights: 8,841 |
25 | Logan: 7,292 | Sunbury: 8,340 |
26 | Sunbury: 6,610 | Logan: 7,166 |
27 | Groveport: 6,009 | Obetz: 6,971 |
28 | Granville: 5,950 | Granville: 6,281 |
29 | Obetz: 5,483 | Groveport: 5,806 |
30 | Johnstown: 5,183 | Johnstown: 5,310 |
31 | Ashville: 4,533 | Ashville: 4,760 |
32 | New Lexington: 4,430 | West Jefferson: 4,488 |
33 | West Jefferson: 4,145 | New Lexington: 4,447 |
34 | Plain City: 4,103 | Plain City: 4,338 |
35 | Mount Gilead: 3,499 | Mount Gilead: 3,533 |
36 | Commercial Point: 3,079 | Commercial Point: 3,215 |
37 | Baltimore: 2,980 | Baltimore: 2,991 |
38 | Buckeye Lake: 2,516 | Lithopolis: 2,708 |
39 | Crooksville: 2,421 | South Bloomfield: 2,660 |
40 | Hebron: 2,325 | Buckeye Lake: 2,588 |
41 | Richwood: 2,222 | Richwood: 2,494 |
42 | South Bloomfield: 2,147 | Crooksville: 2,402 |
43 | Lithopolis: 2,142 | Hebron: 2,384 |
44 | Cardington: 2,079 | Utica: 2,115 |
45 | Utica: 2,067 | Cardington: 2,101 |
46 | Minerva Park: 2,012 | Mount Sterling: 2,030 |
47 | Mount Sterling: 1,944 | Minerva Park: 1,944 |
48 | Roseville: 1,745 | Roseville: 1,740 |
49 | Somerset: 1,482 | Bremen: 1,502 |
50 | Bremen: 1,478 | Somerset: 1,473 |
51 | Hanover: 1,271 | Ashley: 1,318 |
52 | Ashley: 1,201 | Hanover: 1,317 |
53 | Ostrander: 1,094 | Ostrander: 1,197 |
54 | Thornville: 1,083 | Thornville: 1,092 |
55 | Urbancrest: 1,031 | Galena: 1,018 |
56 | Millersport: 977 | Williamsport: 1,012 |
57 | Williamsport: 972 | Urbancrest: 996 |
58 | Pleasantville: 943 | Millersport: 975 |
59 | Galena: 929 | Pleasantville: 951 |
60 | Shawnee Hills: 836 | Shawnee Hills: 915 |
61 | Milford Center: 805 | Milford Center: 903 |
62 | New Holland: 803 | New Holland: 830 |
63 | Junction City: 722 | Junction City: 720 |
64 | Amanda: 669 | Marble Cliff: 699 |
65 | Valleyview: 668 | Amanda: 680 |
66 | New Straitsville: 653 | New Straitsville: 651 |
67 | Marble Cliff: 638 | Valleyview: 647 |
68 | Thurston: 606 | Thurston: 605 |
69 | Riverlea: 596 | Stoutsville: 577 |
70 | Stoutsville: 578 | Riverlea: 575 |
71 | Buchtel: 519 | Buchtel: 513 |
72 | Laurelville: 512 | Shawnee: 500 |
73 | Shawnee: 504 | Carroll: 500 |
74 | Carroll: 501 | Laurelville: 498 |
75 | Corning: 489 | Alexandria: 490 |
76 | Alexandria: 481 | Corning: 485 |
77 | Kirkersville: 468 | Kirkersville: 477 |
78 | Sugar Grove: 427 | Edison: 441 |
79 | Edison: 420 | Sugar Grove: 425 |
80 | Hartford: 401 | Hartford: 404 |
81 | St. Louisville: 351 | St. Louisville: 363 |
82 | Murray City: 345 | Murray City: 336 |
83 | South Solon: 326 | South Solon: 326 |
84 | Harrisburg: 313 | Harrisburg: 309 |
85 | Rushville: 306 | Rushville: 304 |
86 | Marengo: 280 | Magnetic Springs: 293 |
87 | Midway: 269 | Marengo: 280 |
88 | Magnetic Springs: 261 | Midway: 269 |
89 | Tarlton: 254 | Tarlton: 264 |
90 | Fulton: 249 | Fulton: 249 |
91 | Unionville Center: 239 | Unionville Center: 234 |
92 | Lockbourne: 237 | Lockbourne: 229 |
93 | Gratiot: 214 | Gratiot: 216 |
94 | Chesterville: 194 | Chesterville: 195 |
95 | Darbyville: 185 | Darbyville: 189 |
96 | West Rushville: 165 | West Rushville: 165 |
97 | Glenford: 165 | Glenford: 164 |
98 | Hemlock: 145 | Hemlock: 145 |
99 | Sparta: 122 | Sparta: 123 |
100 | Brice: 94 | Brice: 91 |
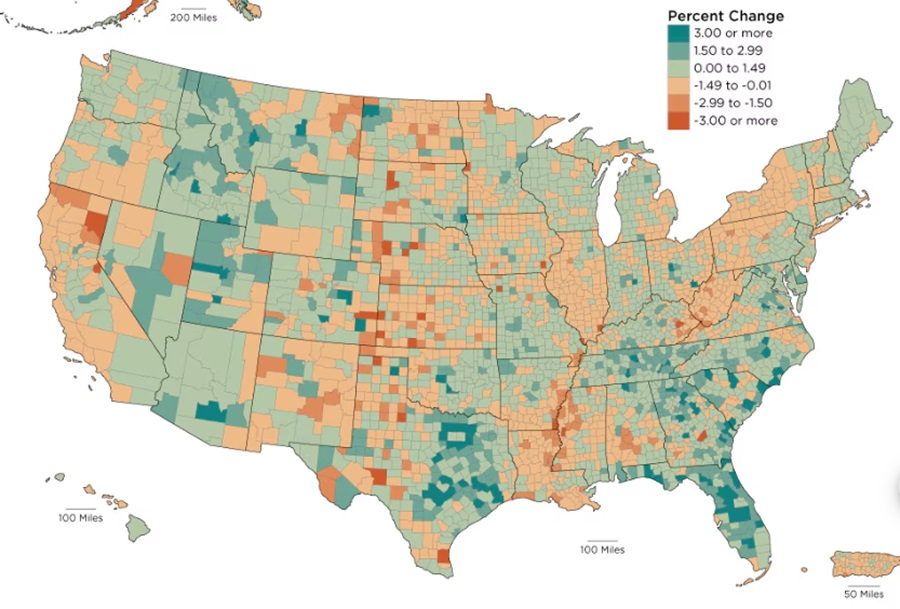
Out of Ohio’s 925 incorporated communities, 660 showed a population loss between 2020-2023, or 71.35%. 27 saw no population change, and 238- or 25.73%- saw population growth.
In the Columbus metro, however, 60% of its communities saw growth, with 6% seeing no change and 34% seeing a loss. The Columbus metro places represented just 5.15% of the total communities seeing loss within the state, but 25.73% of all the communities seeing growth. This shows just how poorly most of the state is doing in comparison to the Columbus area.