Unimaginative Developers Creating Poor Projects


Columbus continues to develop rapidly as the population grows. Demand is high and homes have been in short supply for years. Unimaginative developers creating poor projects and proposals seems to be the norm, however. Some of these proposals sacrifice historic buildings, others promote an entirely car-centric environment unfriendly to transit, bikes and pedestrians, while still others are a massive waste of site space.

Here are just a few recent examples of proposed projects that are baffling in their lack of creativity, access, accommodation and site potential.

167-191 S. High Street
Destroying Columbus history 167-189 S. High Street
The Plan
The 3 buildings pictured on this Downtown block of High Street are all in imminent danger. In a recent Columbus Business First article, it was reported that the 3 buildings were purchased by Cleveland-based Harsax Management Company, a construction and development firm. While the 1914 Ohio National Bank building at 167 S. High is supposedly the most likely to stay, the other two early 1910s buildings at 171-177 and 181-191 S. High are already likely to be demolished according to the company’s CEO.
No specific reason is given for the demolition proposal, only that the company plans to develop the site at some point afterwards. So the suggestion is that these buildings may be demolished without any actual plan in place to replace them, so they’d end up- at least for a short time- as an empty lot or parking.
The Problem
Not incorporating the southern two buildings into a new development is an entirely unnecessary wasted opportunity, and High Street and Downtown lose at least 2 more of of their old streetscape for no good reason. While the prospect of new development is exciting, the fact of the matter is that preservation can take place while still getting a new dense, mixed-use project for the site even if most or all of the existing buildings are saved.

Destroying Columbus history 181-191 S. High

The Walnut side of 181-191 S. High Street, showing its old stone foundation and other architectural features.


A Few Potential Solutions
The site is more than large enough to accommodate the existing buildings with new development, and there are 3 potential configurations that show this.
Option 1- The Least Destructive

The red area in the above map shows the best possible option. The main part of 171-177 is saved, along with the entirety of 181-189. The small parking lot, the skinny section of 171-177, and the later, smaller addition behind 181-189 would all be replaced with a new development. The area would encompass about 1/3 of an acre, plenty of space to build something fairly significant on. With the renovations of the existing buildings and the new, taller development in back, it would be a potentially spectacular addition to the RiverSouth part of Downtown.
In fact, a new project and renovation could incorporate the adjacent dead-end Walnut Alley into the plan, turning it into a market space, restaurant/bar patio, or both. It would be a shame to lose the addition as it is a cool little building itself, but if it allowed the other main buildings to be saved, it would ultimately be worth it.
Option 2- The Compromise

The second option would fully replace 171-177 S. High and the rear parking lot with a new build. The site would offer just under 1/3rd an acre, so it would be the smallest available option, but would still allow a taller, dense, mixed-use project with High Street frontage. It would also allow both 181-189 and its rear addition to be saved and renovated, which are arguably more important.
Option 3- The Greatest Sacrifice

Option 3 would require the demolition of 171-177 and the rear addition. This would allow the developer to build an L-shaped project with the new building having direct High Street frontage. It would be a greater loss than Options 1 and 2, for sure, but still a potential compromise versus full demolition. Furthermore, the new building could maintain 171-177’s facade so that the old streetscape look is still maintained. This would be similar to what was done with this hotel project on Park Street.

The fact that the developer either hasn’t considered such options, or isn’t interested in them, is unfortunate. Given its prime location, the potential for this site is extremely high, both in terms of a new build and preservation. It would be incredibly short-sighted of the Downtown Commission to allow full demolition of the site to take place, even if the developer ultimately proposes something significant for the site.

45 W. Barthman Avenue
Developers creating poor projects 45 W. Barthman
The Plan
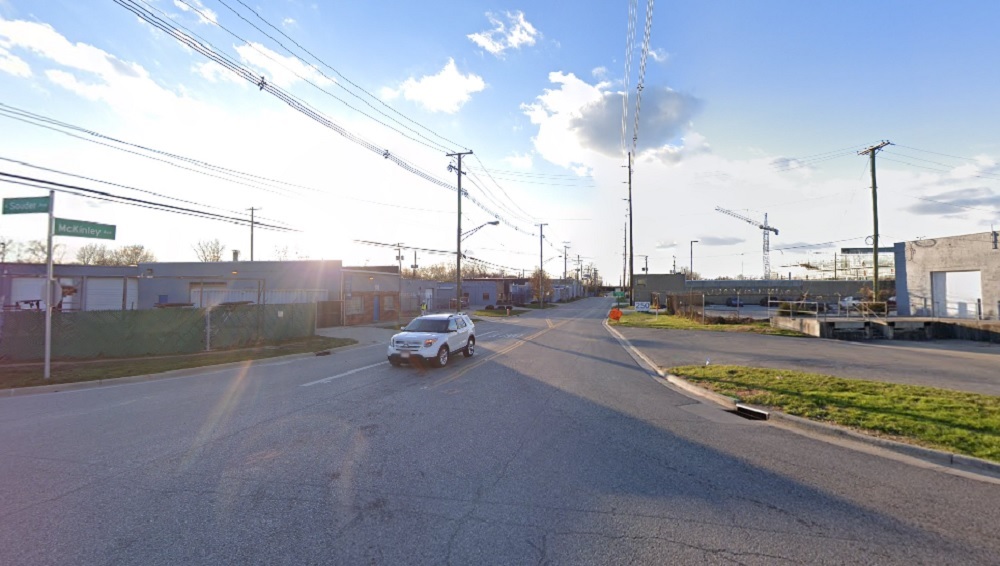
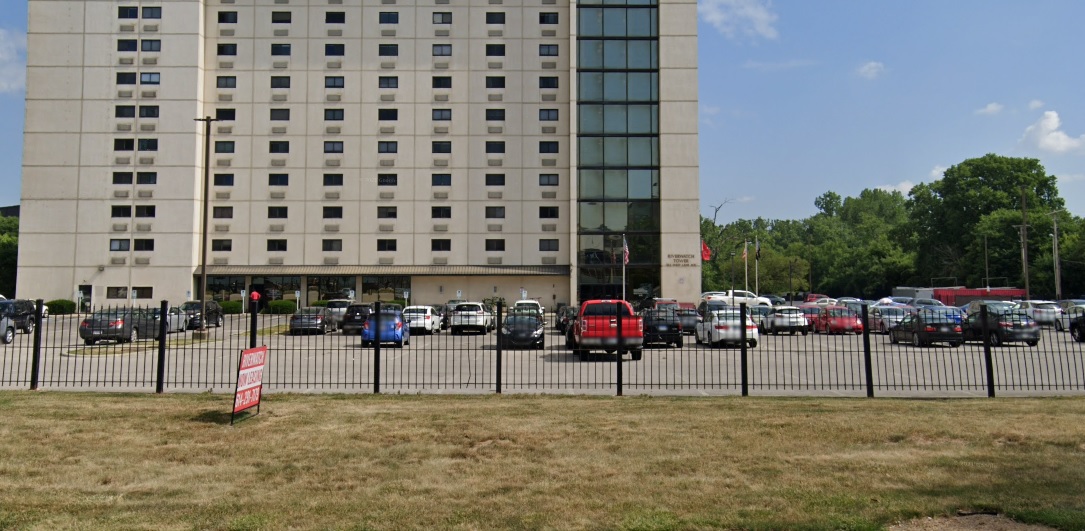
This 8.2-acre South Side site is a former industrial area that has been mostly vacant and abandoned for many years. The NRP Group, another Cleveland-based development company, wants to turn this site into a residential complex with 200 apartments in 3 buildings.

The site as it exists now.


The proposed site layout.


The Problem
The 8.2-acre site is one of the largest single development sites available anywhere on the South Side. 200 units is an insultingly low density for the space. Furthermore, the layout is absolutely awful. The 3 proposed buildings are completely surrounded by surface parking lots, and the positioning of the buildings make it virtually impossible to ever add additional housing on the site later on. It’s also entirely unfriendly to pedestrians, as the site plan shows no sidewalks or pathways along Wall Street and no connections across it. There are only small sections of sidewalk between the buildings and the parking lots, but they do not connect with each other between the 3 buildings. This is about as poor of a plan as it gets.
A Potential Solution

A new layout is desperately needed for the site. In 5 minutes, I created this potential one. The blue box is a large parking garage- or surface lot alone if any of the buildings have parking underneath- that could easily accommodate hundreds or 1000+ cars. The black lines are new streets, including extensions of Reeb and Barthman Avenues. The yellow line is a new sidewalk along the entire site on Wall Street, and each new street would have connecting sidewalks. The orange boxes are potential buildings, each between 1/2-1.2 acres in size. For comparison, the entire HighPoint project on High Street Downtown is about 1.3 acres. That’s more than large enough to accommodate 100-300 units each depending on the number of floors. That means the 6 buildings could potentially provide 6x-9x the housing units that the original proposal provides, even with just 3 or 4-story buildings.
Furthermore, any of the buildings could incorporate retail/restaurant space, something this part of the South Side really doesn’t have outside of strip centers. Those spaces would be particularly attractive facing the 1.5-acre park carved out in the center of the site. I noticed in the original plan that they have retention ponds. If they are necessary, a central retention pond could be the key feature of this pocket park and event space.
You might say, however, that the developer might not have the financing to build all of this, and that’s true. However, just like Jeffrey Park in Italian Village, building one or 2 buildings at a time, letting them fill up and then building more over several years would not be out of the question. The site doesn’t have to be developed all at once. The developer can build the 3 buildings originally planned and then fill out the rest of the site over time. The point is to do it right, not fast.
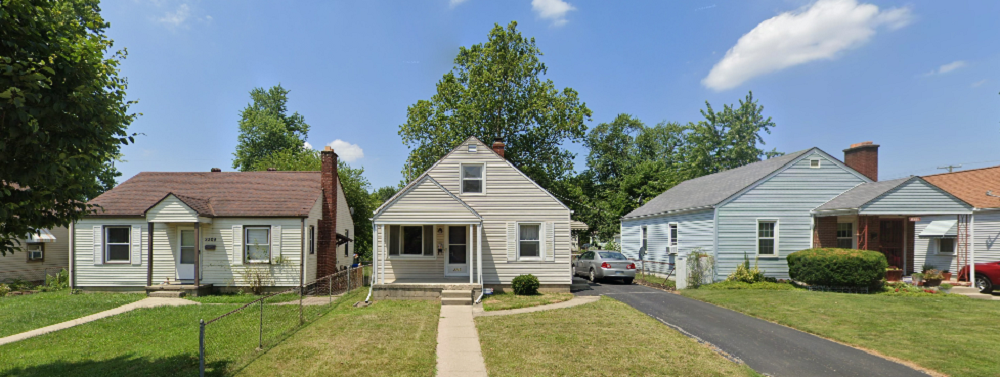
329 Loeffler Avenue

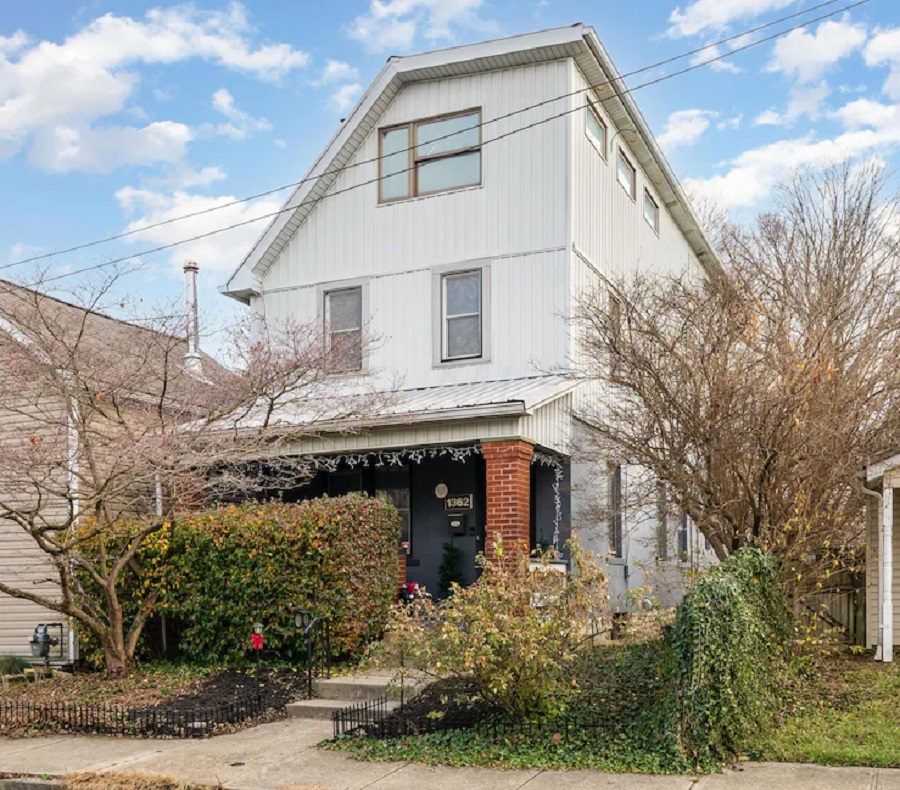
329 Loeffler Avenue.


The Plan
Another proposal that seeks to demolish a part of old Columbus is the 7-townhome proposal from, it seems, an R and R Construction. Most of the land for the proposal is vacant and has been for years, but there is a lone brick house at the corner of Loeffler and Carrie Avenue that the company wants to demolish for the project. The house dates back to between 1890-1905.
The Problem
There is, quite plainly, no reason the house needs to be demolished. While it is vacant, auditor records list the house in fair condition, so it’s hardly beyond saving. It can be renovated. Furthermore, the location on the corner means that it is not actually in the way of the project overall. The proposed layout below shows the location of the house in the red box.

The Solution
There is no reason that the new building on Loeffler needs to extend to the corner. It could just be a 3-unit building on that section instead of 4, with the house being renovated on the corner. It’s location does not interfere with the other 3 units facing the back alley whatsoever and the overall number of units for the project would still be 7. The house is a part of the neighborhood’s history. Regardless of how it may look at the moment, it’s condition means that it is not structurally deficient, so it can remain and should. Brick homes like this are being lost for all sorts of reasons- neglect, arson, new development- but this is a perfect example where location makes it a great candidate for saving.

While these are recent, the fact is that such poor project proposals come out almost every month, and there is often little to no pushback from neighborhood commissions or the city to do better. While solutions and better options exist, we’re missing out on creating better, richer neighborhoods that both embrace new development while encouraging preservation and higher standards for residents. I encourage anyone who can to contact these companies, the city and neighborhood commissions to speak out. Even if you disagree with my particular take on these proposals, collectively more voices should be heard in the direction that development in Columbus takes.


Random Columbus Photos 11

Photo Location: Intersection of McKinley Avenue and North Souder Avenue, looking west.
Photo Date: March, 1913
Photo History: The Great Flood of 1913 was the most devastating and deadly flood in Ohio history. 6″-12″ of rain fell between March 23-27, 1913 as two weather systems followed one after the other. Most of the rain fell across the headwaters of major rivers, including the Scioto. The subsequent flood destroyed levees in Columbus and flooded parts of Franklinton- among other areas- with up to 17′ of water with a record crest. The entire riverfront suffered heavy damage with hundreds of buildings damaged or destroyed. 100 people were reportedly killed around the city. Floods like 1913- and later in 1959- eventually led to the federal government limiting new development and investment in Franklinton, which caused it to decline for decades. It wasn’t until 2004 with the completion of the Franklinton floodwall that those limitations were lifted.
Random Columbus photos 11 Columbus, Ohio Flood of 1913

The same view today.

Columbus wasn’t the only victim of this great flood. Virtually every major city saw some significant impact, but Dayton arguably got it much worse than any other.


Housing Market Update January 2023


Housing market update January 2023

The Housing Market Update January 2023 data, the first of the new year, from Columbus Realtors showed that home sales and overall supply continued to decline, helping to ensure most areas saw continued increases in median prices.

Note: LSD= Local School District, CSD= City School District. In both cases, school district boundaries differ from city boundaries.

Housing Market Update January 2023 county closed sales
Housing market update January 2023 county closed sales % change
Closed sales are those sales that were completed during the month. 7 of the 10 metro counties saw declines in January
Housing market update January 2023 best closed sales
Housing market update January 2023 worst closed sales
Only 9 of more than 40 local markets were up year-over-year.
Housing market update January 2023 county median price
Housing market update January 2023 county median price change
Housing market update January 2023 median price % change
Not sure what was going on in Union County in January, but it was well above all other counties for the month. The market overall continued to be up on price year-over-year, except in Pickaway County.
Overall Market Median Sales Price in January 2023: $307,289
Based on the 10 Columbus Metro Area counties, the metro price saw a more than $39,000 increase over January, 2022.
Overall Market Median Sales Price % Change in January, 2023 vs. January, 2022: +14.6%
Continuing home sale declines had relatively little impact on home prices overall, which saw a strong increase over the year.
Housing market update January 2023 least expensive markets
Housing market update January 2023 most expensive markets
Housing market update January 2023 lowest market price change
Housing market update January 2023 highest market price change
It seems the Intel project’s impact may finally be making an appearance in housing numbers, with the Johnstown district seeing a huge increase in median home prices versus January 2022, 2 months before the project became official. That said, New Albany had one of the areas largest declines, but that could be due to it generally being one of the most expensive markets last year.
Housing market update January 2023 new listings by county
Housing market update January 2023 new listings change
New listings across most of the metro area were down, accounting for most of the median price increase as demand remains strong in the region. Most of the decrease came from Franklin County.
Total Metro New Listings in January, 2023: 1,612
Total Metro New Listings Change from January, 2022 to January, 2023: -316
Housing market update January 2023 most market listings
Housing market update January 2023 fewest market listings
Housing market update January 2023 county days on market
Housing market update January 2023 days on market change
Average # of Days Homes Remain on the Market Before Sale for the Metro Overall in January, 2023: 34.0
# of Days Homes Remain on the Market Before Sale for the Metro January, 2022 to January, 2023: +8.8

Homes continued to sell more slowly than they did a year ago, now more than a week more slowly on average.
Housing market update January 2023 fastest selling markets
Housing market update January 2023 slowest selling markets
Housing market update January 2023 market sale days increase
Housing market update January 2023 market sale days decline


Before and After Big Bear’s First Store

This edition of Before and After Big Bear’s First Store, we look at the chain’s original location. Big Bear grocery stores were founded in November, 1933 in Columbus. The first store in what would eventually become a significant regional chain, was located at 386 W. Lane Avenue.
The building was originally built as the “Crystal Slipper” ballroom, which opened in June, 1926. The ballroom was designed to hold 7,000 people and was called “America’s Most Beautiful Ballroom” by the developer, the Stadium Ovals Company. The ballroom itself was open less than a year, and the building was later used for various purposes into the early 1930s.
Before and After Big Bear's First Store The Crystal Slipper

The Crystal Slipper finishing construction in 1926.


Big Bear would purchase the building and renovate it into a grocery store over the winter of 1933-1934. The location subsequently opened on February 15, 1934. The 47,000 square foot store was said to have attracted 200,000 people on opening day, the success of which allowed the company to open a second store less than a year later.
Before: The first Big Bear store sometime in the late 1950s-early 1960s.
Before and After Big Bear's First Store
Big Bear was quite innovative for its time. It was the first self-serve supermarket in the Midwest and the first to use grocery conveyor belts for cashiers, for example.
The company eventually grew to include about 100 locations.
Ironically, a company that started as innovative ultimately failed because of a lack of innovation and maintenance of quality and service. In 1989, the company was purchased by Penn Traffic, a company that already owned several other chains in the Midwest. Unfortunately, it didn’t exactly have the cash to be buying the chain, and loaded Big Bear with debt. In 1993, newly-appointed CEO Philip Hawkins began cost-cutting measures. These measures included reducing staff and staff hours, and lowering product quality. Store conditions deteriorated and customers began choosing other supermarket chains.
By 2003, the company was being run into the ground. Customer volume had dropped to where the company could no longer pay vendors, so shelves were regularly empty of many products. This was the final death spiral. In 2004, Penn Traffic filed for bankruptcy and all remaining Big Bear stores were closed.
After: This 2021 image shows the site today.
Before and After Big Bear's First Store the location today
This particular location closed long before the company did- it closed in 1985 and the original building was demolished. Several years later, the current Riverwatch Tower was constructed on site.


2022 Final Housing Market Update


2022 final housing market update Columbus, Ohio

The 2022 final housing market update looks at the overall market performance for the year versus 2021.

Note: LSD= Local School District, CSD= City School District. In both cases, school district boundaries differ from city boundaries.

2022 final housing market update county closed sales
2022 final housing market update county closed sales change
Closed sales are those sales that were completed during the year. 7 of the 10 metro counties saw declines vs. 2021.
2020 final housing market update best markets for closed sales
2022 final housing market update worst markets for closed sales

2022 final housing market update county median price
2022 final housing market update county median price change
2022 final housing market update county median price % change

Overall Market Median Sales Price in 2022: $298,748
Based on the 10 Columbus Metro Area counties, the median price increased by $34,139 over 2021.
Overall Market Median Sales Price % Change in 2022 versus 2021: +12.9%

2022 final housing market update least expensive markets
2022 final housing market update most expensive markets

2022 final housing market update best market median price change
2022 final housing market update worst markets for price change
Best in the case of market median price % change is subjective. For buyers, it would be prices that have increased the least or even declined, while for sellers it would be the largest increases.

2022 final housing market update county new listings
2022 final housing market update county new listings change
Total Metro New Listings in 2022: 31,652
Total Metro New Listings Change from 2021 to 2022: -3,508
Thousands of fewer homes going to market helped keep prices rising across the metro despite a significant slowdown in overall sales.

2022 final housing market update most new listings
2022 final housing market update fewest new listings

2022 final housing market update county days before sale
2022 final housing market update county days before sale change
Average # of Days Homes Remain on the Market Before Sale for the Metro Overall in 2022: 20.0
# of Days Homes Remain on the Market Before Sale % Change for the Metro 2021 vs. 2022: +9.3%

2022 final housing market update fastest selling markets
2022 final housing market update slowest selling markets

2022 final housing market update fastest selling market change
2022 final housing market update slowest selling market change

2022 final housing market update highest price received
2022 final housing market update lowest list price received
This new data shows whether a market was receiving more or less than the original list price for the homes for sale. Those above 100% were markets that typically had buyer competition to the point where they had to pay more than list. Those below 100% were the opposite, where relatively lower demand allowed some buyers to get a home for under list.

And there you have it, the final housing market update for 2022!