Okay, maybe not the coolest link, but still… The Mortgage Interest Deduction is basically a government subsidy that specifically targets single-family home ownership. What this means is that it’s basically money to build more sprawl. Today’s link shows several interactive maps on this topic, and you can search all the way down to the zip code. For Columbus, those who take advantage of this deduction live far more in the suburbs than in the inner core, not surprisingly.
This Columbus housing market update for March 2013 includes an expansion of data, specifically the time it takes for homes to sell on the current market.
Note: LSD= Local School District, CSD= City School District. In both cases, school district boundaries differ from city boundaries.
Top 15 Most Expensive Locations By Median Sales Price in March 2013 1. New Albany: $471,000 2. Dublin: $330,000 3. Powell: $317,000 4. New Albany Plain LSD: $316,000 5. Upper Arlington CSD: $302,450 6. Olentangy LSD: $291,250 7. Granville CSD: $282,050 8. Downtown: $269,000 9. German Village: $267,250 10. Dublin CSD: $266,500 11. Hilliard: $250,000 12. Big Walnut LSD: $245,000 13. Buckeye Valley LSD: $243,000 14. Johnstown Monroe LSD: $207,250 15. Bexley: $205,000
Top 15 Least Expensive Locations by Median Sales Price in March 2013 1. Whitehall: $45,250 2. Obetz: $56,450 3. Groveport Madison LSD: $63,625 4. Hamilton LSD: $66,750 5. Columbus CSD: $85,000 6. Lancaster CSD: $89,550 7. Newark CSD: $89,900 8. South-Western CSD: $100,000 9. Columbus: $103,250 10. Sunbury: $106,900 11. Reynoldsburg CSD: $115,000 12. Jefferson LSD: $122,000 13. Blacklick: $123,500 14. London CSD: $128,000 15. Grandview Heights: $136,000
Whitehall was the cheapest market yet again, though its median prices have been going up slowly.
Overall Market Median Sales Price in March 2013: $139,028
Top 15 Locations with the Highest Median Sales Price % Growth Between March 2012 and March 2013 1. Minerva Park: +223.8% 2. Jonathan Alder LSD: +99.0% 3. Circleville CSD: +63.3% 4. Buckeye Valley LSD: +59.3% 5. Johnstown Monroe LSD: +53.5% 6. Reynoldsburg CSD: +47.4% 7. Hilliard: +47.1% 8. Downtown: +34.6% 9. Big Walnut LSD: +31.5% 10. Westerville CSD: +28.3% 11. Powell: +28.1% 12. Gahanna: +22.0% 13. Olentangy LSD: +18.4% 14. Marysville CSd: +14.8% 15. Worthington: +13.9%
Downtown continued to do well, but otherwise few places inside 270 did.
Top 15 Locations with the Lowest Median Sales Price % Growth Between March 2012 and March 2013 1. Grandview Heights: -43.7% 2. Sunbury: -42.6% 3. Obetz: -29.3% 4. Whitehall: -24.3% 5. Bexley: -21.1% 6. Lithopolis: -20.1% 7. Hamilton LSD: -15.8% 8. Blacklick: -12.0% 9. Pataskala: -9.2% 10. Delaware CSD: -5.3% 11. Gahanna Jefferson CSD: -5.1% 12. Beechwold/Clintonville: -4.1% 13. South-Western CSD: -2.9% 14. London CSD: -1.9% 15. Columbus CSD: -1.0%
Overall Market Median Sales Price % Change March 2012 vs. March 2013: +9.9%
Top 10 Locations with the Most New Listings in March 2013 1. Columbus: 1,309 2. Columbus CSD: 811 3. South-Western CSD: 221 4. Olentangy LSD: 197 5. Hilliard CSD: 195 6. Westerville CSD: 185 7. Dublin CSD: 140 8. Pickerington LSD: 100 9. Worthington CSD: 97 10. Dublin: 93
Top 10 Locations with the Fewest New Listings in March 2013 1. Valleyview: 1 2. Lithopolis: 2 3. Minerva Park: 4 4. Jefferson LSD: 6 5. Johnstown Monroe LSD: 8 6. Jonathan Alder LSD: 9 7. Obetz: 10 8. Hamilton LSD: 13 9. Grandview Heights: 14 10. Sunbury: 17 11. Circleville CSD: 17
Total New Listings in the Columbus Metro in March 2013: 3,222 Overall Metro New Listings % Change March 2012-March 2013: +0.2%
Prices were up almost 10% year over year for the month despite a small increase in overall supply.
Top 10 Fastest-Selling Locations by # of Days Homes Remain on the Market Before Sale in March 2013 1. Minerva Park: 3 2. Worthington: 29 3. Granville CSD: 35 4. Jonathan Alder LSD: 36 5. Upper Arlington CSD: 51 6. Downtown: 54 7. Pickerington: 54 8. Pickerington LSD: 60 9. Dublin CSD: 61 10. Grandview Heights: 63 11. Groveport Madison LSD: 63 12. Reynoldsburg CSD: 63 13. South-Western CSD: 63 14. Grove City: 65 15. Powell: 65
Top 10 Slowest-Selling Locations by # of Days Homes Remain on the Market Before Sale in March 2013 1. Bexley: 188 2. Circleville CSD: 168 3. Sunbury: 163 4. Lancaster CSD: 140 5. Big Walnut LSD: 129 6. Hilliard: 125 7. Lithopolis: 121 8. Newark CSD: 120 9. Obetz: 119 10. Gahanna: 117
The Columbus Realtors provides market condition reports going back many years.
In a first of its kind, this is the Columbus housing market update for December 2012. In it, the local housing market will be detailed by categories such as most expensive market, market listing rankings and more.
Note: LSD= Local School District, CSD= City School District. In both cases, school district boundaries differ from city boundaries.
Top 15 Most Expensive Locations By Median Sales Price in December 2012 1. New Albany: $535,000 2. New Albany Plain LSD: $397,450 3. German Village: $376,000 4. Grandview Heights: $362,500 5. Powell: $354,950 6. Dublin: $343,600 7. Granville CSD: $330,000 8. Bexley: $325,000 9. Upper Arlington CSD: $319,500 10. Olentangy LSD: $315,000 11. Big Walnut LSD: $306,250 12. Dublin CSD: $271,500 13. Worthington: $$270,000 14. Buckeye Valley LSD: $259,000 15. Sunbury: $253,000
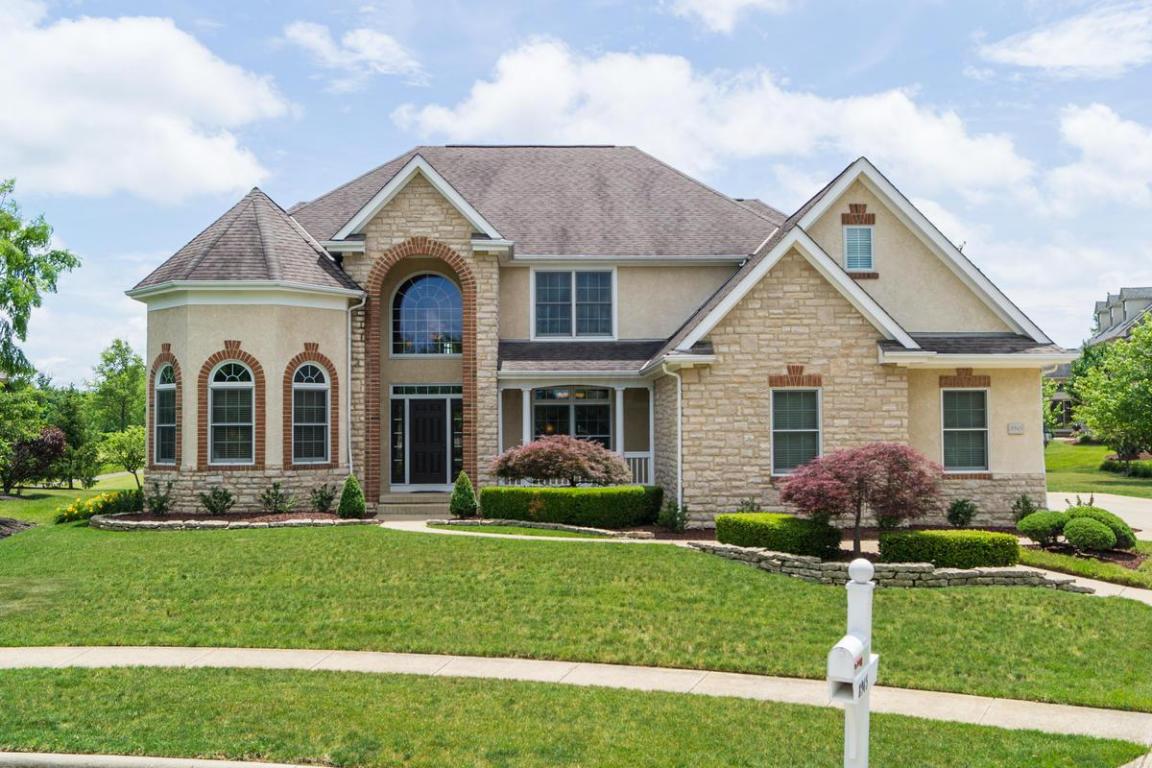
New Albany was by far the most expensive local market around Columbus.
Top 15 Least Expensive Locations by Median Sales Price in December 2012 1. Obetz: $80,100 2. Hamilton LSD: $80,100 3. Whitehall: $85,950 4. Newark CSD: $86,900 5. Lancaster CSD: $103,000 6. Jefferson LSD: $123,000 7. London CSD: $124,000 8. Groveport Madison LSD: $125,900 9. Reynoldsburg CSD: $125,950 10. Columbus CSD: $129,900 11. South-Western CSD: $131,000 12. Columbus: $140,026 13. Jonathan Alder LSD: $150,000 14. Minerva Park: $159,500 15. Grove City: $160,950
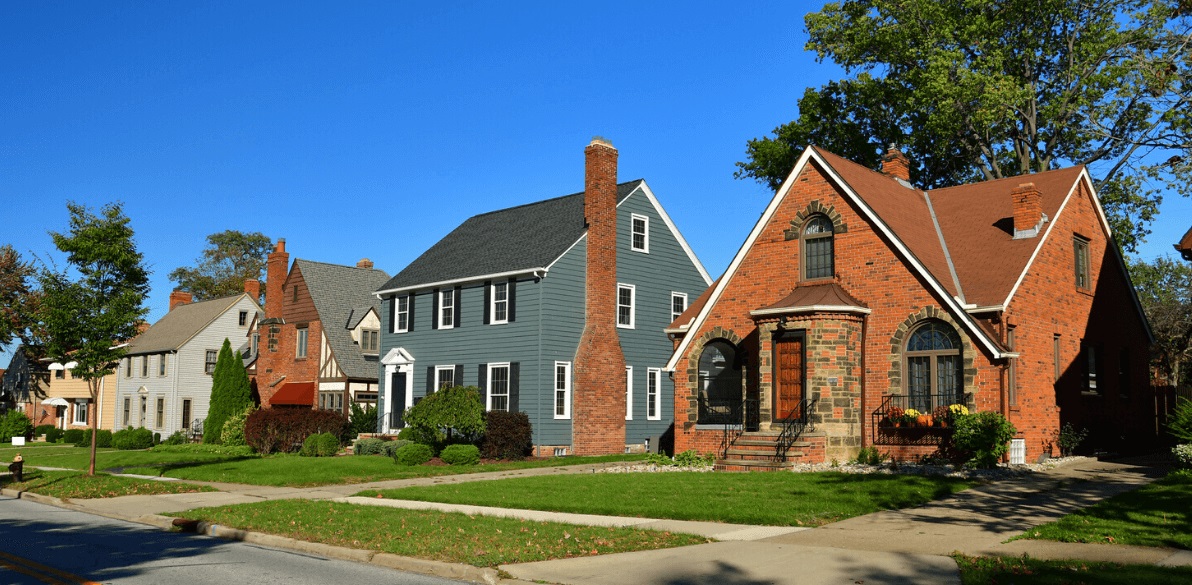
Southern and eastern suburbs tend to perform best on this list, as well as Columbus itself.
Overall Market Median Sales Price in December 2012: $158,645
Top 15 Locations with the Highest Median Sales Price % Growth Between December 2011 and December 2012 1. Whitehall: +69.5% 2. Circleville CSD: +64.9% 3. Sunbury: +63.0% 4. Jefferson LSD: +53.5% 5. Big Walnut LSD: +44.1% 6. Canal Winchester CSD: +40.9% 7. Westerville: +29.8% 8. Westerville CSD: +27.3% 9. Powell: +25.4% 10. Pataskala: +24.0% 11. Olentangy LSD: +23.5% 12. Gahanna Jefferson CSD: +21.8% 13. Grandview Heights: +21.2% 14. Granville CSD: +20.0% 15. Pickerington: +17.7%
Top 15 Locations with the Lowest Median Sales Price % Growth Between December 2011 and December 2012 1. London CSD: -53.5% 2. Obetz: -38.3% 3. Hamilton LSD: -27.1% 4. Jonathan Alder LSD: -25.2% 5. Buckeye Valley LSD: -23.0% 6. Reynoldsburg CSD: -18.7% 7. Hilliard: -17.7% 8. Lancaster CSD: -17.6% 9. Grove City: -15.3% 10. Dublin CSD: -12.8% 11. Johnstown Monroe LSD: -10.8% 12. Upper Arlington CSD: -8.5% 13. Newark CSD: -8.1% 14. Dublin: -7.1% 15. South-Western CSD: -6.4%
Overall Market Median Sales Price % Change December 2011 vs. December 2012: -0.3%
Top 10 Locations with the Most New Listings in December 2012 1. Columbus: 829 2. Columbus CSD: 544 3. South-Western CSD: 136 4. Olentangy LSD: 122 5. Westerville CSD: 100 6. Hilliard CSD: 94 7. Dublin CSD: 89 8. Worthington CSD: 66 9. Dublin: 64 10. Pickerington LSD: 60
Top 10 Locations with the Fewest New Listings in December 2012 1. Valleyview: 0 2. Lithopolis: 1 3. Sunbury: 2 4. Minerva Park: 2 5. Obetz: 3 6. Johnstown Monroe LSD: 5 7. Jefferson LSD: 8 8. German Village: 8 9. Hamilton LSD: 8 10. Whitehall: 11 11. Granville CSD: 12
Total New Listings in the Columbus Metro in December 2012: 2,002 Overall Metro New Listings % Change December 2011-December 2012: +10.5%
Overall, prices are slightly down as supply is currently outstripping demand.
For more information on the local market, go here: Columbus Realtors